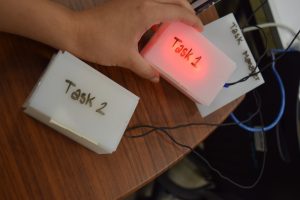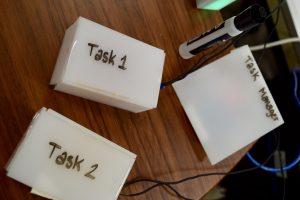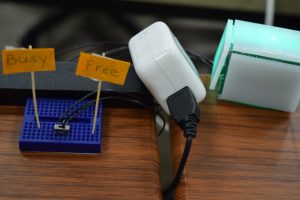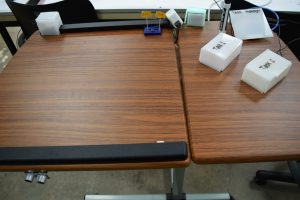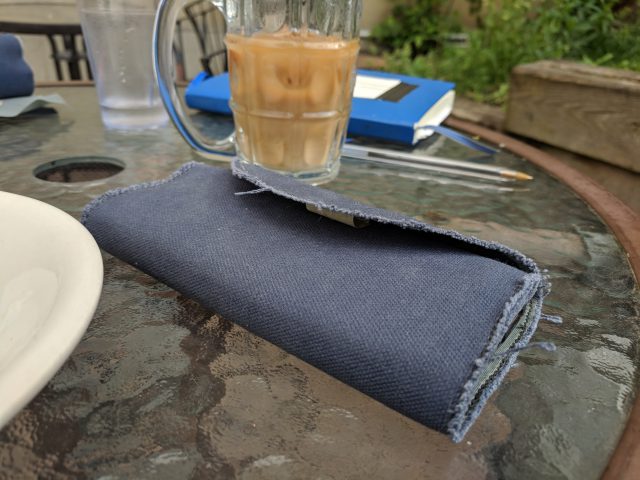
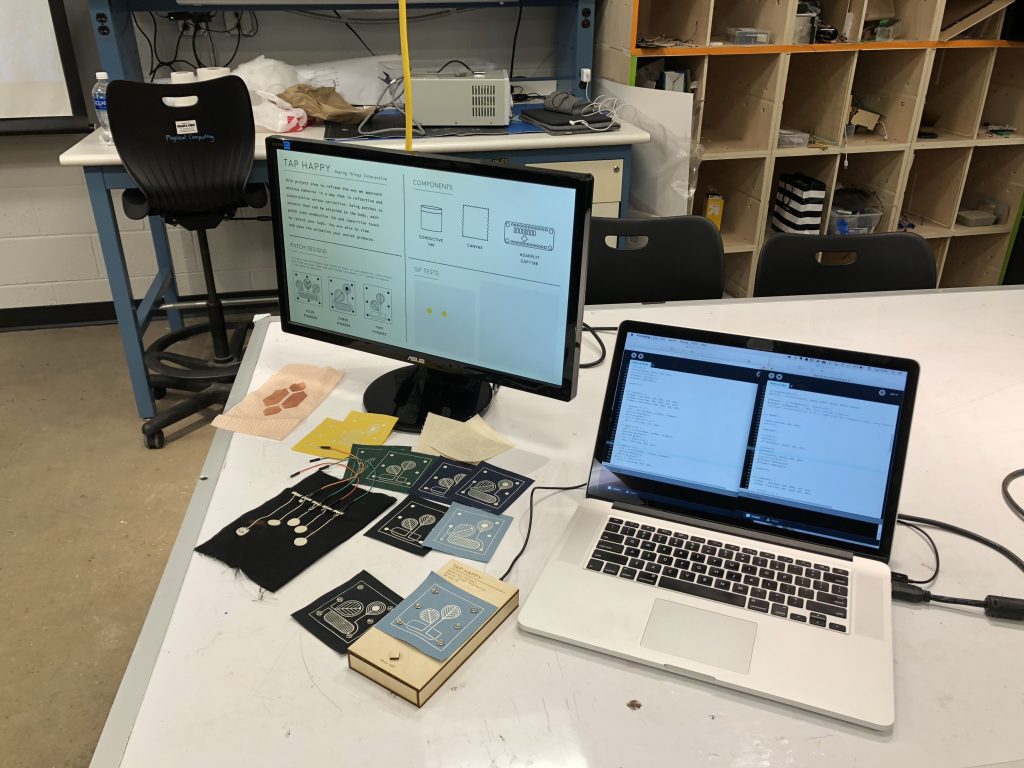
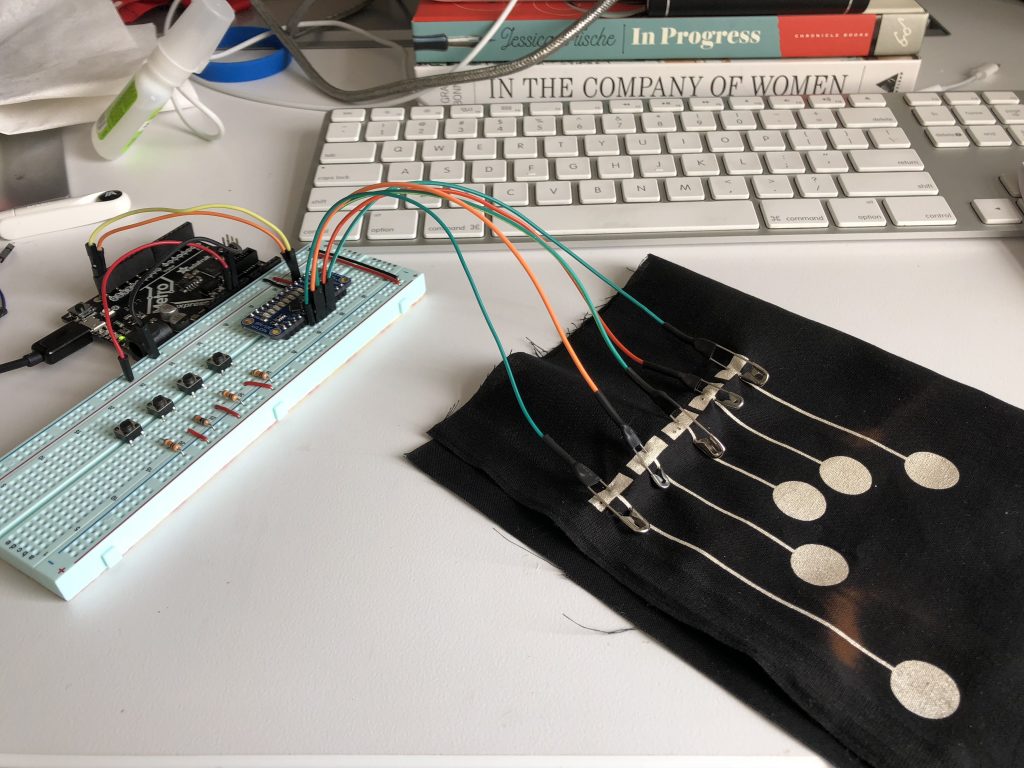
Final Presentation Setup:
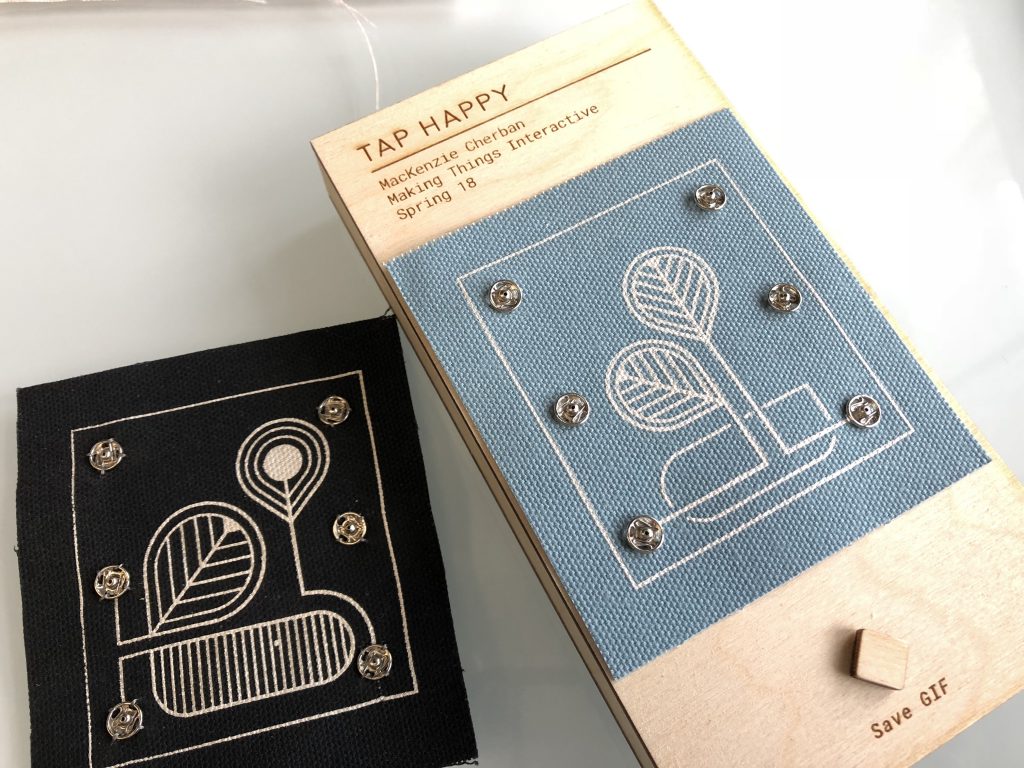
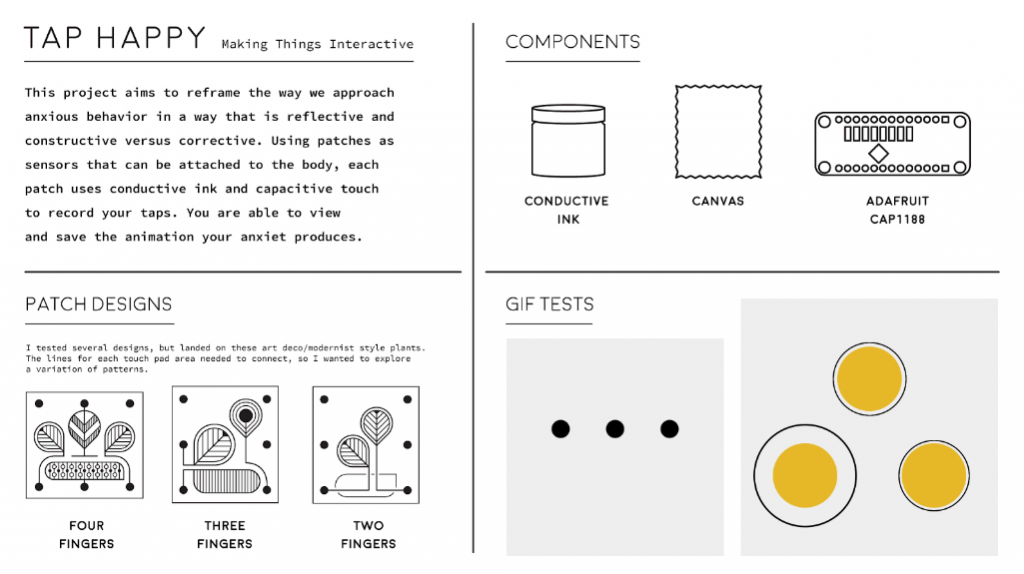
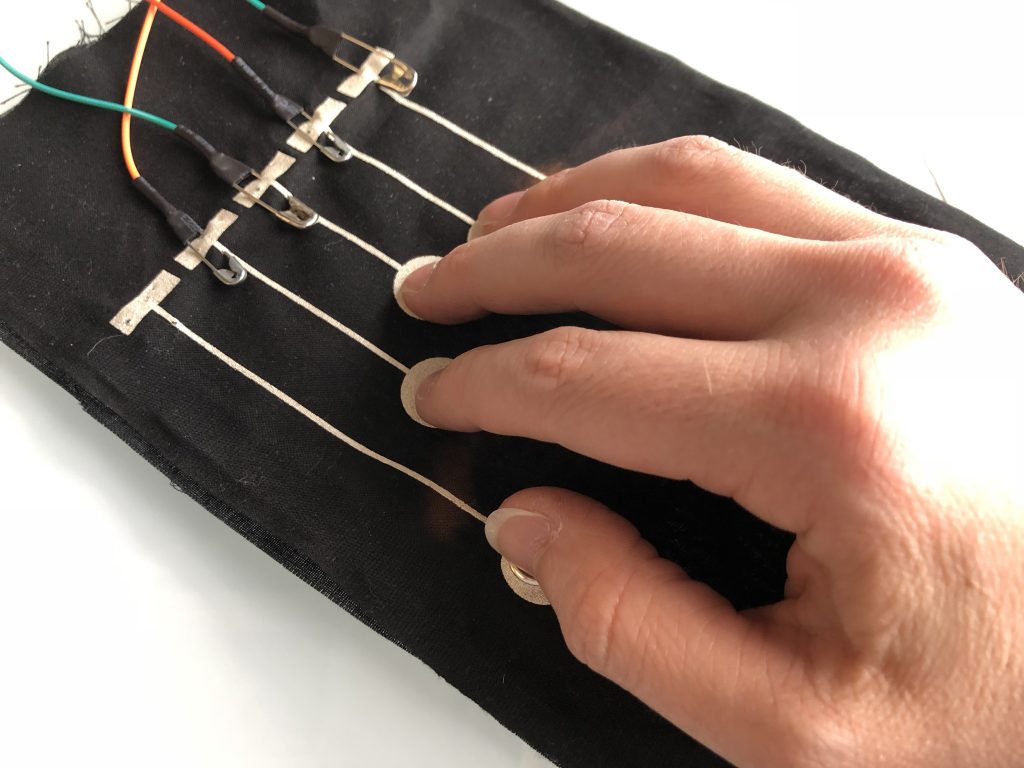
^ Two patches, one has two tappable areas, the other has three.
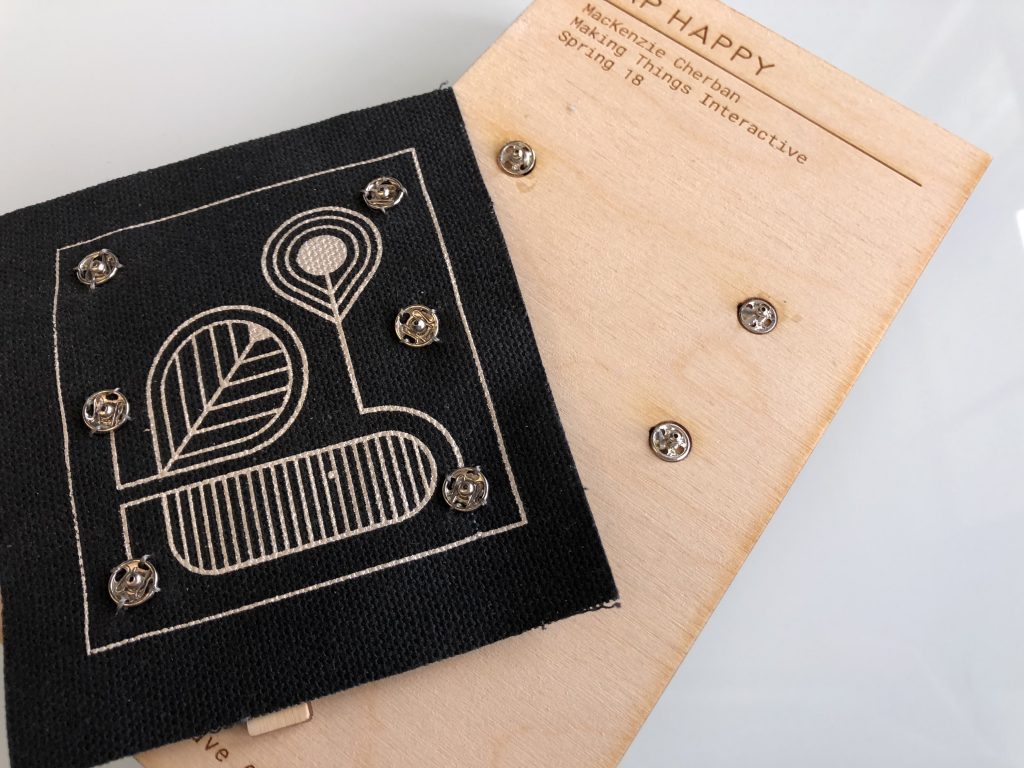
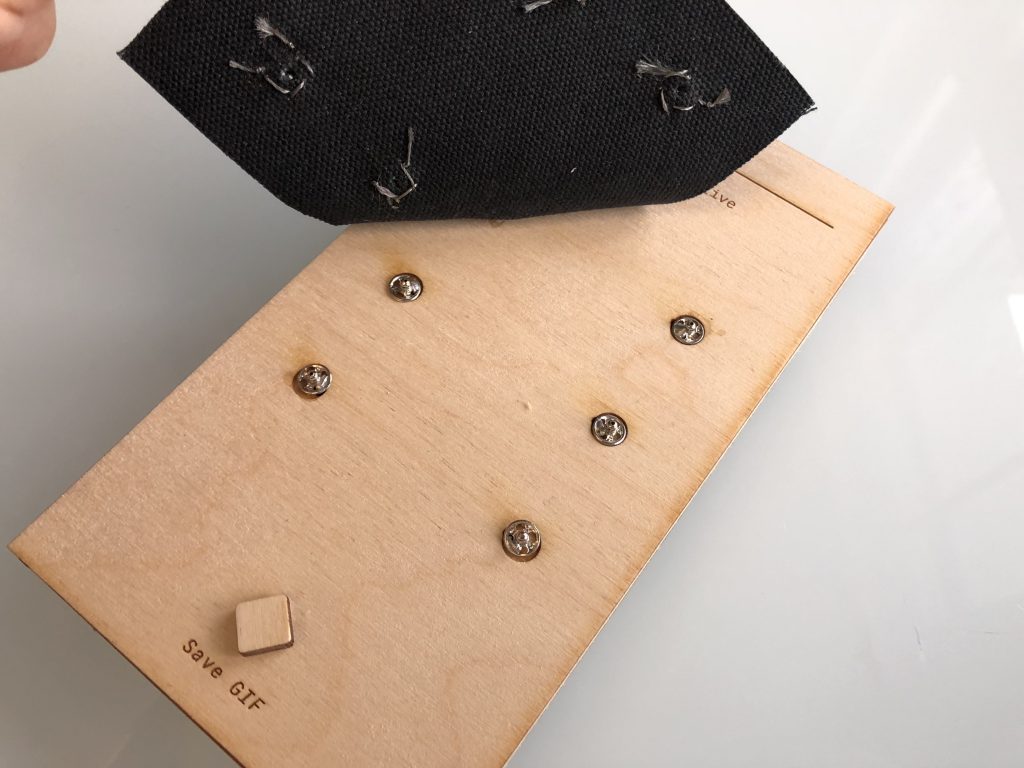
^ Swapping out the patches to test.
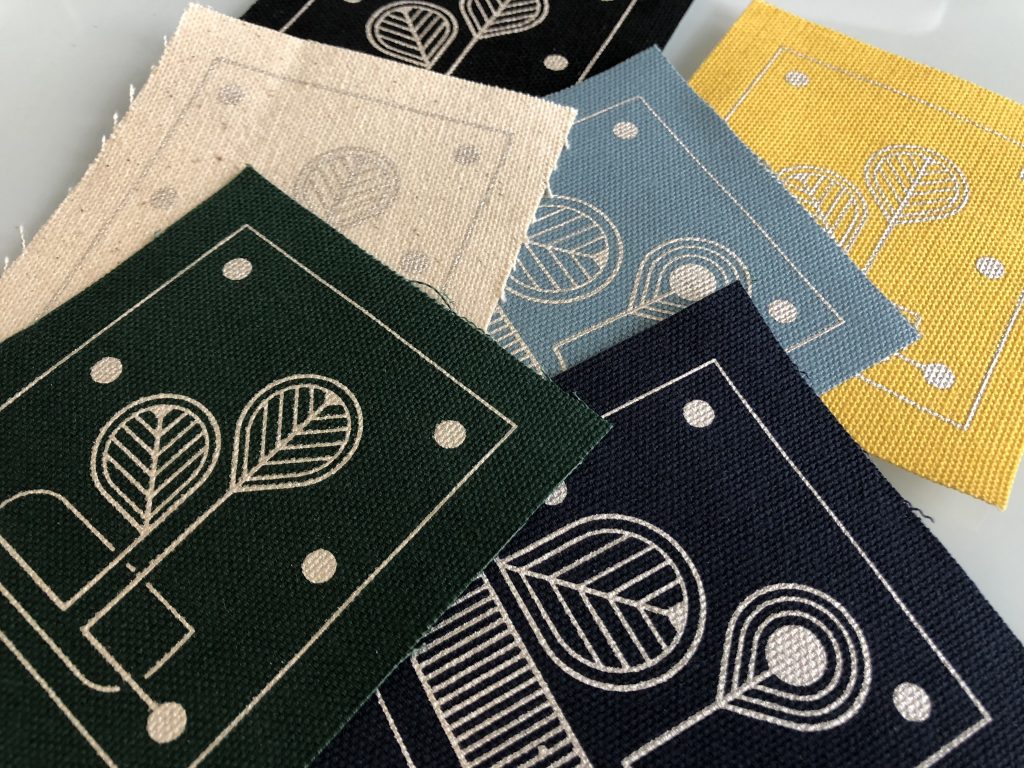
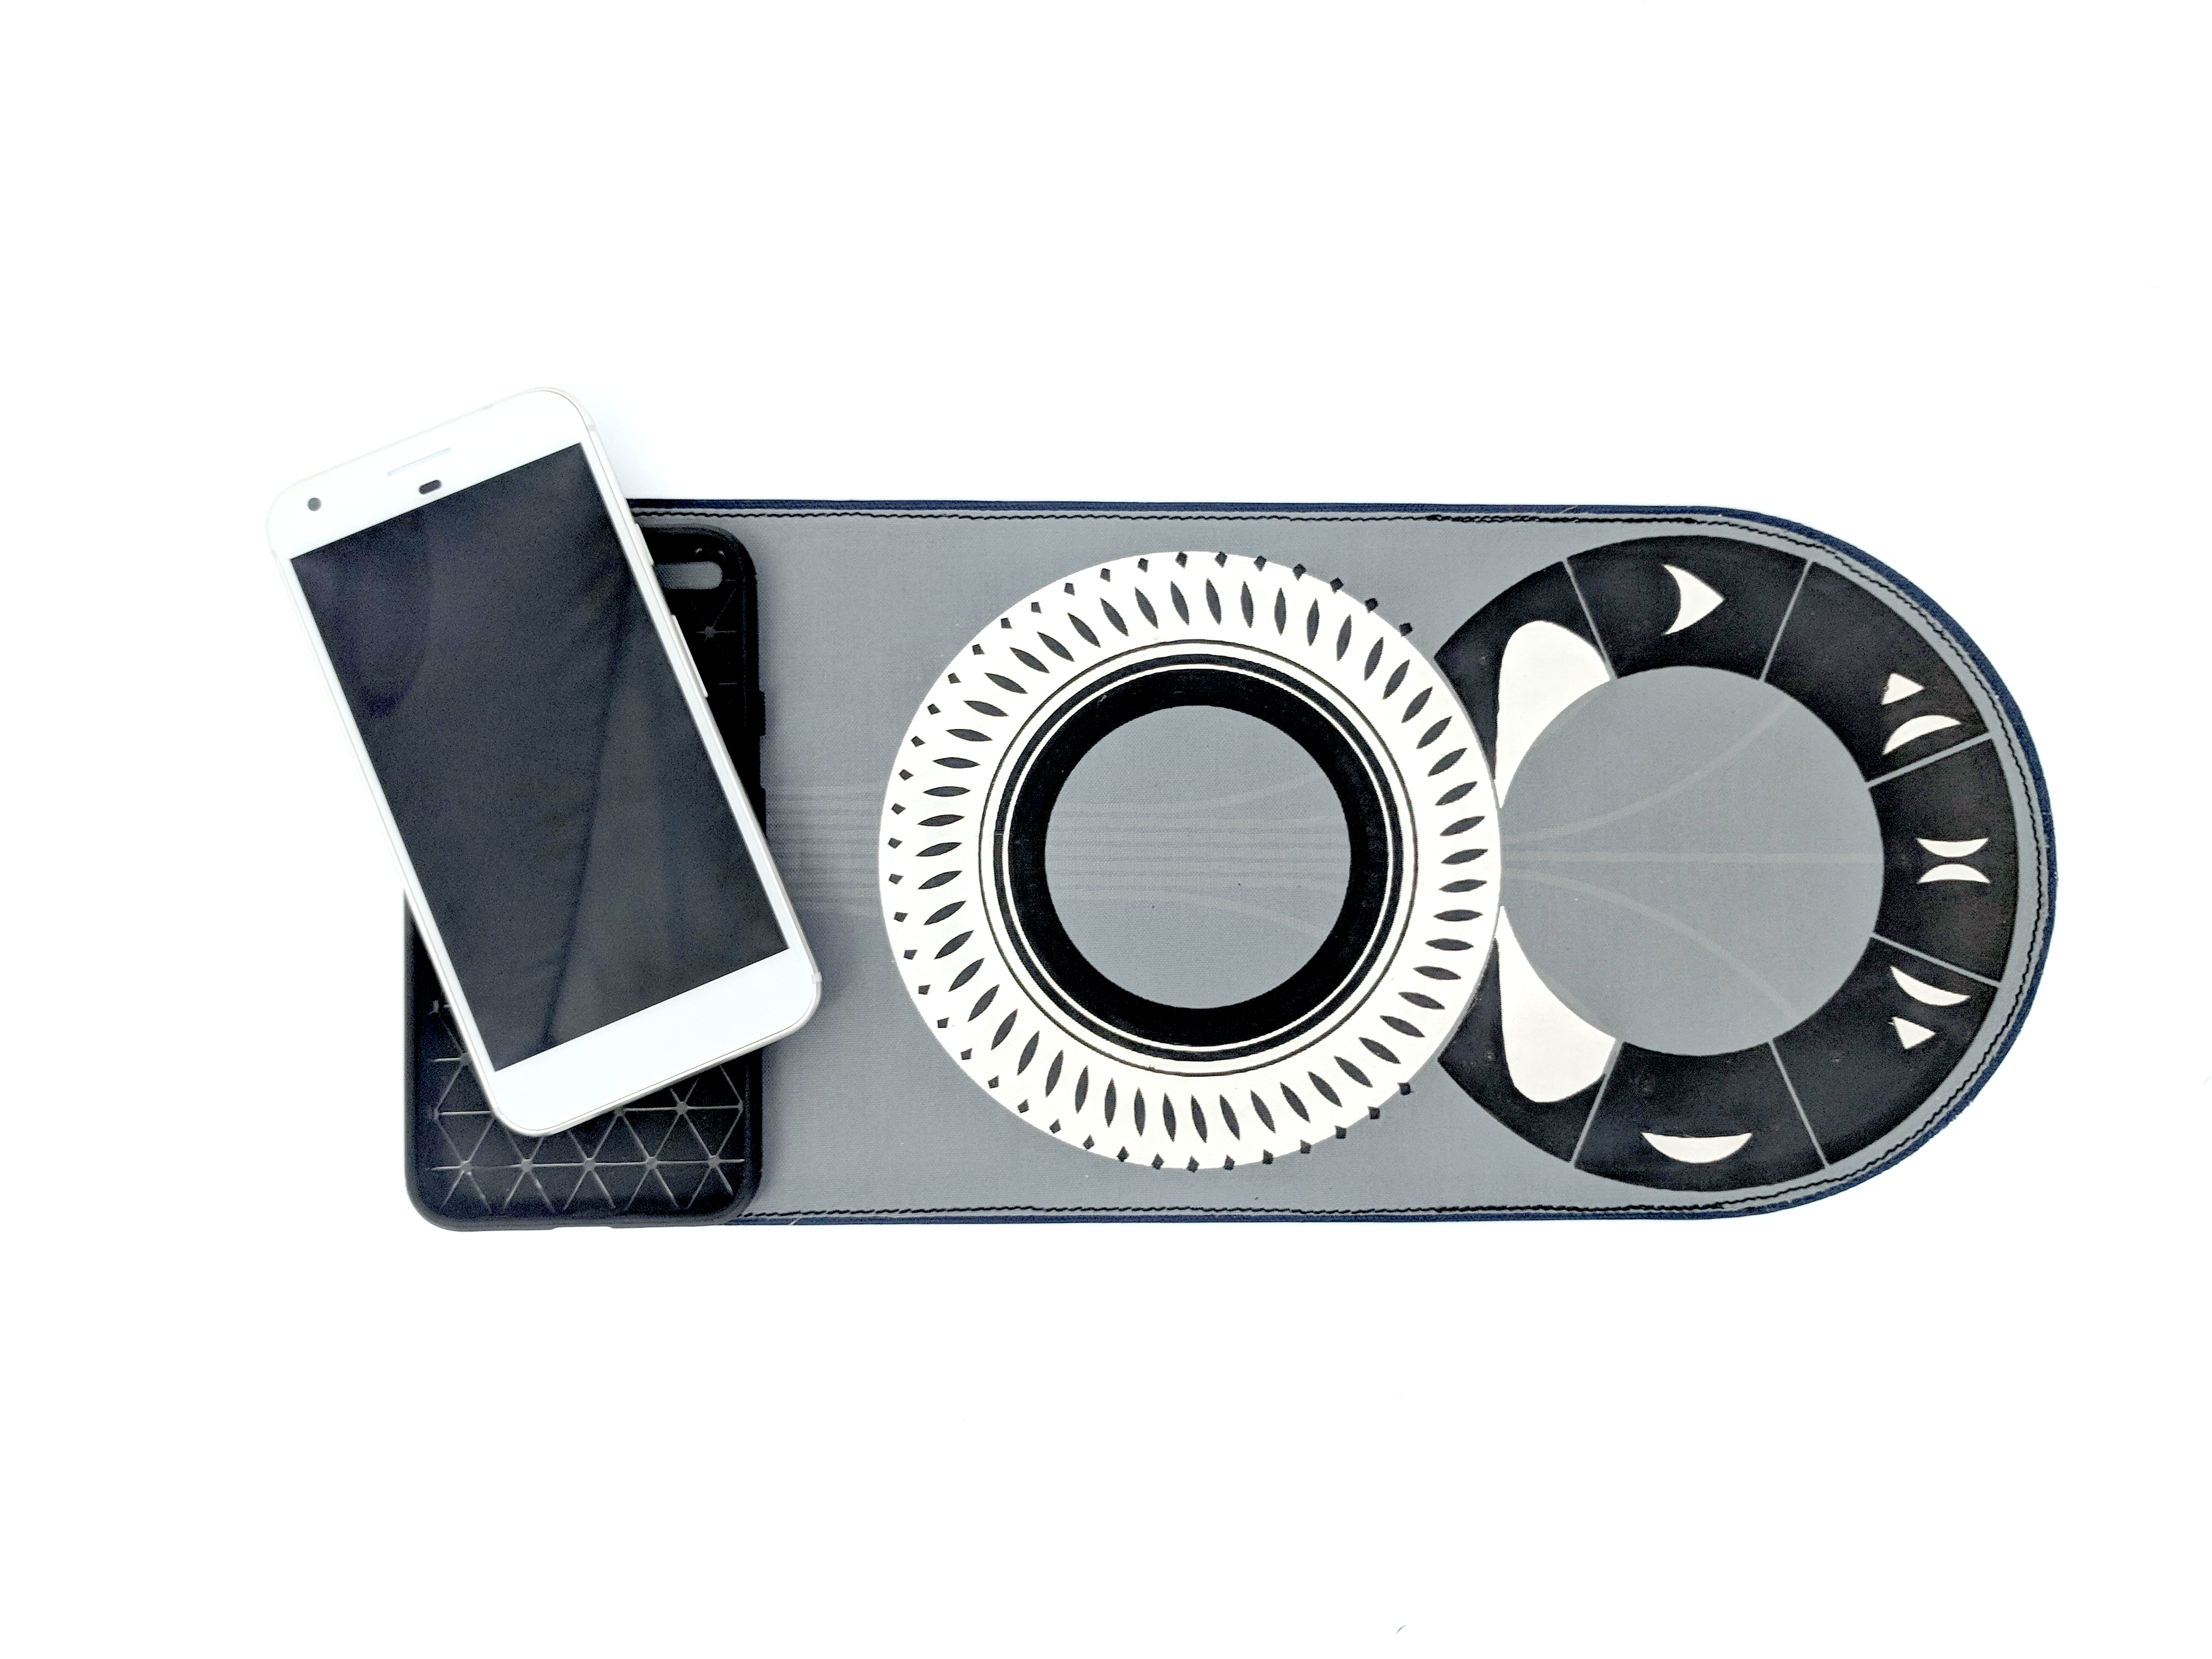
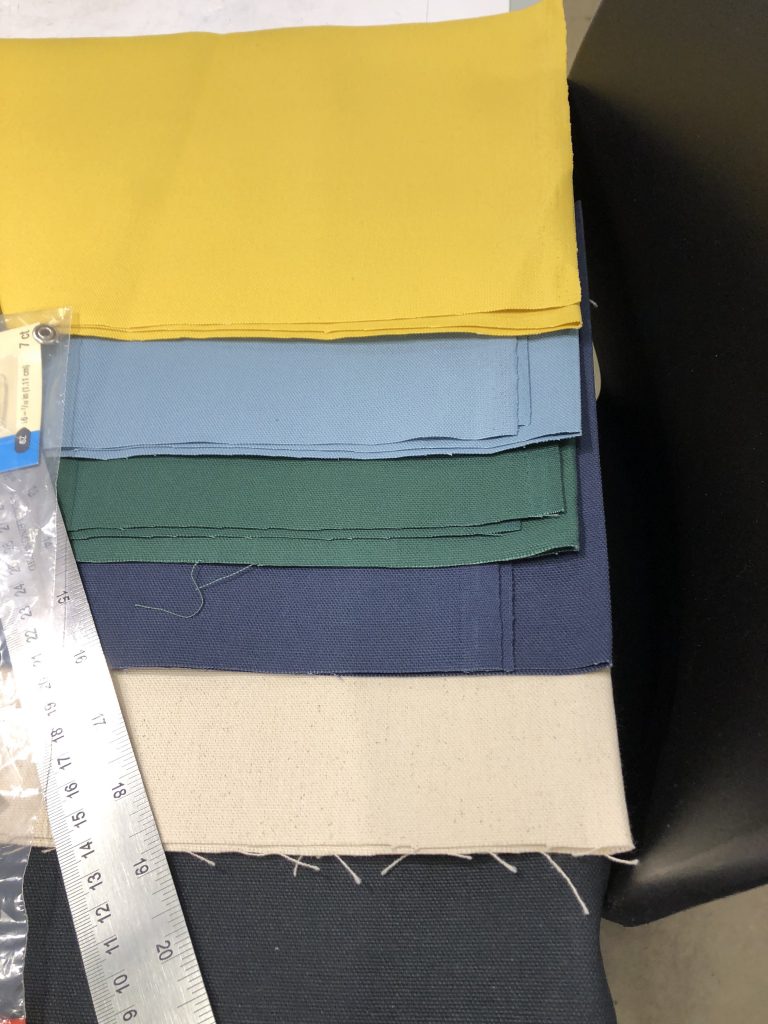
^ Design samples on the various colors of canvas. The texture was a bit too rough for this application.
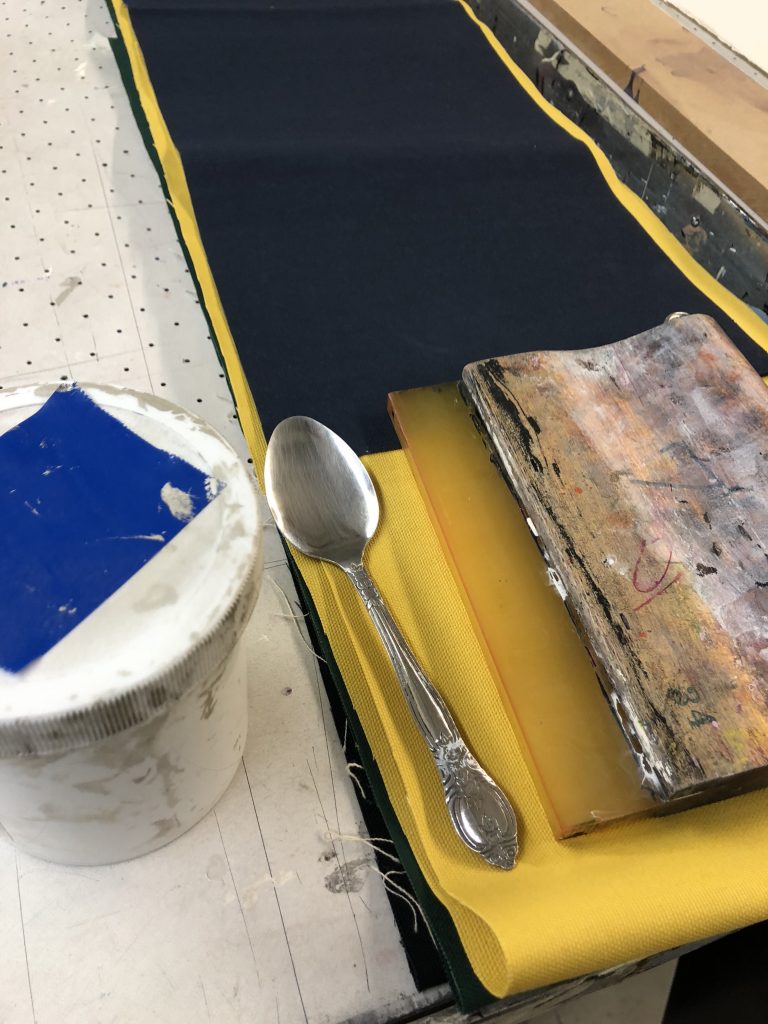
^ Process of making the patches
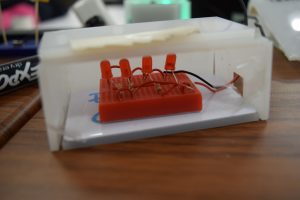
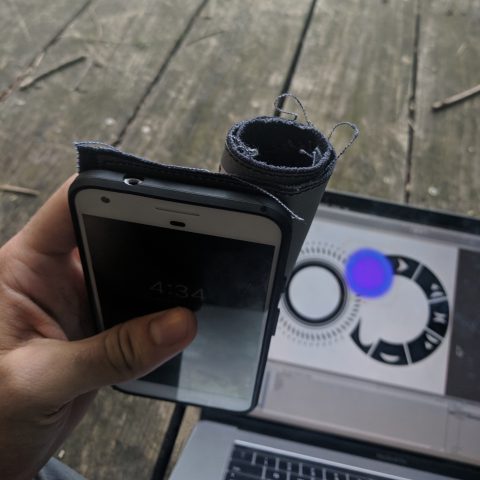
First Tests with taps + conductive ink:
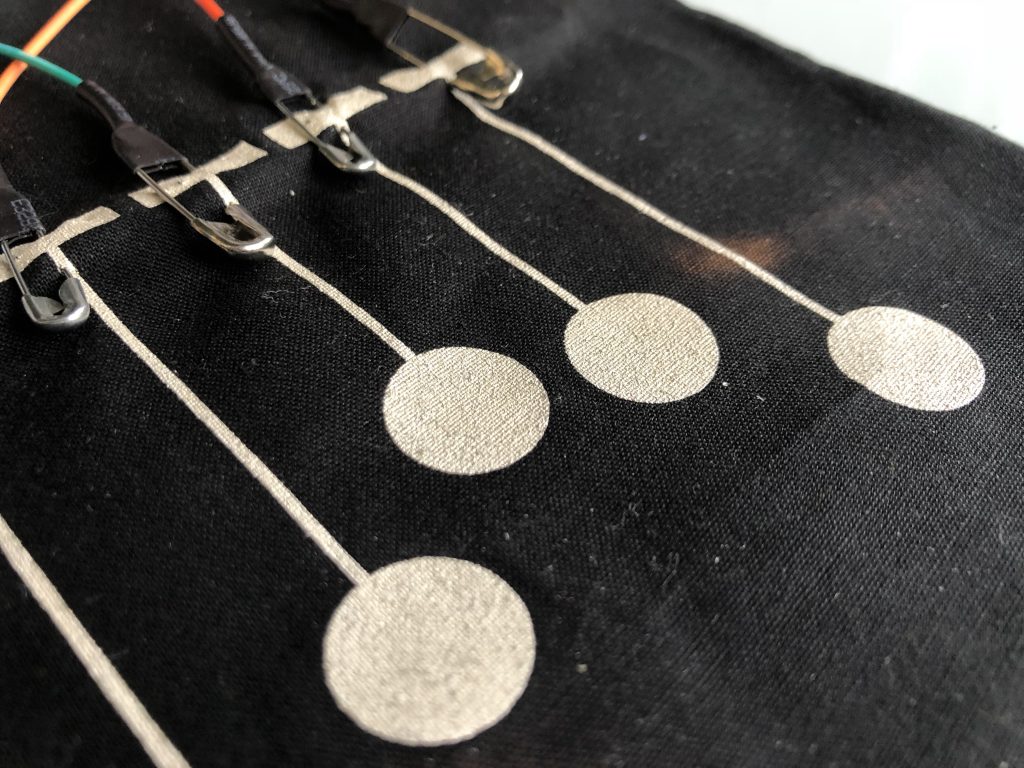
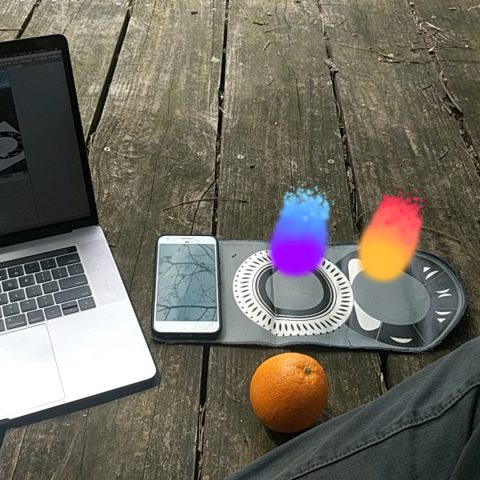
Example of two user animations, created on presentation day:


Arduino Code:
//--------CAP1188 SETUP --------
#include
#include
#include
#define CAP1188_SENSITIVITY 0x1F // Setting the sensitivity....lower the number the more sensitive!!
static const int CAP1188_RESET = 12; // Reset Pin is used for I2C or SPI
Adafruit_CAP1188 cap = Adafruit_CAP1188();
//------------------------------
const int numOfCaps = 3;
//-----CAP TOUCH Variables-----
uint8_t touched;
uint8_t light;
int capState[numOfCaps] = {0, 0, 0};
int lastCapState[numOfCaps] = {0, 0, 0};
int capCurrent[numOfCaps] = {false, false, false};
//-----TIMING N@T------
int pinState[numOfCaps] = {1, 1, 1}; //debouncing
bool timing[numOfCaps] = {false, false, false};
uint32_t dbTime = 20;
uint32_t eTime[numOfCaps] = {};
uint32_t dbStart[numOfCaps] = {};
uint32_t start[numOfCaps] = {};
uint32_t sendTime[numOfCaps] = {};
//-----TIMING BREAK-----
static const int btnPin = 2;
int btnState;
int lastBtnState;
void setup() {
Serial.begin(115200);
Serial.println("CAP1188 test!");
pinMode(btnPin, INPUT);
// Initialize the sensor, if using i2c you can pass in the i2c address
if (!cap.begin()) {
//if (!cap.begin()) {
Serial.println("CAP1188 not found");
while (1);
}
Serial.println("CAP1188 found!");
cap.writeRegister(CAP1188_SENSITIVITY, 0x6F);
}
void loop() {
touches(); // sensing for touches
for (int i = 0; i < numOfCaps; i++) {
touchOnce(i);
debounceBtn(i);
timeTest(i);
}
endSession();
}
void touches() {
touched = cap.touched();
light = cap.readRegister(0x3);
if (touched == 0) {
// No touch detected
return;
}
for (uint8_t i = 0; i < 8; i++) {
if (touched & (1 <<i> dbTime) {// db timer has elapsed
capState[n] = pinState[n]; // button state is valid
}
//+++++++++++++++++++++++++++++++++++
}</i>
void timeTest(int t) {
if (capState[t] == 0 && !timing[t]) { //if button state is NOT pressed and timing is NOT happening
sendTime[t] = 0;
start[t] = millis(); // start timing
timing[t] = true;
}
if (capState[t] == 1 && timing[t]) { //if button state is pressed and timing is happening
eTime[t] = (millis() - start[t]); // record elapsed time
sendTime[t] = eTime[t];
timing[t] = false;
}
}
void endSession() {
// read the pushbutton input pin:
btnState = digitalRead(btnPin);
// compare the buttonState to its previous state
if (btnState != lastBtnState) {
// if the state has changed, increment the counter
if (btnState == HIGH) {
Serial.println("E");
}
// Delay a little bit to avoid bouncing
delay(50);
}
// save the current state as the last state, for next time through the loop
lastBtnState = btnState;
}
void serialButtonCount() {
Serial.print(capCurrent[2]);
Serial.print(",");
Serial.print(capCurrent[1]);
Serial.print(",");
Serial.print(capCurrent[0]);
// Serial.print(" ");
Serial.print(",");
Serial.print(sendTime[2]);
Serial.print(",");
Serial.print(sendTime[1]);
Serial.print(",");
Serial.println(sendTime[0]);
}
Processing Code Two Tap:
import gifAnimation.*;
import processing.serial.*;
float x, y;
color col1, col2, col3;
color[] colorVal = new color[10];
String[] values;
GifMaker gifExport;
int frames = 0;
int bOne; //button one
int bTwo; //button two
int bThree; //button three
int tOne; //time one
int tTwo; //time two
int tThree; //time three
float colMap1, colMap2, colMap3;
float growMap1, growMap2, growMap3;
int endState = 0;
int lastEndState;
int xpos1, ypos1, xpos2, ypos2, xpos3, ypos3;
float radius1 = 100;
float radius2 = 100;
float radius3 = 100;
int pos1x = 200;
int pos1y = 550;
int pos2x = 400;
int pos2y = 250;
int pos3x = 400;
int pos3y = 550;
Circle myCircle;
int num = 0;
void setup() {
size(800, 800);
frameRate(12);
noFill();
ellipseMode(CENTER);
//colorMode(RGB, 255);
//update the serial port index based on your setup
Serial arduino = new Serial(this, Serial.list()[3], 115200);
arduino.bufferUntil('\n');
ellipseMode(RADIUS);
myCircle = new Circle(pos1x, pos1y, pos2x, pos2y, pos3x, pos3y);
gifExport = new GifMaker(this, "export.gif");
gifExport.setRepeat(0); // make it an "endless" animation
//gifExport.setTransparent(0, 0, 0); // make black the transparent color. every black pixel in the animation will be transparent
}
void draw() {
background(240, 240, 240);
noFill();
tapEvent();
fill(col2);
noStroke();
ellipse(pos2x, pos2y, 100, 100);
fill(col3);
noStroke();
ellipse(pos3x, pos3y, 100, 100);
//println(gifExport);
gifExport.setDelay(1);
gifExport.addFrame();
saveGif();
}
void tapEvent() {
colMap1 = map(tOne, 100, 2000, 255, 150);
colMap2 = map(tTwo, 100, 2000, 255, 150);
if (bThree == 1) {
col3 = color(colMap1, colMap2, 255);
myCircle.display();
myCircle.grow();
} else if (bThree == 0) {
col3 = color(240, 240, 240);
}
if (bTwo == 1) {
col2 = color(colMap1, colMap2, 255);
myCircle.display();
myCircle.grow();
} else if (bTwo == 0) {
col2 = color(240, 240, 240);
}
if (bOne == 1) {
col1 = color(colMap1, colMap2, 255);
myCircle.display();
myCircle.grow();
} else if (bOne == 0) {
col1 = color(240, 240, 240);
}
}
void saveGif() {
if (endState != lastEndState) {
// if the state has changed, increment the counter
if (endState == 1) {
boolean finished = gifExport.finish(); //exports gif
num++;
println(finished);
if (finished == true) {
gifExport = new GifMaker(this, "export" +str(num)+ ".gif");
gifExport.setRepeat(0); // make it an "endless" animation
}
endState = 0;
}
// Delay a little bit to avoid bouncing
delay(50);
}
// save the current state as the last state, for next time through the loop
lastEndState = endState;
}
void serialEvent(Serial p) { // code from Rebecca Fienbrink
String rawString = p.readString(); //read the string from serial
rawString = rawString.trim(); //trim any unwanted empty spaces
try { //split the string into an array of 2 value (e.g. "0,127" will become ["0","127"]
values = rawString.split(",");
//for(int i =0; i 1) {
bOne = int(values[0]); //convert strings to int
bTwo = int(values[1]); //convert strings to int
bThree = int(values[2]); //convert strings to int
tOne = int(values[3]);
tTwo = int(values[4]);
tThree = int(values[5]);
//println(values[0] + "," + values[1] + ","+ values[2] );
//println(values[3] + "," + values[4] + ","+ values[5] );
} else if (values.length == 1) {
endState = 1;
//println(end);
} else {
endState = 0;
}
}
catch(Exception e) {
println("Error parsing string from Serial:");
e.printStackTrace();
}
}
class Circle {
// The Constructor is defined with arguments.
Circle(int x1, int y1, int x2, int y2, int x3, int y3) {
xpos1 = x1;
ypos1 = y1;
xpos2 = x2;
ypos2 = y2;
xpos3 = x3;
ypos3 = y3;
}
void display() {
stroke(0);
strokeWeight (3);
noFill();
//ellipse(xpos1, ypos1, radius1, radius1);
strokeWeight (3);
noFill();
ellipse(xpos2, ypos2, radius2, radius2);
strokeWeight (3);
noFill();
ellipse(xpos3, ypos3, radius3, radius3);
}
void grow() {
growMap1 = map(tOne, 100, 8000, 1, 4);
growMap2 = map(tTwo, 100, 8000, 1, 4);
growMap3 = map(tThree, 100, 8000, 1, 4);
//if (bOne == 1) {
// radius1 = radius1 + growMap1;
//}
if (bTwo ==1) {
radius2 = radius2 + growMap2;
}
else if (bThree == 1) {
radius3 = radius3 + growMap3;
}
}
}
Processing Code Three Tap:
import gifAnimation.*;
import processing.serial.*;
float x, y;
color col1, col2, col3;
color[] colorVal = new color[10];
String[] values;
GifMaker gifExport;
int frames = 0;
int bOne; //button one
int bTwo; //button two
int bThree; //button three
int tOne; //time one
int tTwo; //time two
int tThree; //time three
float colMap1, colMap2, colMap3;
float growMap1, growMap2, growMap3;
int endState = 0;
int lastEndState;
int xpos1, ypos1, xpos2, ypos2, xpos3, ypos3;
float radius1 = 100;
float radius2 = 100;
float radius3 = 100;
int pos1x = 200;
int pos1y = 550;
int pos2x = 400;
int pos2y = 250;
int pos3x = 600;
int pos3y = 550;
Circle myCircle;
int num = 0;
void setup() {
size(800, 800);
frameRate(12);
noFill();
ellipseMode(CENTER);
//colorMode(RGB, 255);
//update the serial port index based on your setup
Serial arduino = new Serial(this, Serial.list()[3], 115200);
arduino.bufferUntil('\n');
ellipseMode(RADIUS);
myCircle = new Circle(pos1x, pos1y, pos2x, pos2y, pos3x, pos3y);
gifExport = new GifMaker(this, "export.gif");
gifExport.setRepeat(0); // make it an "endless" animation
//gifExport.setTransparent(0, 0, 0); // make black the transparent color. every black pixel in the animation will be transparent
}
void draw() {
background(240, 240, 240);
noFill();
tapEvent();
fill(col1);
noStroke();
ellipse(pos1x, pos1y, 100, 100);
fill(col2);
noStroke();
ellipse(pos2x, pos2y, 100, 100);
fill(col3);
noStroke();
ellipse(pos3x, pos3y, 100, 100);
//println(gifExport);
gifExport.setDelay(1);
gifExport.addFrame();
saveGif();
}
void tapEvent() {
colMap1 = map(tOne, 100, 2000, 255, 150);
colMap2 = map(tTwo, 100, 2000, 255, 150);
colMap3 = map(tThree, 100, 2000, 255, 150);
if (bThree == 1) {
col3 = color(colMap1, colMap2, colMap3);
myCircle.display();
myCircle.grow();
} else if (bThree == 0) {
col3 = color(240, 240, 240);
}
if (bTwo == 1) {
col2 = color(colMap1, colMap2, colMap3);
myCircle.display();
myCircle.grow();
} else if (bTwo == 0) {
col2 = color(240, 240, 240);
}
if (bOne == 1) {
col1 = color(colMap1, colMap2, colMap3);
myCircle.display();
myCircle.grow();
} else if (bOne == 0) {
col1 = color(240, 240, 240);
}
}
void saveGif() {
if (endState != lastEndState) {
// if the state has changed, increment the counter
if (endState == 1) {
boolean finished = gifExport.finish(); //exports gif
num++;
println(finished);
if (finished == true) {
gifExport = new GifMaker(this, "export" +str(num)+ ".gif");
gifExport.setRepeat(0); // make it an "endless" animation
}
endState = 0;
}
// Delay a little bit to avoid bouncing
delay(50);
}
// save the current state as the last state, for next time through the loop
lastEndState = endState;
}
void serialEvent(Serial p) { // code from Rebecca Fienbrink
String rawString = p.readString(); //read the string from serial
rawString = rawString.trim(); //trim any unwanted empty spaces
try { //split the string into an array of 2 value (e.g. "0,127" will become ["0","127"]
values = rawString.split(",");
//for(int i =0; i 1) {
bOne = int(values[0]); //convert strings to int
bTwo = int(values[1]); //convert strings to int
bThree = int(values[2]); //convert strings to int
tOne = int(values[3]);
tTwo = int(values[4]);
tThree = int(values[5]);
//println(values[0] + "," + values[1] + ","+ values[2] );
//println(values[3] + "," + values[4] + ","+ values[5] );
} else if (values.length == 1) {
endState = 1;
//println(end);
} else {
endState = 0;
}
}
catch(Exception e) {
println("Error parsing string from Serial:");
e.printStackTrace();
}
}
class Circle {
// The Constructor is defined with arguments.
Circle(int x1, int y1, int x2, int y2, int x3, int y3) {
xpos1 = x1;
ypos1 = y1;
xpos2 = x2;
ypos2 = y2;
xpos3 = x3;
ypos3 = y3;
}
void display() {
stroke(0);
strokeWeight (3);
noFill();
ellipse(xpos1, ypos1, radius1, radius1);
strokeWeight (3);
noFill();
ellipse(xpos2, ypos2, radius2, radius2);
strokeWeight (3);
noFill();
ellipse(xpos3, ypos3, radius3, radius3);
}
void grow() {
growMap1 = map(tOne, 100, 8000, 1, 4);
growMap2 = map(tTwo, 100, 8000, 1, 4);
growMap3 = map(tThree, 100, 8000, 1, 4);
if (bOne == 1) {
radius1 = radius1 + growMap1;
} else if (bTwo ==1) {
radius2 = radius2 + growMap2;
} else if (bThree == 1) {
radius3 = radius3 + growMap3;
}
}
}
Future Considerations:
I want to continue to work on this project. Considerations for the patch include fabric type and design of the tappable areas. For the Processing end of things, I’d like to explore what else is possible with the data being sent and well as build a state machine and initialization sequence so that the system knows how many tappable areas are present when plugged in so that two Processing sketches are not needed. On the Arduino side of things, I would like use timing to save the GIF animations rather than a button press.
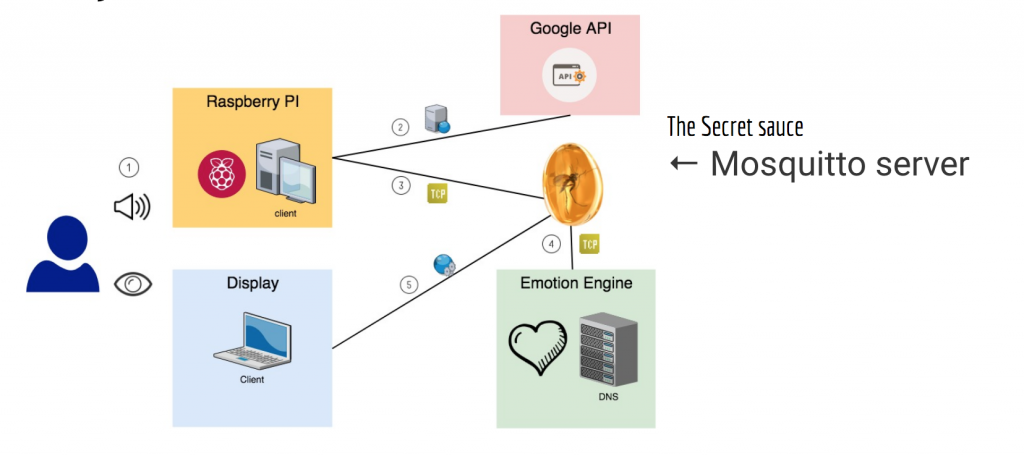
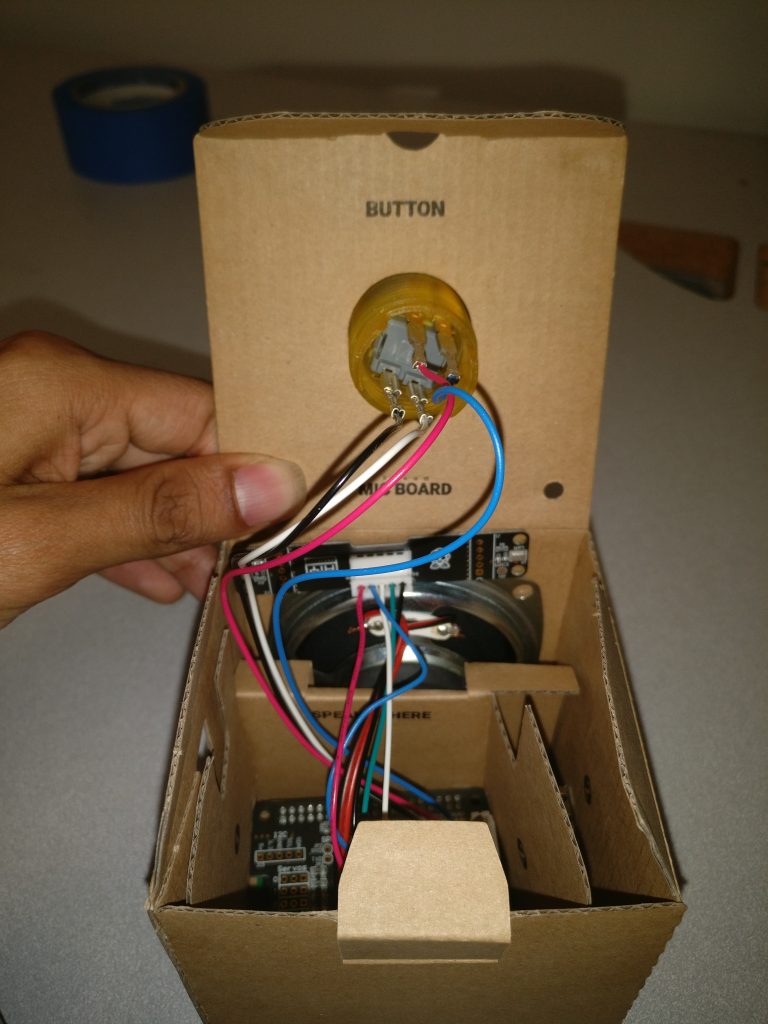 AIY Voice kit and a mobile browser