video➦xy oscilloscope (audio)

I really like the xy oscilloscope.
It’s a visualization of stereo audio where the left ear’s audio is plotted on the x-axis, and the right ear’s audio is plotted on the y-axis.

I enjoy this visualization quite a lot.

These are a couple experiments that exemplify why I like the visualization. The translation is raw enough to see how individual effects applied to the audio literally change its shape. An audio signal is just a series of values oscillating between 0 and 1, so if you have two audio signals, you have enough information to represent those signals with a 2D graph, and see the interesting shapes/forms those signals represent together. If you’re deliberate with your audio,  you can even draw pictures:

But I couldn’t be bothered to be deliberate with my audio, so I figured I’d just run an edge detection algorithm on a video feed, turn the detected edges into a series of points, remap those points to a [-1,1] range, and output them as audio. This would let me take video, transform it to 2 channel audio, then graph that 2 channel audio to (somewhat) reconstruct the original video feed.

Initially, I used webcam input for the camera feed, but found that the edge detection required specific lighting to be consistent. Eventually I found a way to instead use video captured from my screen by having obs capture the top-right 600×600 pixels, where I have a window for a screen magnification tool called xzoom, so that I can zoom in on any region of the screen and have it sent as video data to be processed. Here was my final setup

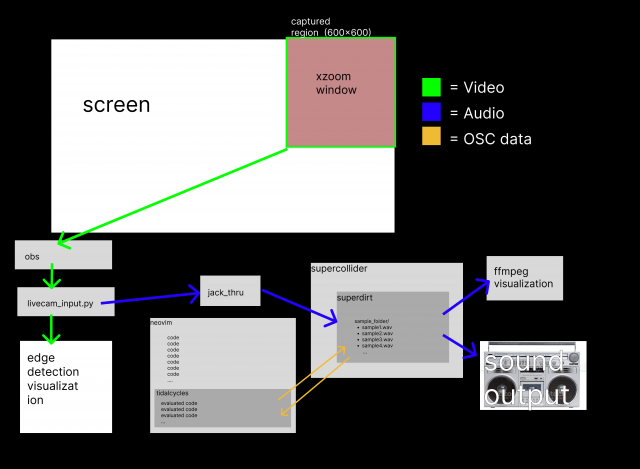
and here’s an xy plot of some audio I recorded with it:
(VOLUME WARNING, THE SOUND IS QUITE HARSH)

Here, I move the zoom around my desktop background and some text in my terminal. You can see a crudely drawn cherry and dollar sign at 1:00, some stars at 1:25, and “excap3” at around 2:15. I’m very happy with how the visuals turned out, and only partially content with the audio. My process for capturing and transforming the video feed was by no means optimal, but I found most of the visual artifacts to be more interesting than obstructive. Why I’m only so-so on the audio requires getting a little technical.

Actually transforming a series of points of detected edges into audio means deciding the order in which you put those points into the audio buffers. Suppose a single frame of edge-detected video gives you like 5000 contour points. Those points represent the video data at one point in time. But in a raw signal, you can’t have 5000 values simultaneously, you can only have one value per channel of audio. You can represent 5000 values in the span of 5000 audio samples, but you have to decide which values to represent first. That decision will define what type of sound you get.

Case in point: the left-channel audio contains much more information than the right-channel audio, because the points are put into the buffer in order of their y-values. This is a consequence of using ‘numpy.nonzero’ to get points from the edge-detected frame of video. The function returns what indices in the frame have non-zero values, ordered top-left to bottom-right by row. The more points detected, the longer it will take to shove all those points through the audio buffer, and the longer it will take to get to the points at the bottom of the image, hence the longer it will take for the values in the right-channel to change. It’s a fairly interesting problem that, if addressed in some future iteration of the project, I think would make the audio much more interesting. However, my issue is mostly with how poorly the sound is distributed. The like the left channel’s sound enough that I’m still fairly happy with my results.

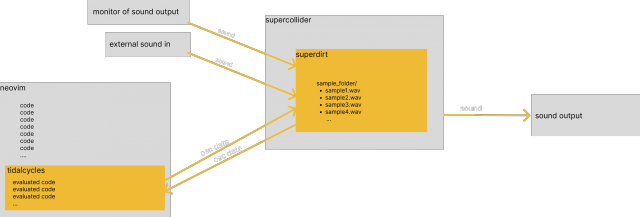
Here’s a short video I did exploring the tool where you can see my entire screen. I’m running the video-generated signal through my Tidalcycles/SuperDirt setup so I can apply effects (no sound warning, the audio is much quieter here).

The code is in an ungodly state, but here are the scripts I ended up using (godspeed if you try to get it working). I hope to optimize/generalize this system somehow in the future, because I’ve found this video->audio pipeline fairly interesting to explore. What do video processing effects sound like? What do audio processing effects look like? Can you turn a pure shape into a pure tone? It ties image and sound together so tightly that it creates its own little subject of study, which is the type of system I love = ]

excap2 postcrit

(note: I turned in a rushed version of this project with garbage documentation and someone in crit felt they needed to absolutely obliterate me, so I spent the next two days putting together something I feel dignified presenting. That’s why the recording was posted two days after the project deadline).

I make music through live coding. Explaining what that entails usually takes a while, so I’ll keep it brief. I evaluate lines of code that represent patterns of values. Those patterns denote when to play audio samples on my hard drive, and with what effects. I can also make patterns that tell the system when to play audio from a specified input (for example, when to play the feed coming from my laptop mic). Bottom line, everything you hear is a consequence of either me speaking to a mic, or me typing keys bound to shortcuts that send lines of code to be evaluated, modifying the sound. I have many many shortcut keys to send specific things, but it all amounts to sending text to an interpreter.

Here’s a rough diagram of my digital setup

neovim – text editor
tidalcycles – live coding language/environment
supercollider – audio programming language/environment
osc – open sound control

If you’re interested in the details, feel free to reach out to @c_robo_ on instagram or twitter (if it’s still up by the time you read this).

Anyway, this setup is partially inspired by two big issues I see with contemporary electronic music.

The first is the barrier to performance. Most analog tools meant for electronic music are well engineered and fully intended for live use, but by their nature have a giant cost barrier associated with them. Anyone can pirate a digital audio workstation, but most digital music tools are made prioritizing composition. If they’re made also for performance like ableton live, they usually have some special view suggesting the use of a hardware interface to control parameters more dynamically, which to me is just another cost barrier implicitly refuting the computer keyboard as a sufficiently expressive interface for making music. This seems goofy to me, given how we’ve reduced every job related to interfacing with complex systems to interfacing with a computer keyboard. It’s come out as the best way to manage information, but somehow it’s not expressive enough for music performance?

The other problem is that electronic music performance simply isn’t that interesting to watch. Traditionally, it’s someone standing in front of a ton of stationary equipment occasionally touching things. In other words, there are no gestures clearly communicating interaction between performer and instrument. Live visuals have done quite a bit to address this issue and provide the audience something more visually relevant to the audio. Amazing stuff has been done with this approach and I don’t mean to diminish its positive impact on live electronic music, but it’s a solution that ignores gesture as a fundamental feature of performance.

400 words in, and we’re at the prompt: electronic music performance has trouble communicating the people in time actually making music. What the hell do they see? What are their hands doing? When are they changing the sound and when are they stepping back? To me, live coding is an interesting solution to both problems in that there are no hardware cost barriers and “display of manual dexterity” (ie. gesture) is literally part of its manifesto. I don’t abide by the manifesto as a whole, but it’s one of a few components I find most interesting given my perspective.

This is an unedited screen recording of a livecoding performance I did, with a visualization of my keyboard overlayed on top (the rectangles popping up around the screen are keys I’m pressing). I spent the better part of two days wrangling dependency issues to get the input-overlay plugin for obs working on my machine. Such issues dissuaded me from experimenting with this earlier, but I’m incredibly happy that I did because it’s both visually stimulating and communicates most of the ways through which I interact with the system.

The sound itself is mostly an exploration of feedback and routing external sound with tidalcycles. I have sound from the laptop going  through a powered amplifier in my basement picked up again going back into the system through my laptop mic. You can hear me drumming on a desk or clicking my tongue into the mic at a few points (to really make sure a person is expressed in this time, cause I know y’all care about the prompt). I also have some feedback internally routed so I can re-process output from supercollider directly (there’s a screen with my audio routing configuration at 1:22).

Not gonna lie, it’s a little slow for the first minute but it gets more involved.

CONTENT WARNING: FLASHING LIGHTS and PIERCING NOISES
(best experienced with headphones)

typology project where I react to short-form garbage

tldr: I strained myself to enjoy the feed of an Instagram bot, and I did.

I find the ecosystem of low-effort algorithmic Instagram content pretty interesting. It’s a mess of scams and thirst traps and fake engagement and the like, all driven by bots driven by people driven by some profit incentive. It spits out a bizarre blend of bot and human made content that exists quite far outside any social media feed I’ve ever experienced. After seeing some of the strange forms this content can take,

I was inspired to inject myself into this ecosystem and create a bot to aggregate and somehow classify the content. I still think this premise would be fun to fully pursue, but a consistent critique was “you get a bot that creates a river of shit. Are we supposed to find that shit fascinating?” After some contemplation and feedback, it became clear that most people do not find all this inherently interesting, so the question became “how can I communicate that interest”? The answer became “I’ll just tell them what I find interesting.”

Step one was to carve a river of shit. I recovered an Instagram account I’d made in middle-school (old accounts are less likely to get banned) and acted like a bot. I went on popular hashtags inundated with bot posts and comments advertising promo-services, promoting scams, or trying to gain followers quickly through mutual-follow tags. The vast majority of accounts that follow bots are bots themselves, so I sought to recreate the kind of feed they would see. Doing so wasn’t too difficult.

Step two was to record myself reacting to that river. Initially I interacted with the feed without restrictions on myself, sometimes exploring comments and profiles associated with posts, but following more feedback, I tightened it down to a series of around 60 10-second recordings.

I still feel the set of recordings I made without restrictions paint a much more interesting picture of the ecosystem I wanted to explore. However the shorter recordings are more digestible and a tad more engaging, so it’s the deliverable for this project.

typology of bots on the gram

I found a bot account on Instagram: https://www.instagram.com/support.arts.gallery_/. All its content is ripped from other accounts, finding them through tags like #art and #artist. The bot picks 4 to 5 images and reposts them in a gallery, the cover of which is a screenshot of their profile put on a white t shirt:

It reminded me of a post I stumbled upon (that I can no longer find) from a large bot account promoting a crypto scam, where all the comments were different bots promoting different crypto scams. It made me think about how many bots interact primarily with other bots, and the strange ecosystem that creates. An initial idea was to survey the different behaviors and kinds of bots myself (ie. crypto scam bots, nft scam bots, sexting bots, etc). Then I realized it was silly to do this manually: I could make a bot myself.

I plan on using GramAddict (the most current FOSS response to numerous Instagram automation services) to program a bot expressly to engage with other bots, finding them through hashtags (#art, #crypto, #nft, #promotion, #follow4follow, #f4f, etc…) and the comment sections of larger bots (like@support.arts.gallery_). The goal is to build up an account whose likes, follows, private messages, and all other recorded interactions represent the diversity and ubiquity of bots on platforms like Instagram.

Over the past few years, bot detection efforts have largely pushed basic python script bots out of relevancy, leaving paid services left as the only consistent way to artificially promote posts or accounts. There’s a nonzero chance that GramAddict will quickly become deprecated, and the only paid services available won’t provide me the tools I need to assess other bots. In this case, I still feel seeking out and engaging with bots manually would generate interesting results. A couple times a week, a bot will follow or comment on my Instagram, or add me to a giant group chat on Twitter. I’d expect this rate would dramatically increase if I find and follow 200 different NFT scams and comment on every automated thirst trap that graces my direct message box.

Either way, I’m jazzed to explore new, exciting, and less entertaining forms of scam-bating.

Reading-1

The idea that at some point photography’s place in society was still up in the air is kind of funny to me. In 2022, photographs emerge as a byproduct of living. Digital cameras are ubiquitous to the point where we often take photographs and record videos on an impulse because we simply can. So to read a section where photography is discussed as a diverse set of physical and chemical processes for scientific application speaks to an understanding of the practice that just feels alien to me. It’s one where the technology is diverse but the medium’s language isn’t, and the agency of the photographer is closer to the agency of an MRI technician.

In some sense, I found all of the techniques mentioned in the reading interesting because the applications of scientific imaging approaches seem novel to me, and I’d probably enjoy exploring ways to process/warp the physical materials involved. But in another sense, none of them interest me, because I’m not too interested in physical media that’s not easily accessible.

c_robo_ Looking Outward

I work on livecoded music pretty much everyday. Given its academic origins, I figured I’d check out its new literature to find something for this post. I stumbled upon an inspiring paper from Francesco Ardan Dal Rì and Raul Masu that designed two different systems for visualizing tidalcycles patterns and audio characteristics in real time. Livecoding visualizers aren’t new. What’s new (to me at least) is how they introduce the visualizer as a “score” and investigate its potential value to the performer.

One visualizer is focused on composition structure, and the other on sound characteristics. Both have I’ve been interested in making myself such a system for some time because in addition to helping the performer conceptualize what they’re doing, it serves as something more engaging for an audience to stare at than someone standing at a laptop for half an hour.

I find this latter function interesting, because few electronic instruments require the same kind of tactile and gestural engagement as traditional instruments, making for a fundamentally different (and generally duller) physical presence on stage. Audio reactive live visuals solve the “something to look at” problem, but they rarely solve the “I get to see what they’re doing” problem. I’d consider this paper’s efforts much closer to an actual solution, as the visuals are tied directly to pattern events in a comprehensible way. That they don’t touch on audience interpretation of the visualizers feels like a bit of a missed opportunity, but that investigation would probably have diluted the focus: it deserves its own paper.

visualization “Time_X” – this visualization focuses on pattern events over time


visualization Time_Z – this visualization focuses on parameters of pattern events

As far as critiques go, none of the content jumps out as lacking. They give a thorough review of existing tools/literature, and provide solid evidence and arguments for the value of their visualization tool. My biggest critique is the lack of documenting media. I could not find the code used, nor could I even find videos of the visualizations in action. At the very end, they do mention “the systems presented in this paper have been developed using FLOSS, and will be release in creative common,” but they didn’t put any link to it in the footnotes, which feels like a massive oversight. A fair amount was written about how the different visualizations influenced composing and what limitations were discovered during use, so it feels strange to me that they wouldn’t want to give the tool life past the paper and let others experiment with and iterate directly on what they’ve successfully argued as something worth exploring.

Many papers are referenced, but two main influences are established: Thor Magnusson’s “Threnoscpe”, an environment + visualizer best for drone music, and Ivan Abreu’s “Didactic pattern visualizer”, which the Time_X visualization seems like a very direct extension of. I’d dig much deeper, but this post is already far past 150 words, so I’d just encourage checking the tools out yourself. They’re both well documented.

References:
https://nime.pubpub.org/pub/ex3udgld/release/1
https://thormagnusson.github.io/threnoscope/
https://github.com/ivan-abreu/didacticpatternvisualizer