For my project I wanted to do an interactive installation
My initial idea was an app on a large monitor
app would take real time footage of passerbys and crop their body part and assemble a single Frankenstein body from them. Ex: left leg from person A, right leg from person B
concept: have fun with friends in front of this exhibit
However, finding a real time frame to frame stable multi person limb segmenter ML model is difficult. There’s no way for me to really train one these models are produced by like teams at google.
So I pivoted to a slightly different concept:
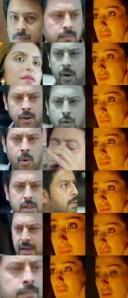
Roachifier!
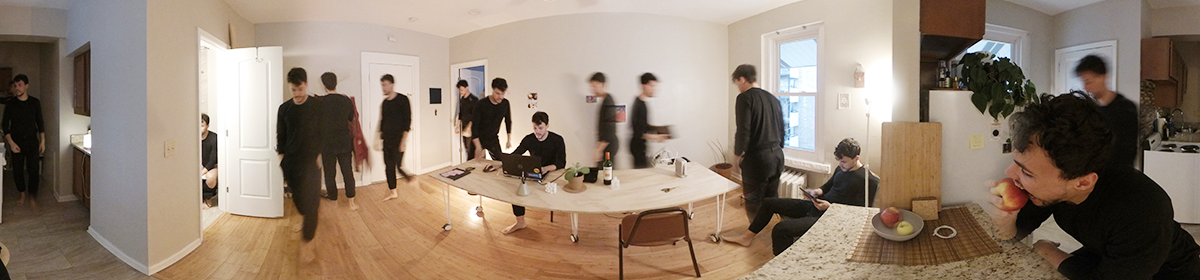
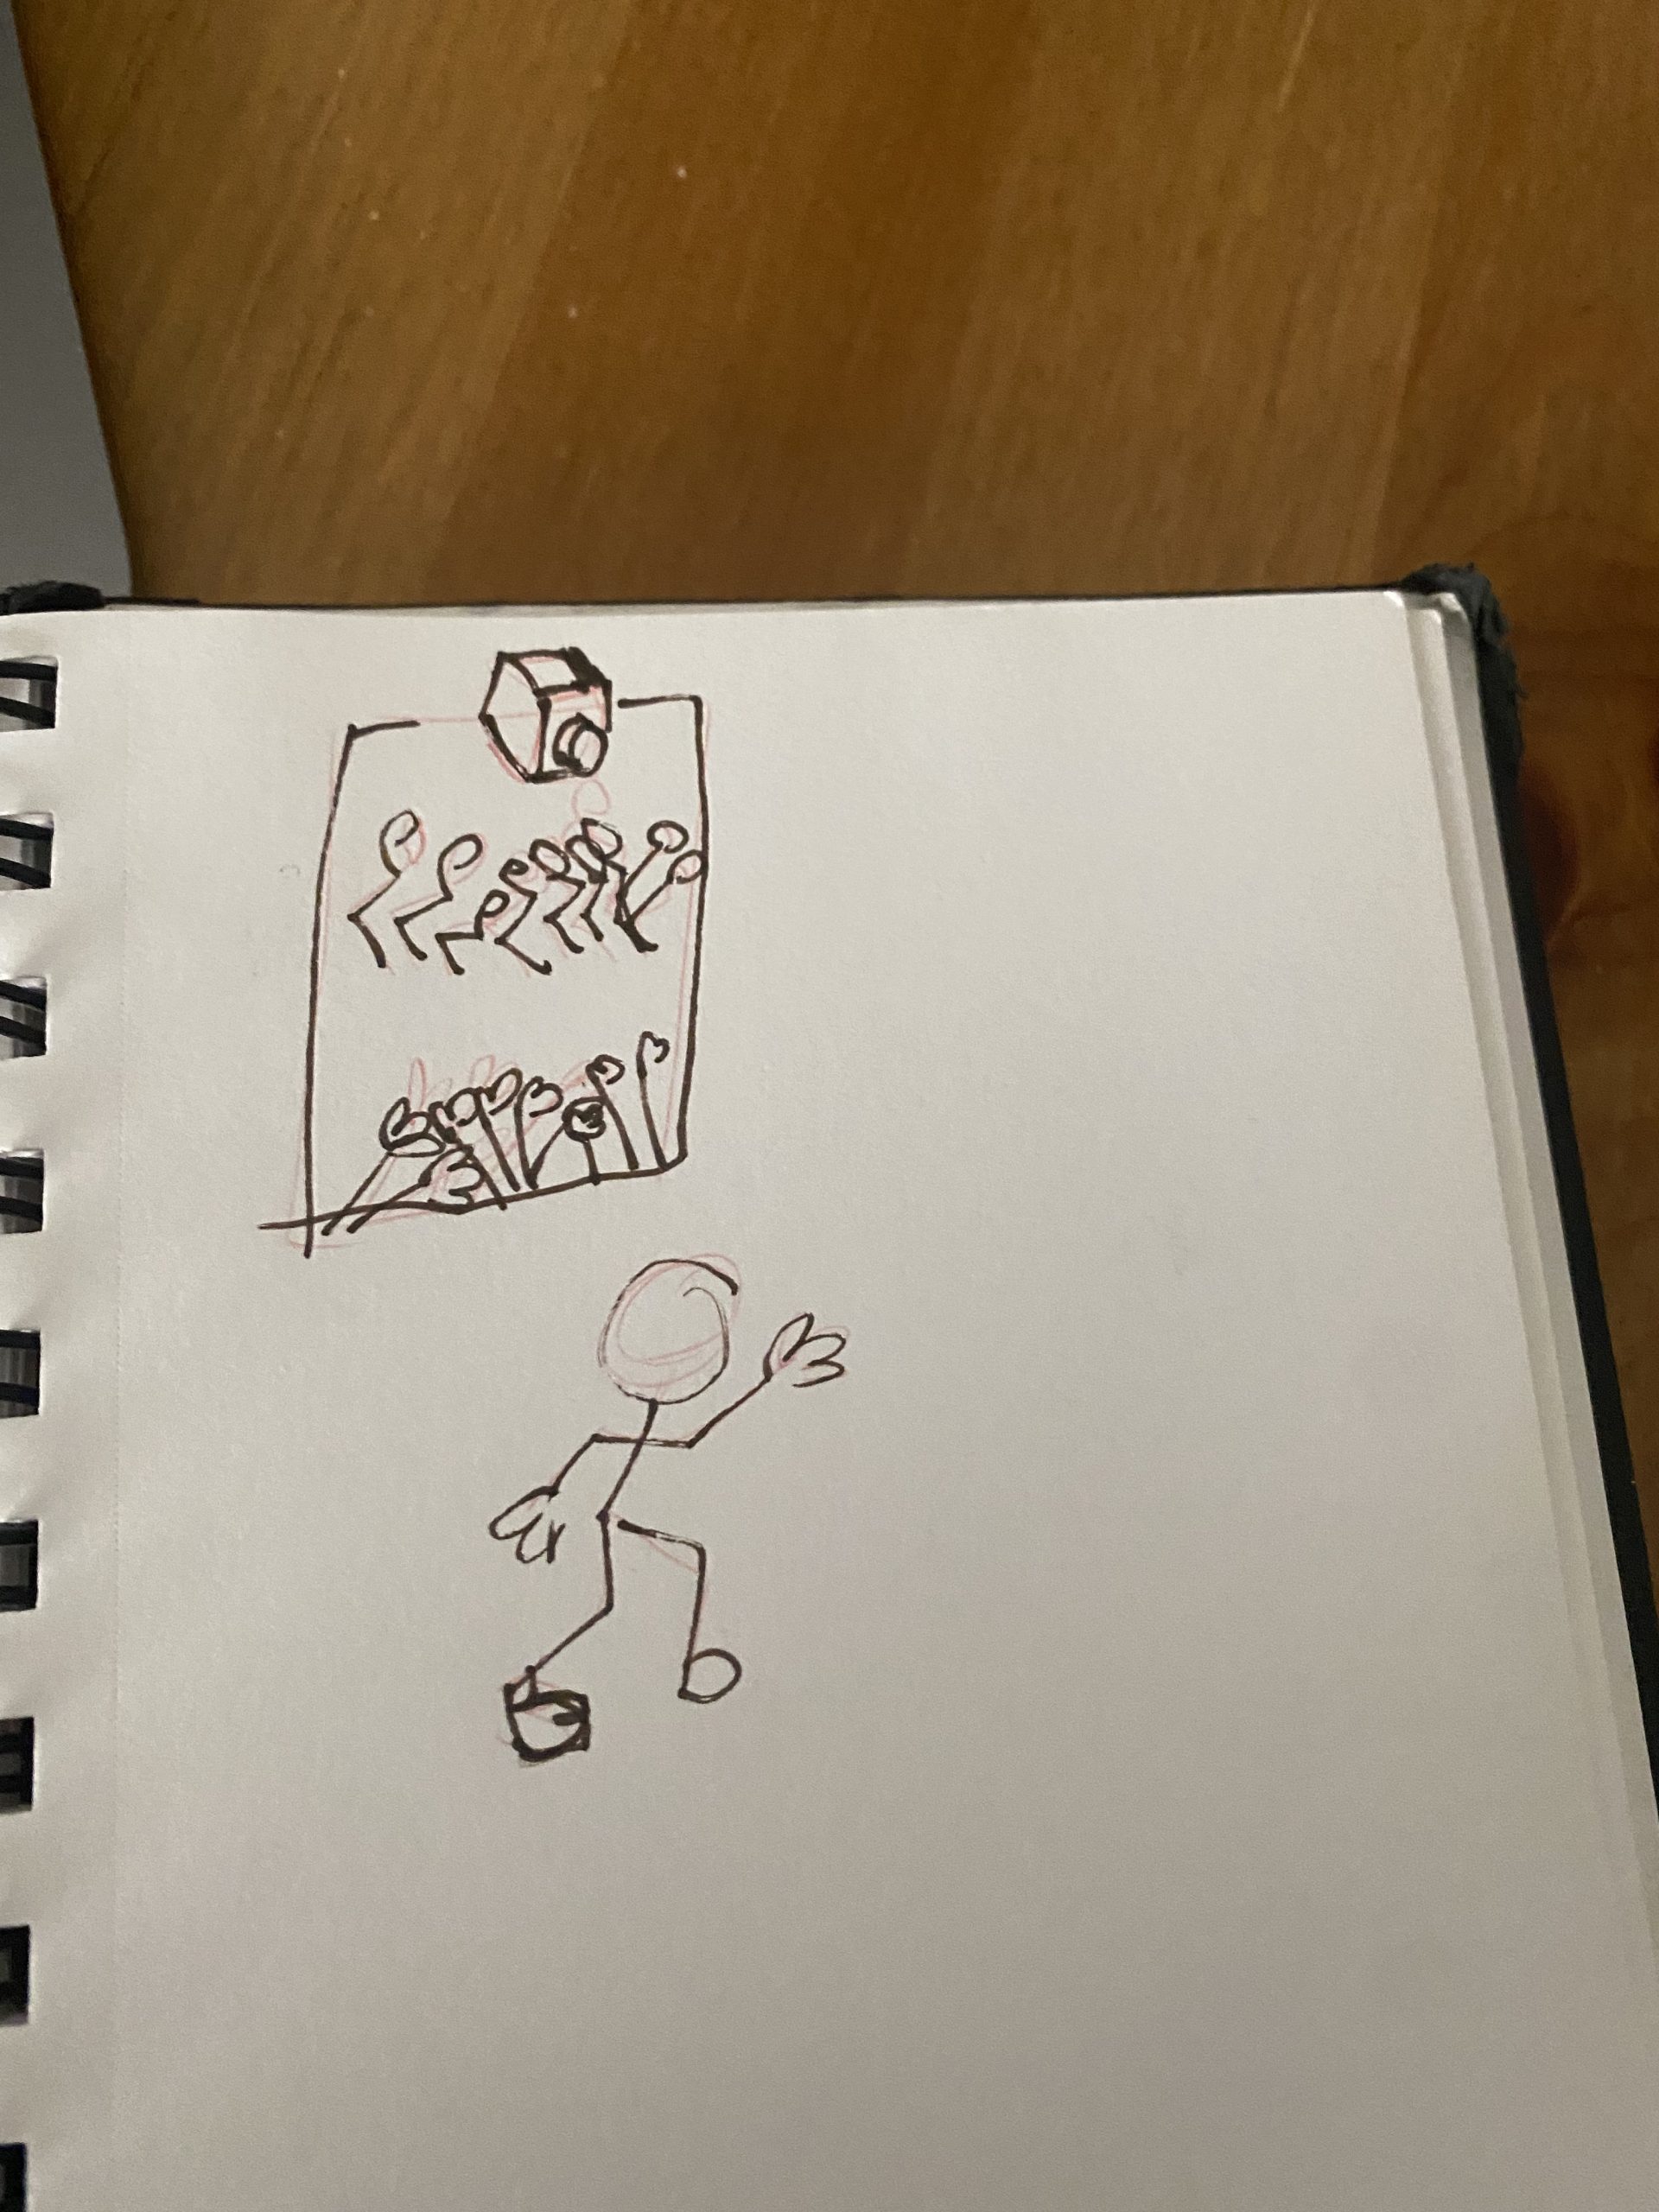
This is a one person interactive exhibit
Here’s me interacting with this, real time:
It roachifies the participant by segmenting out the arms and the legs and then sticking it onto the torso of a roach!
It rotates your limbs so that your thigh and upper arm can’t move, they are permanently affixed at angles becoming of a roach. Kafkaesque?
Why a roach?
This is a one person concept and I was running a little low on time
I wanted to maintain an element of play and bugs are funny.
Also when I was working with the original frankenstein’s monster concept the limbs were affixed at a certain angle in a certain location, very much like a pinned bug.
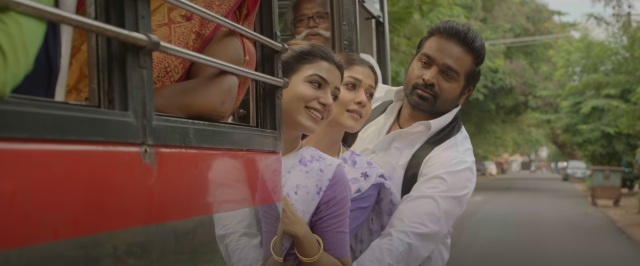
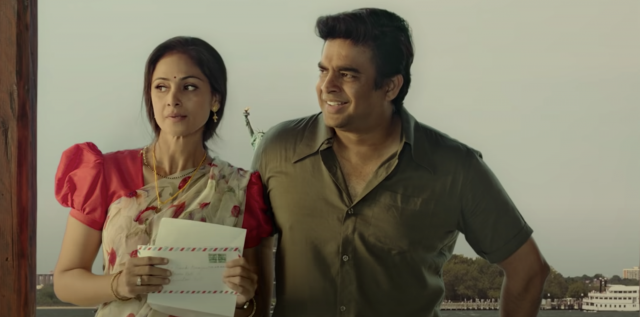
I’m Tamil. India has a huge problem with colorism which disproportionately impacts women. As a result, I’ve seen many ridiculous Tamil movies where the female lead is the same skintone as a Northern European while the male lead looks like someone who is actually from a region with 90 degree weather.
Machine
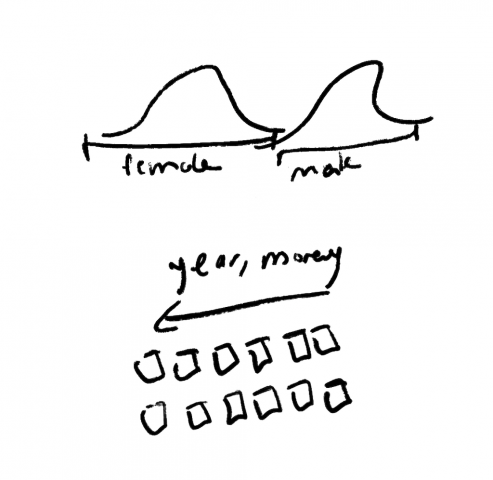
I wanted to craft a machine to show this trend clearly. I wanted a typology of actors and actresses and their skintones. To do that, I first needed to construct a machine to somehow extract skin tone from film.
downsample footage by extracting frames with ffmpeg
for i in *.mp4; do mkdir "${i/%.mp4/}"; ffmpeg -i "$i" -vf "select=not(mod(n\,30))" -vsync vfr -q:v 2 "${i/%.mp4//img_%03d.jpg}"; done
use python to extract faces from each frame
use face-recognition module to crop faces out automatically with a CNN and then extract a 128 dimensional embedding vector
use UMAP to group the faces into people based on their embedding vector
extract skin tone from each face and average across each person grouping
construct a data visualization to go through the people from lightest to darkest average skintone
Result
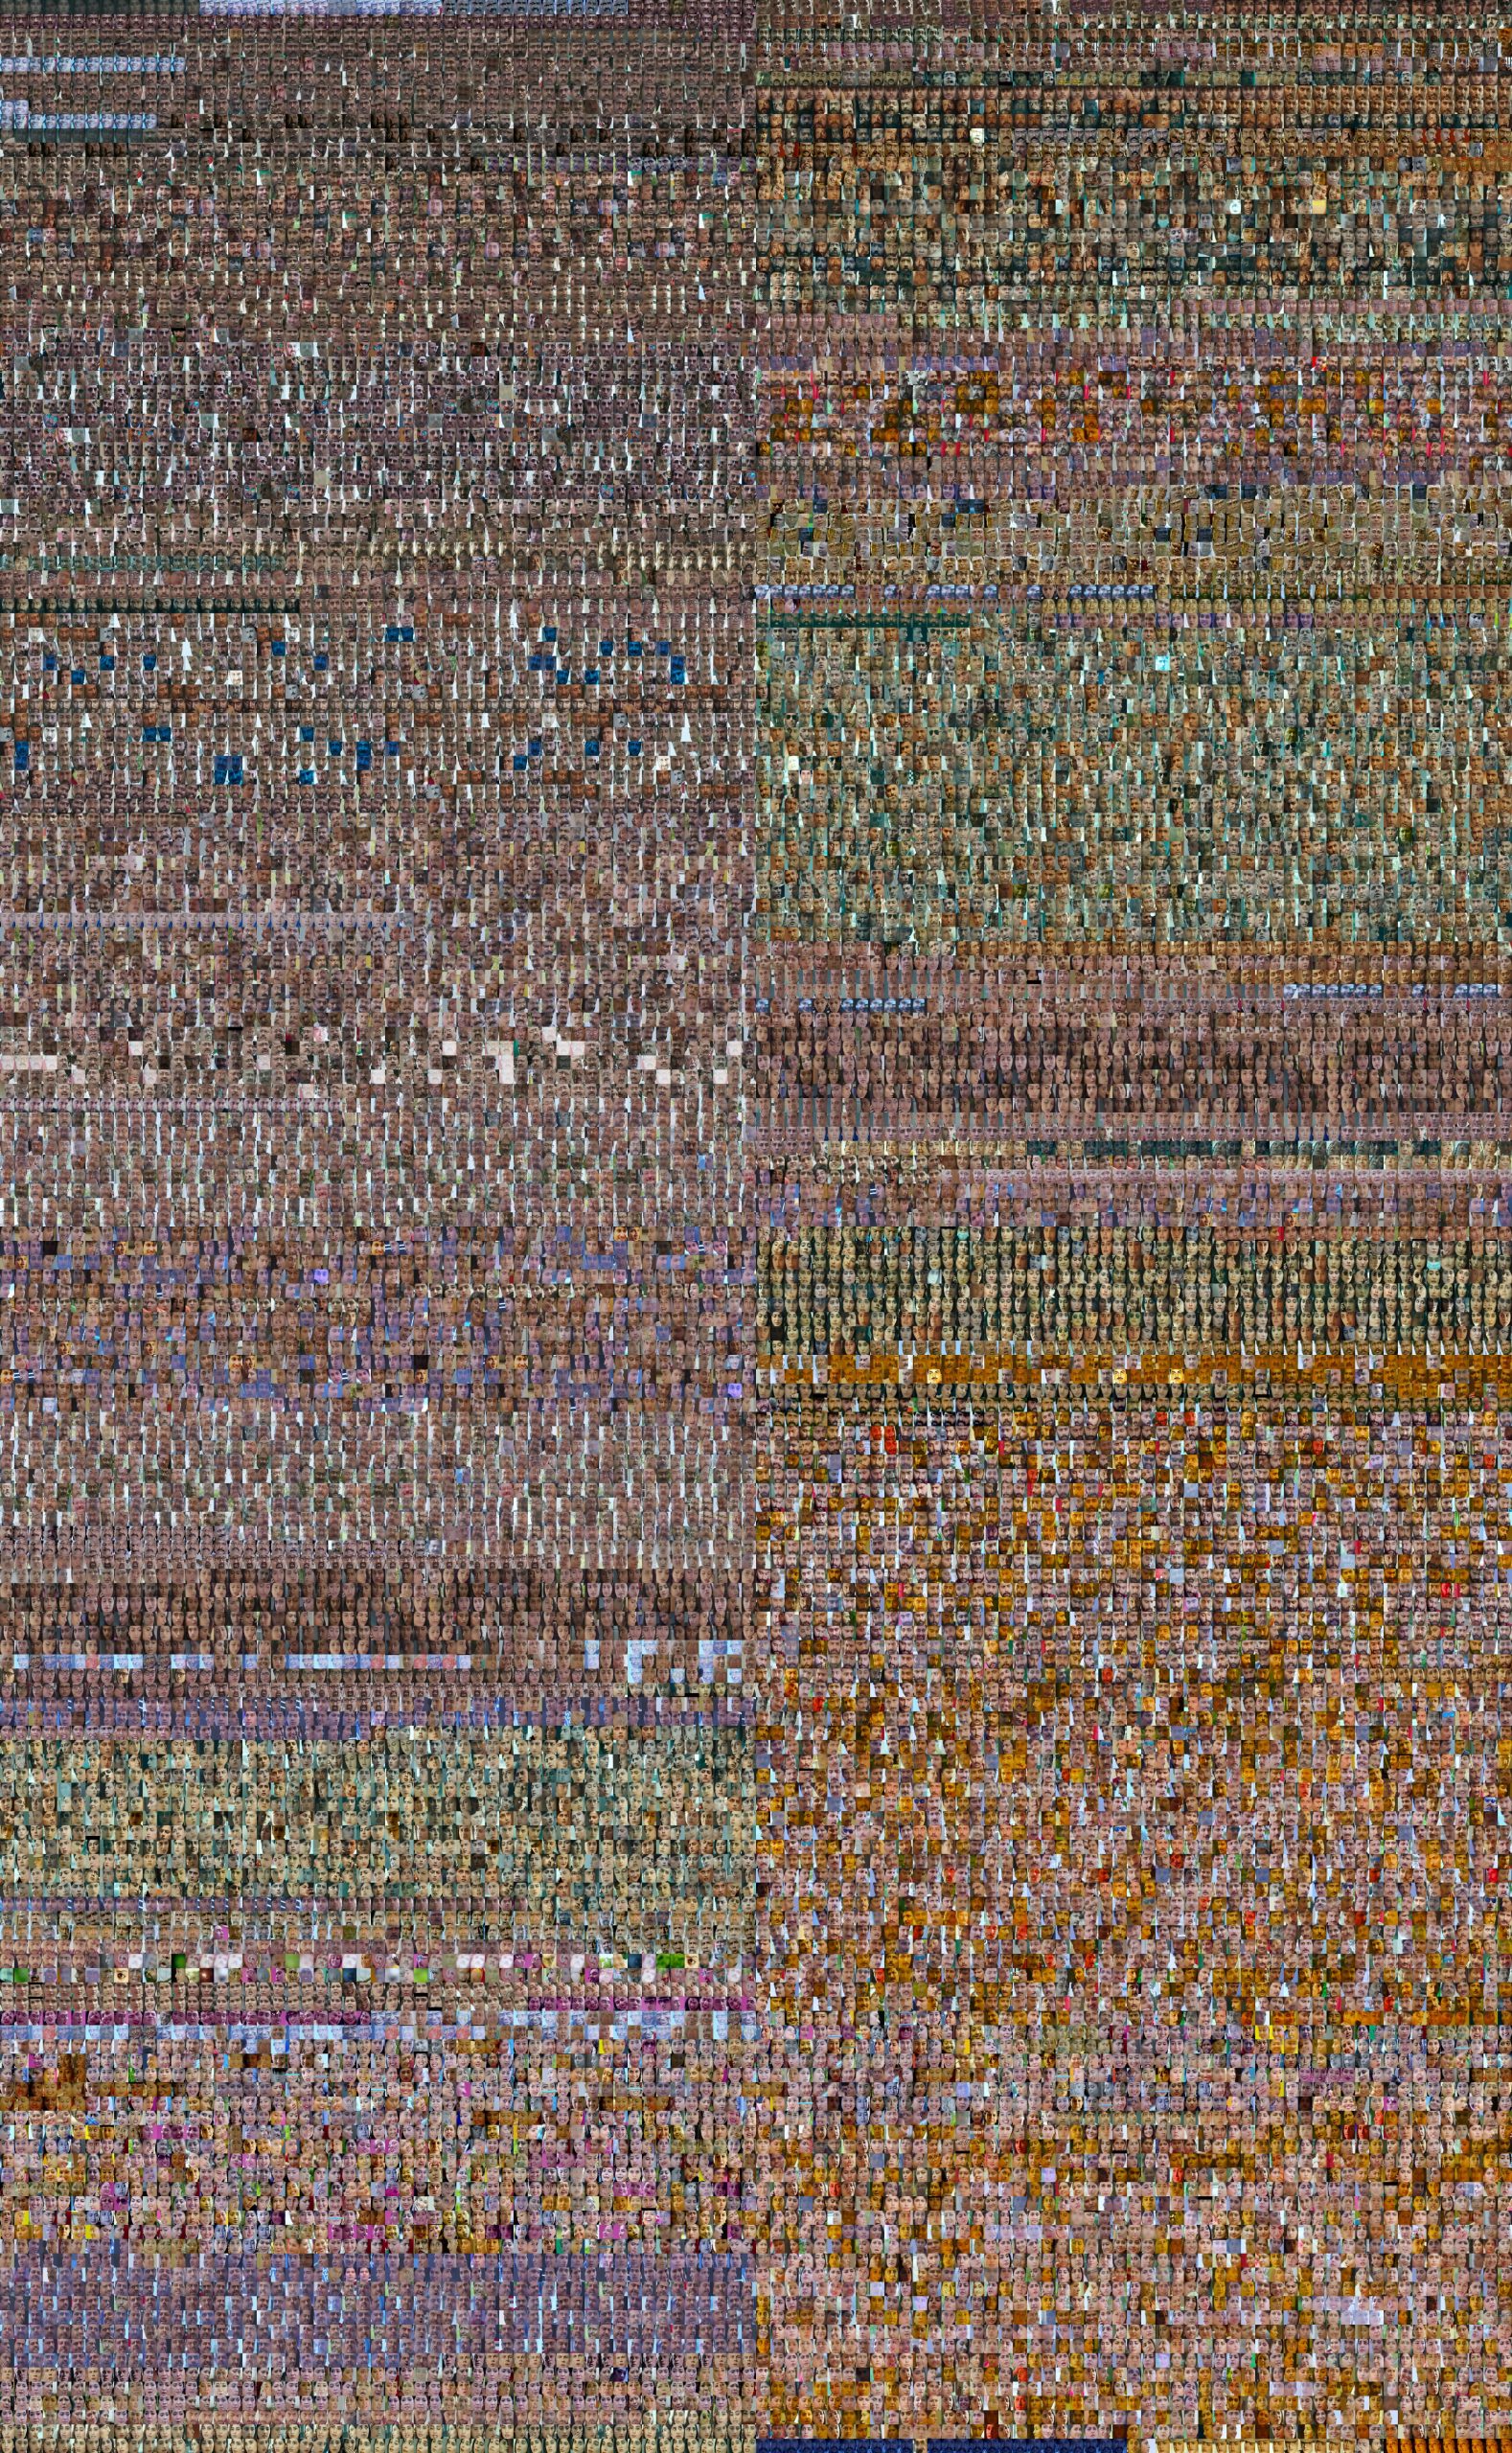
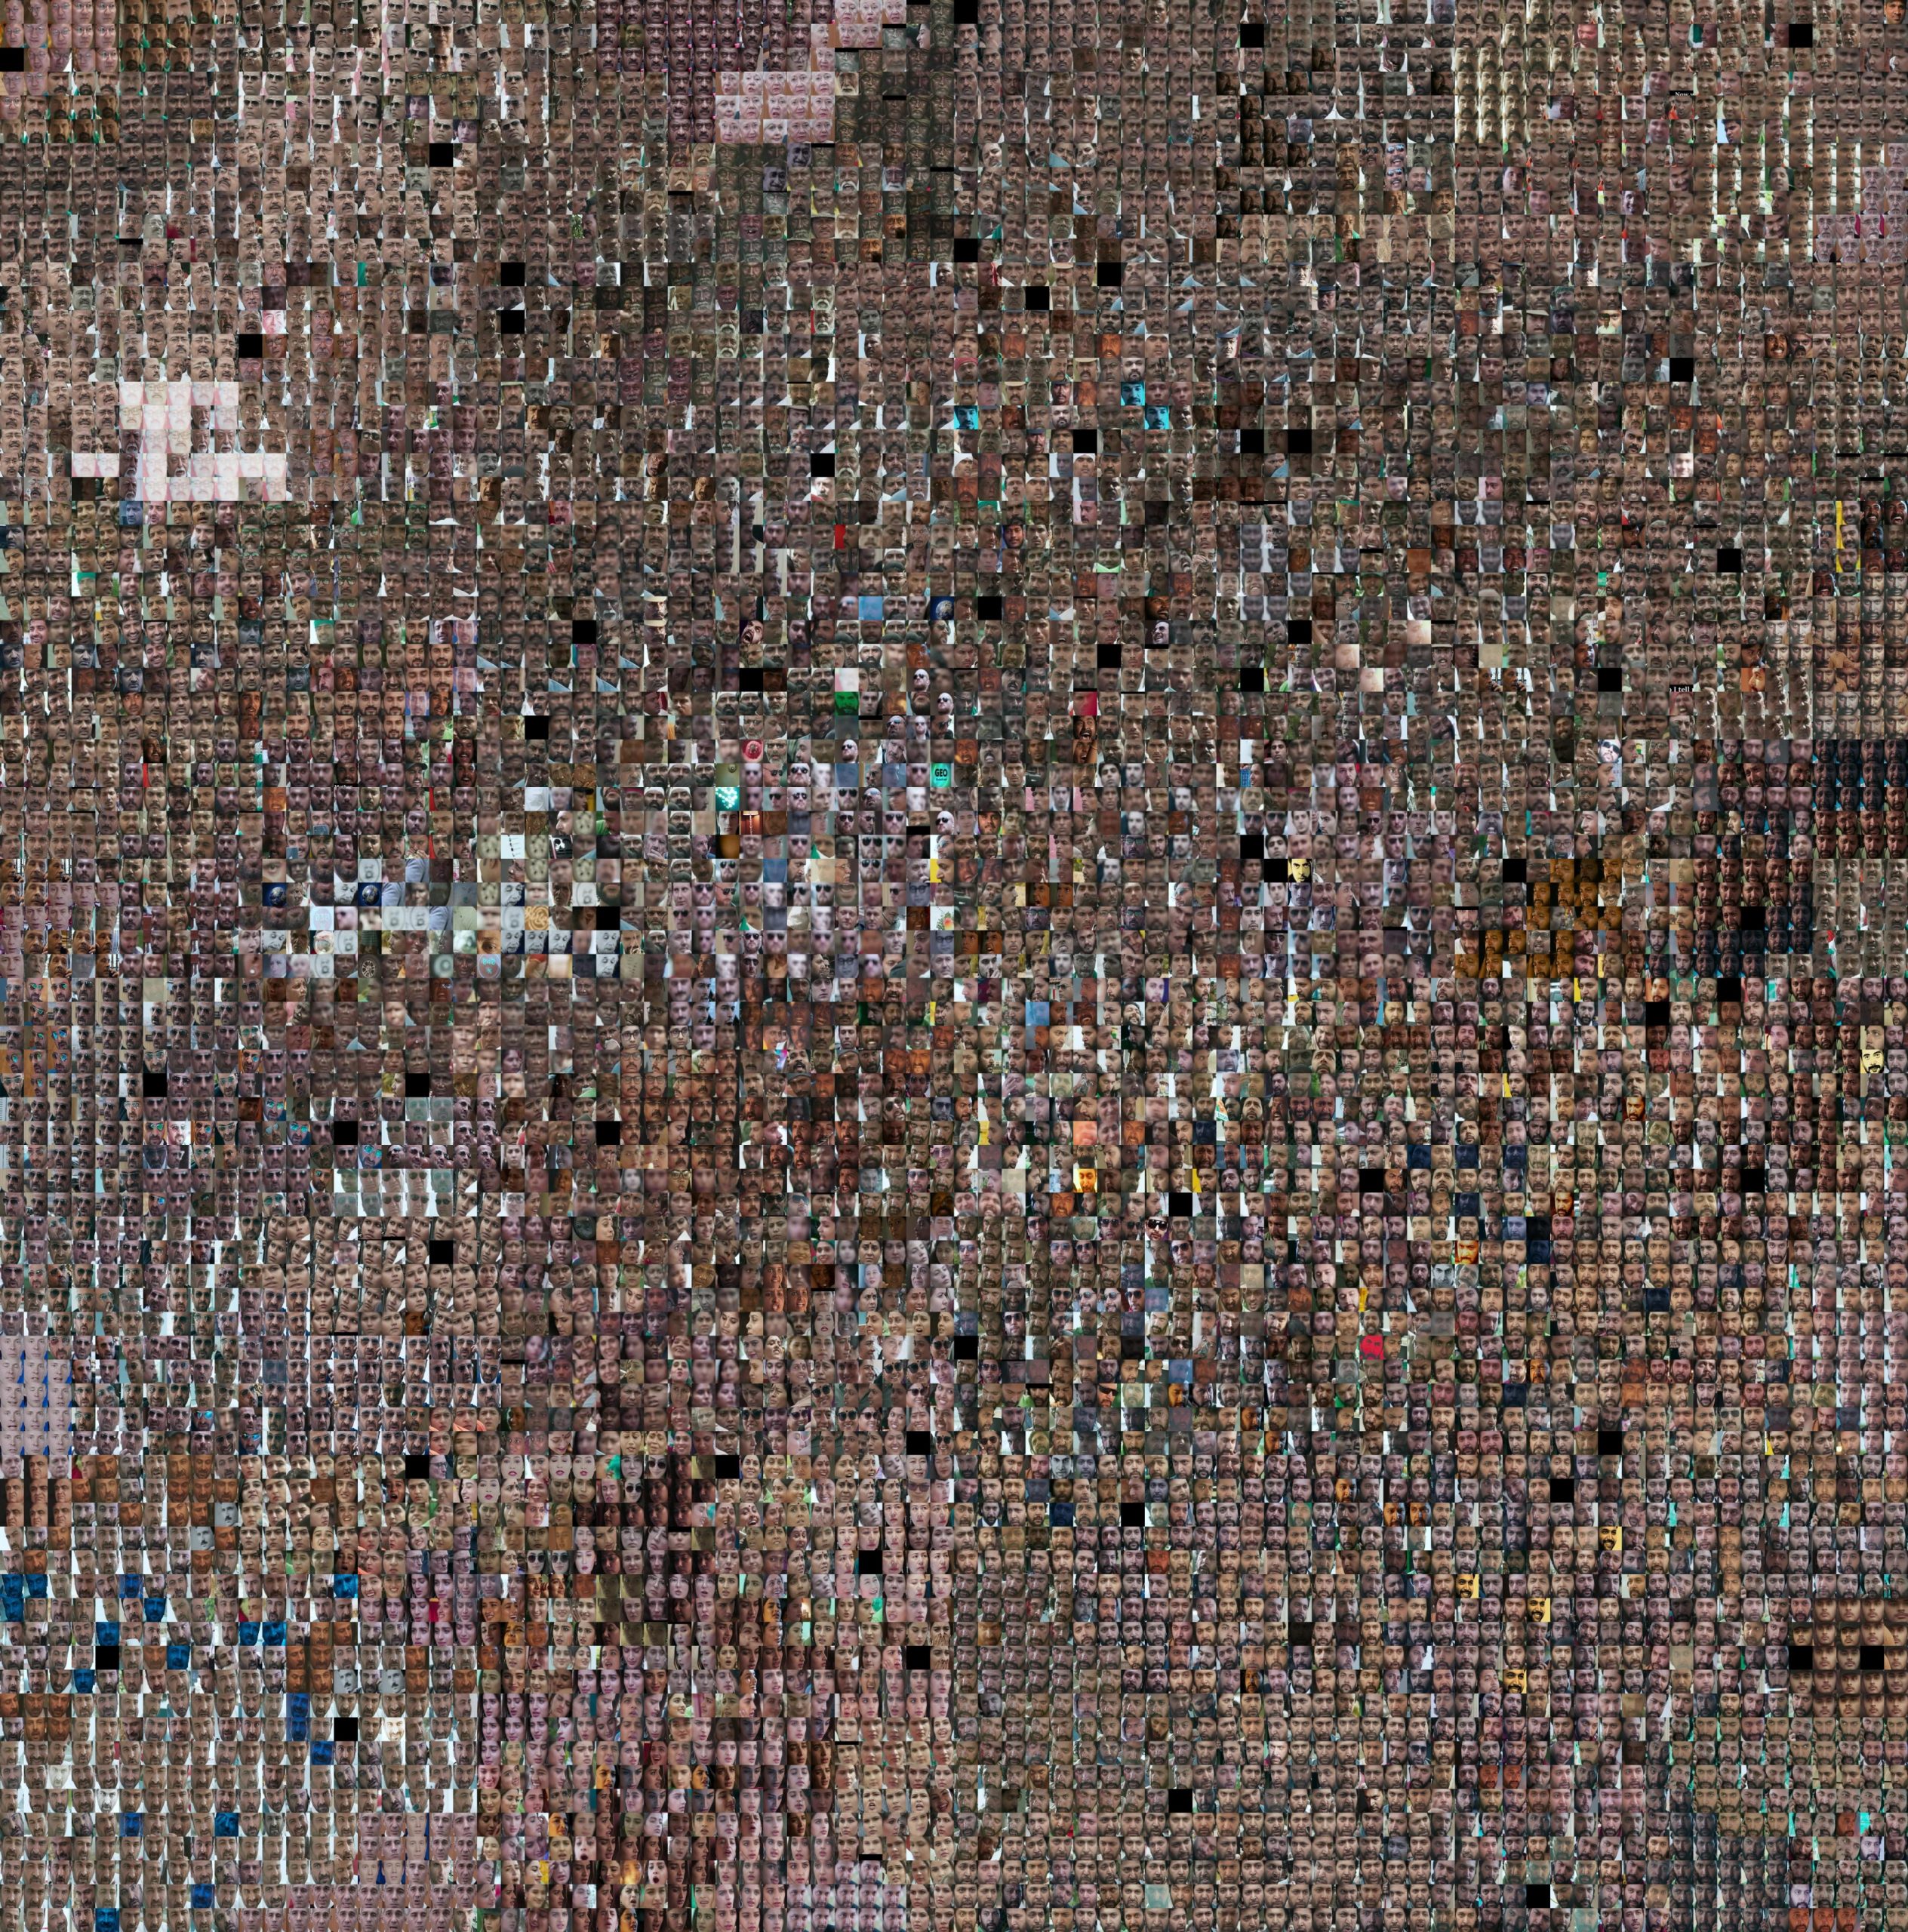
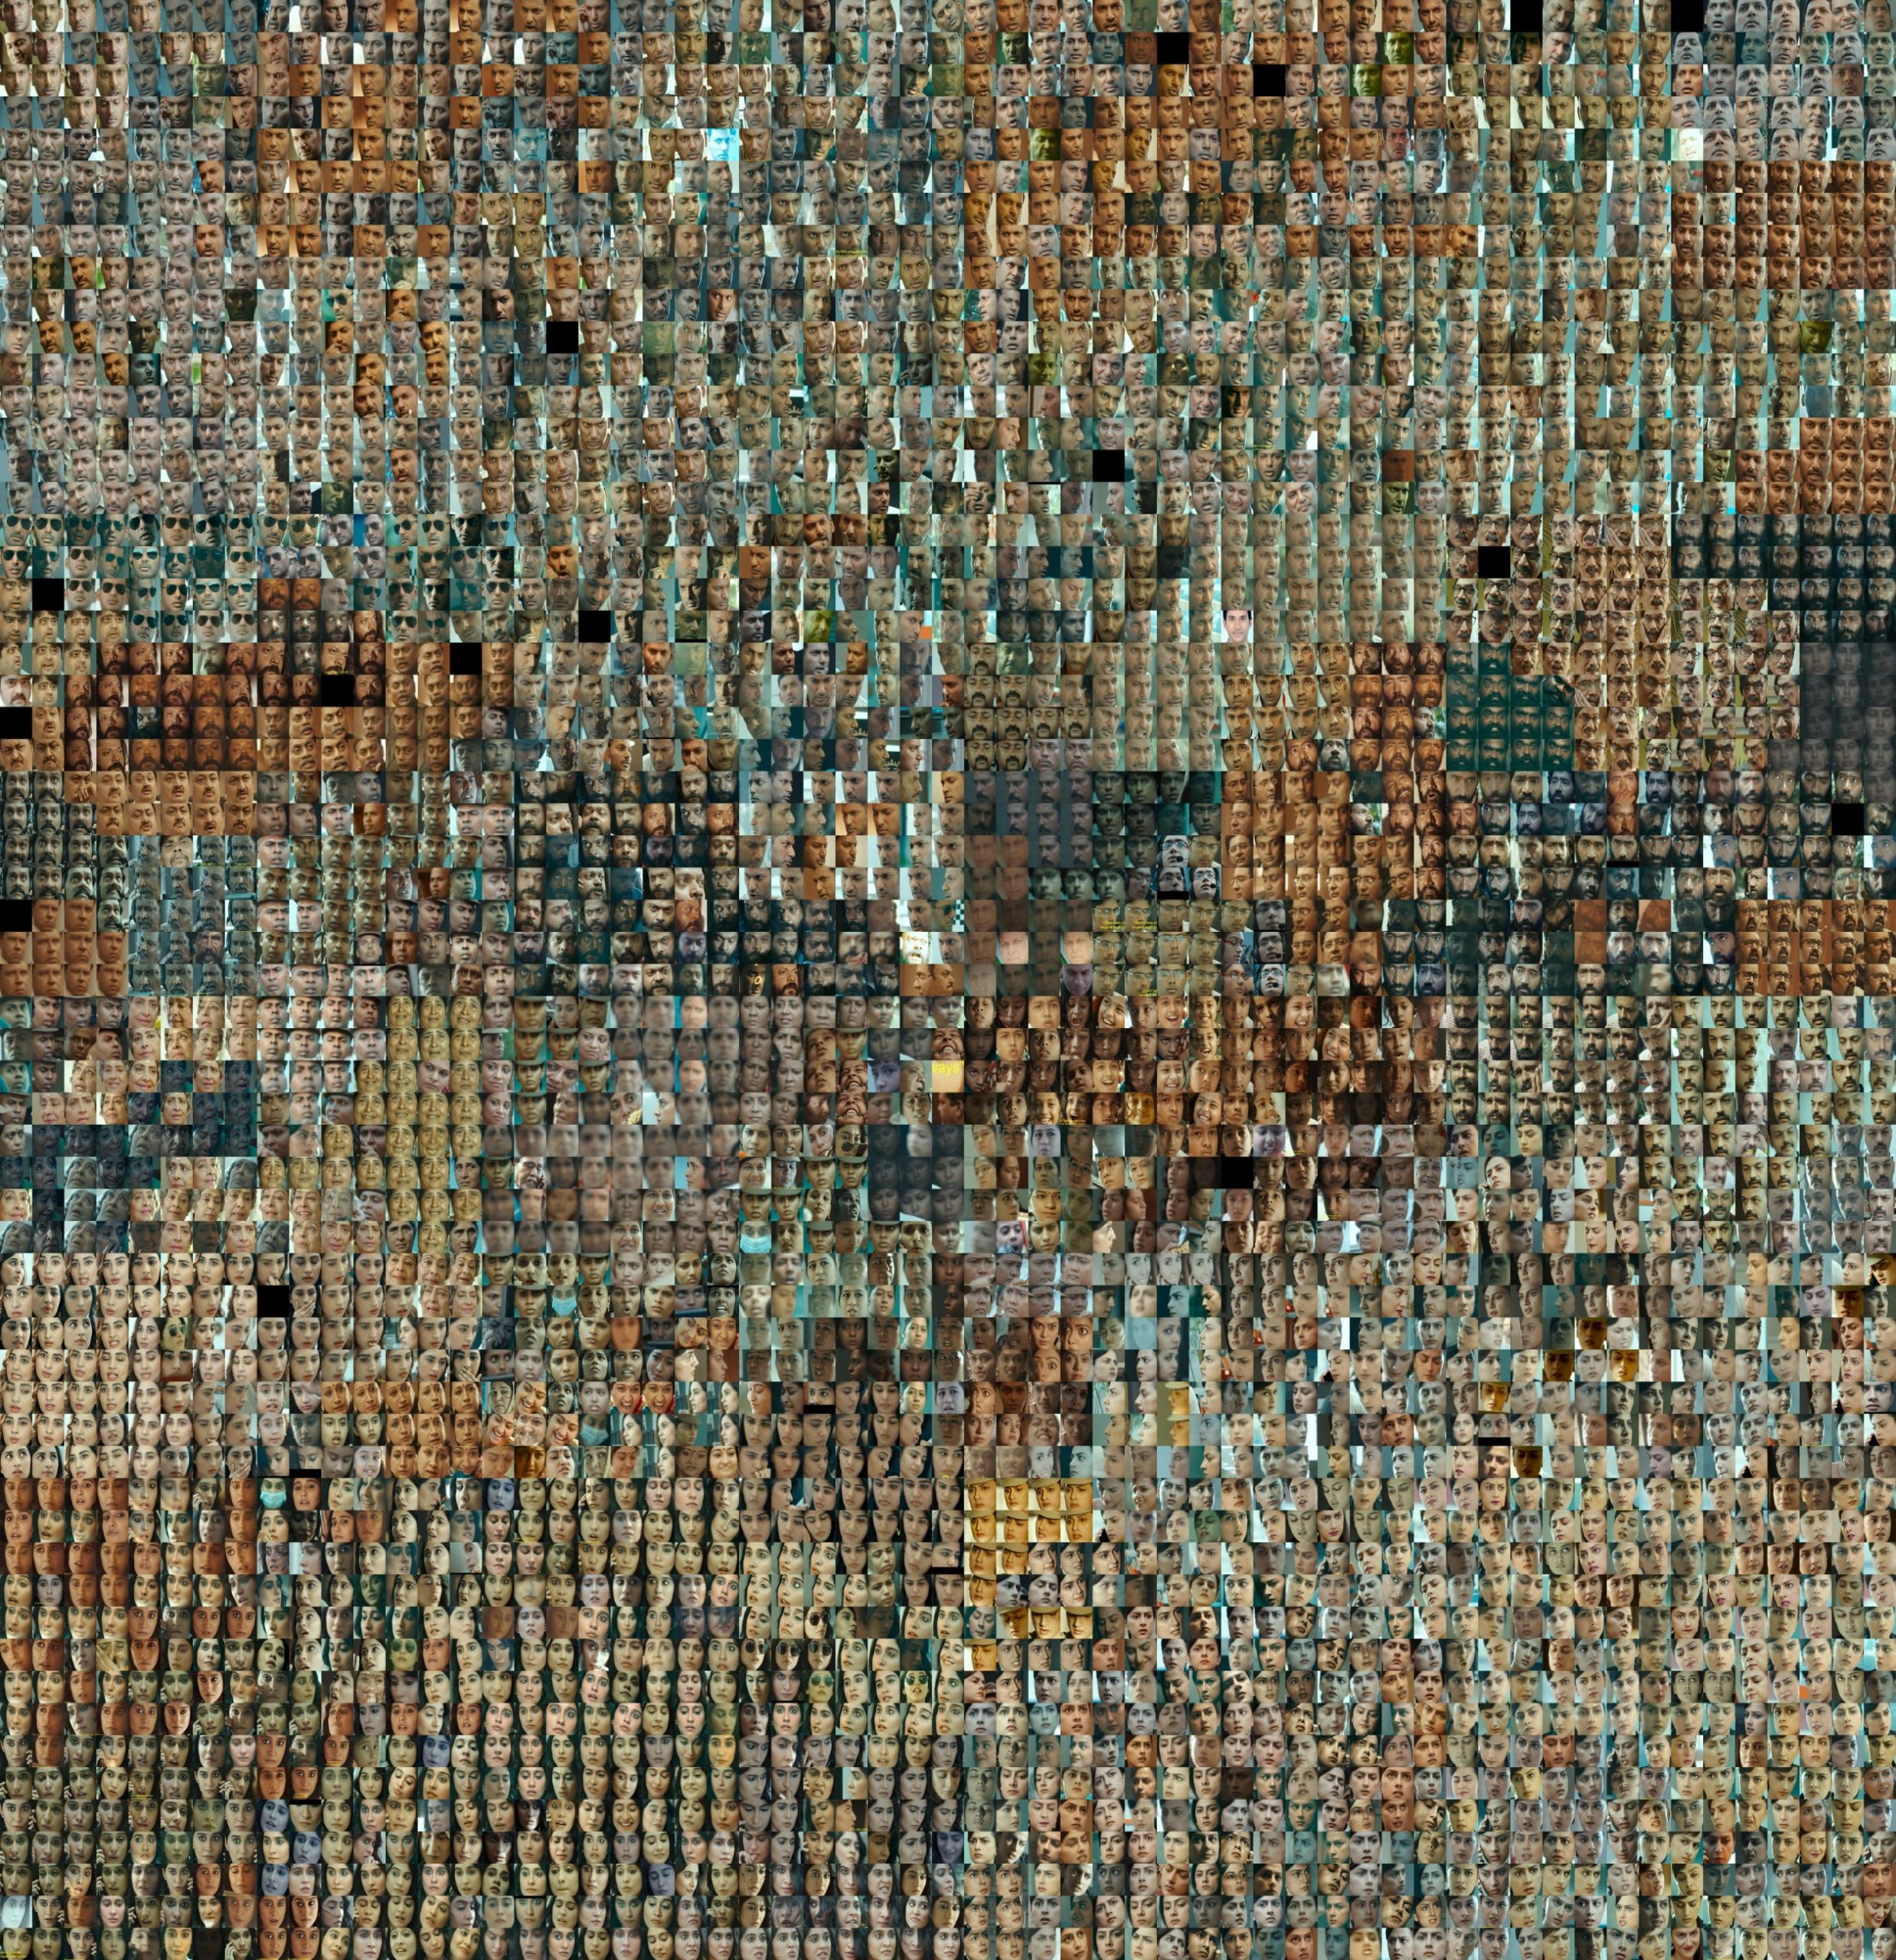
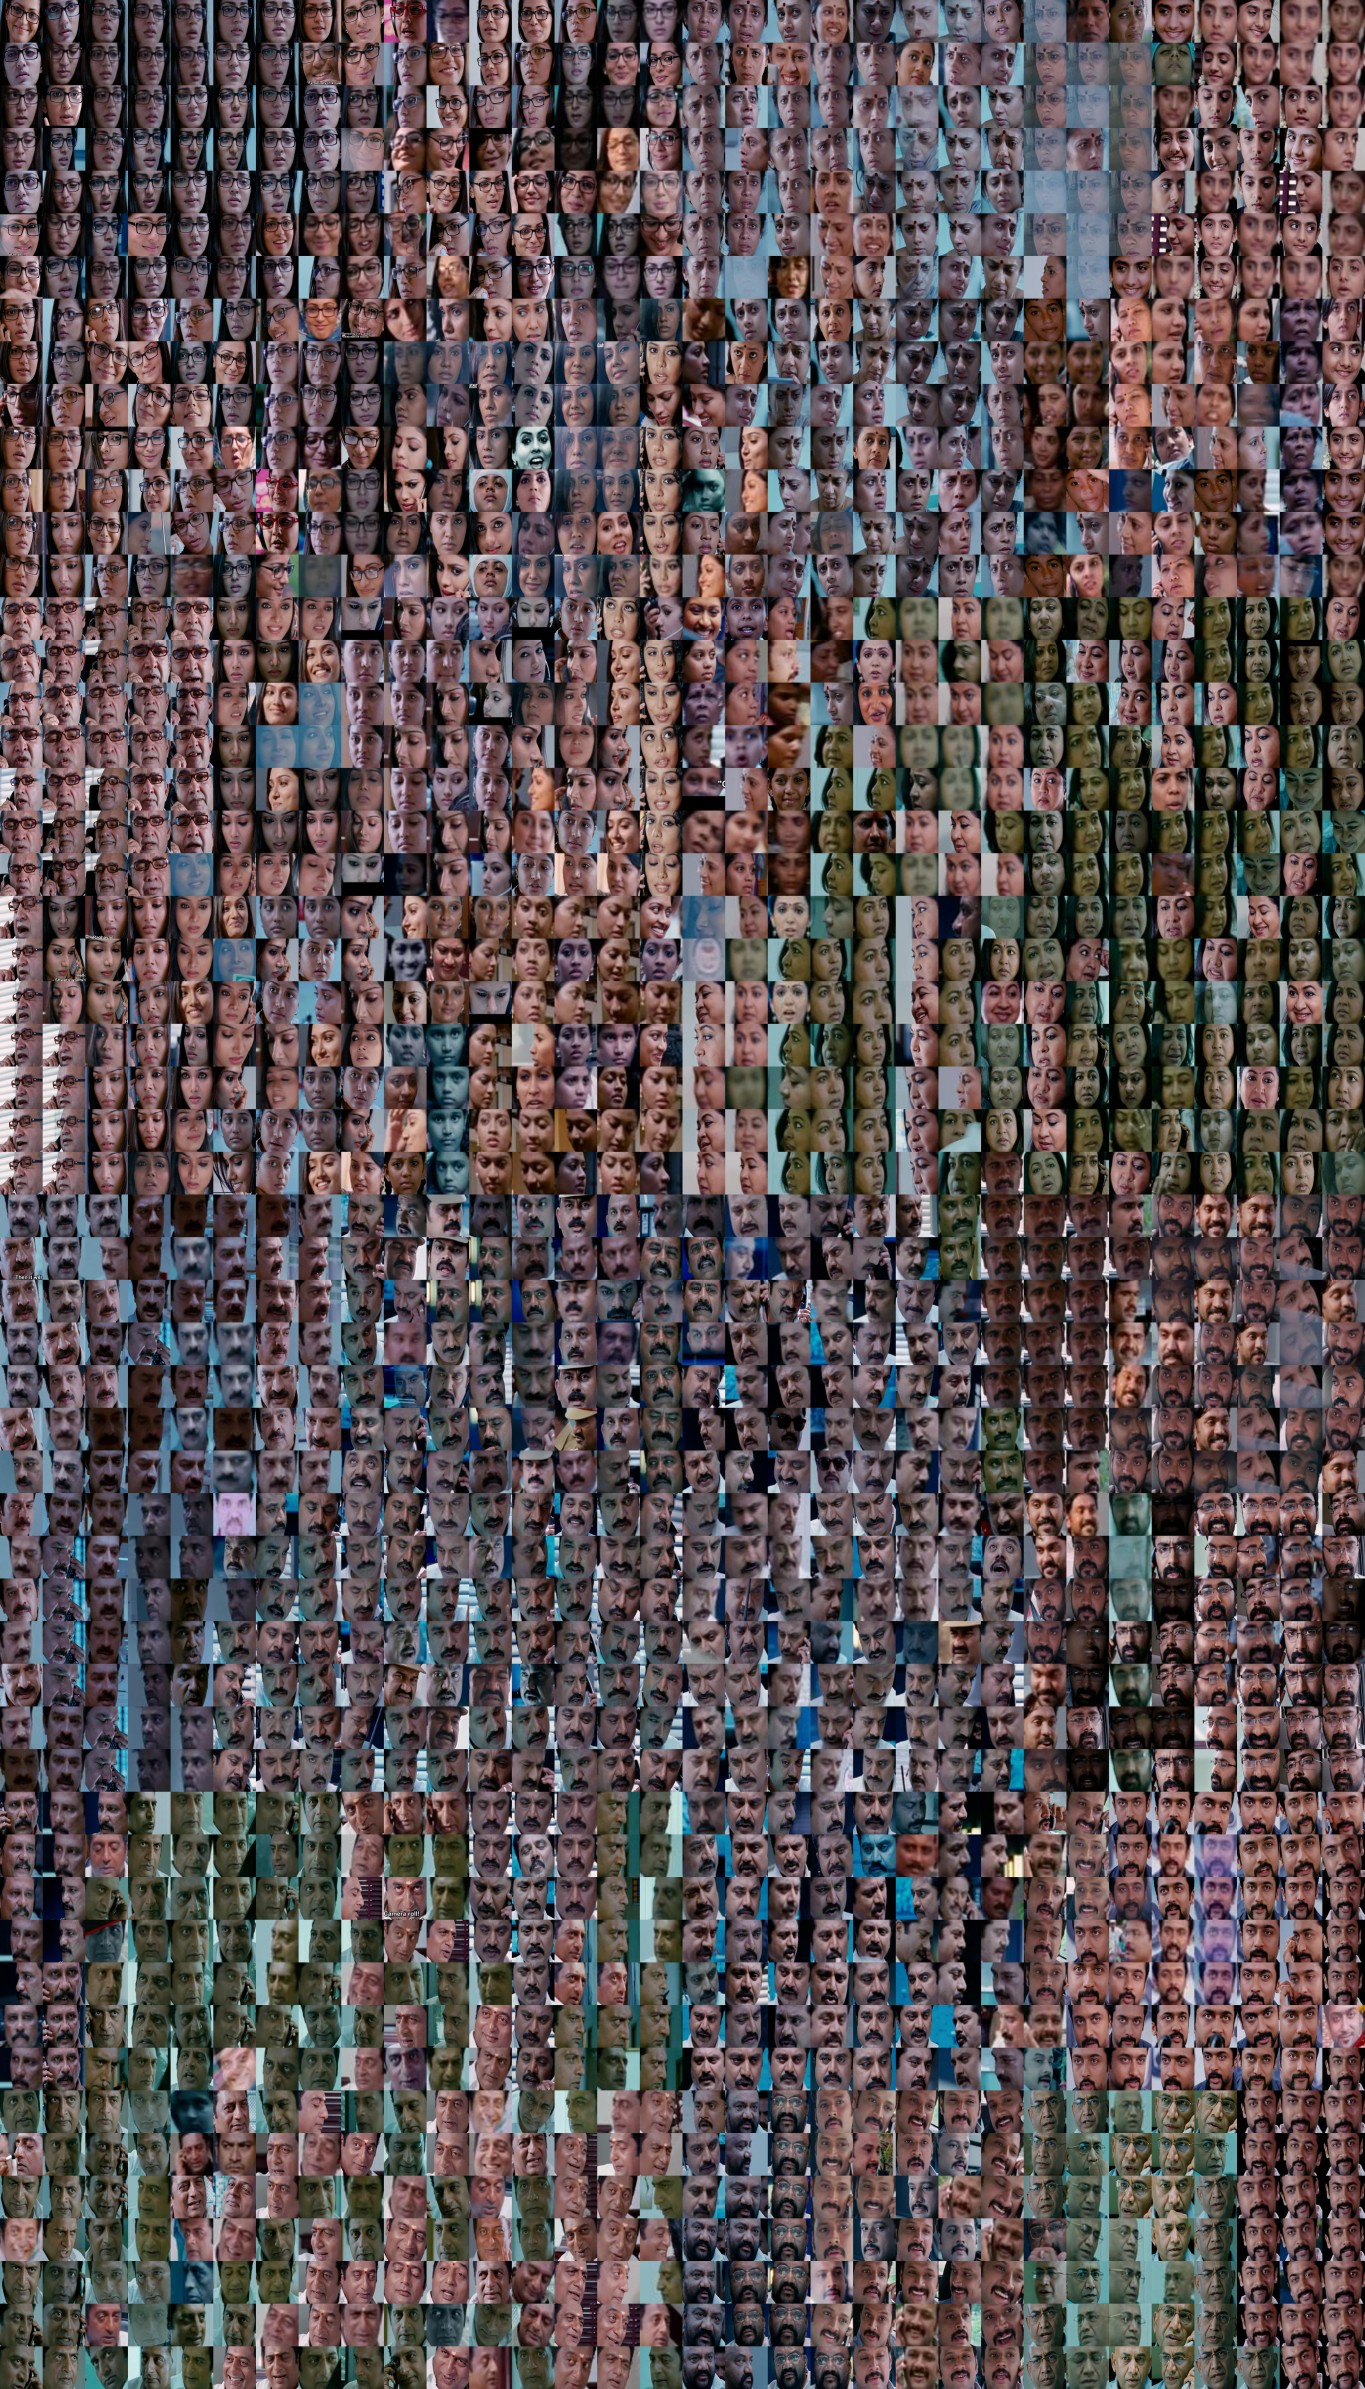
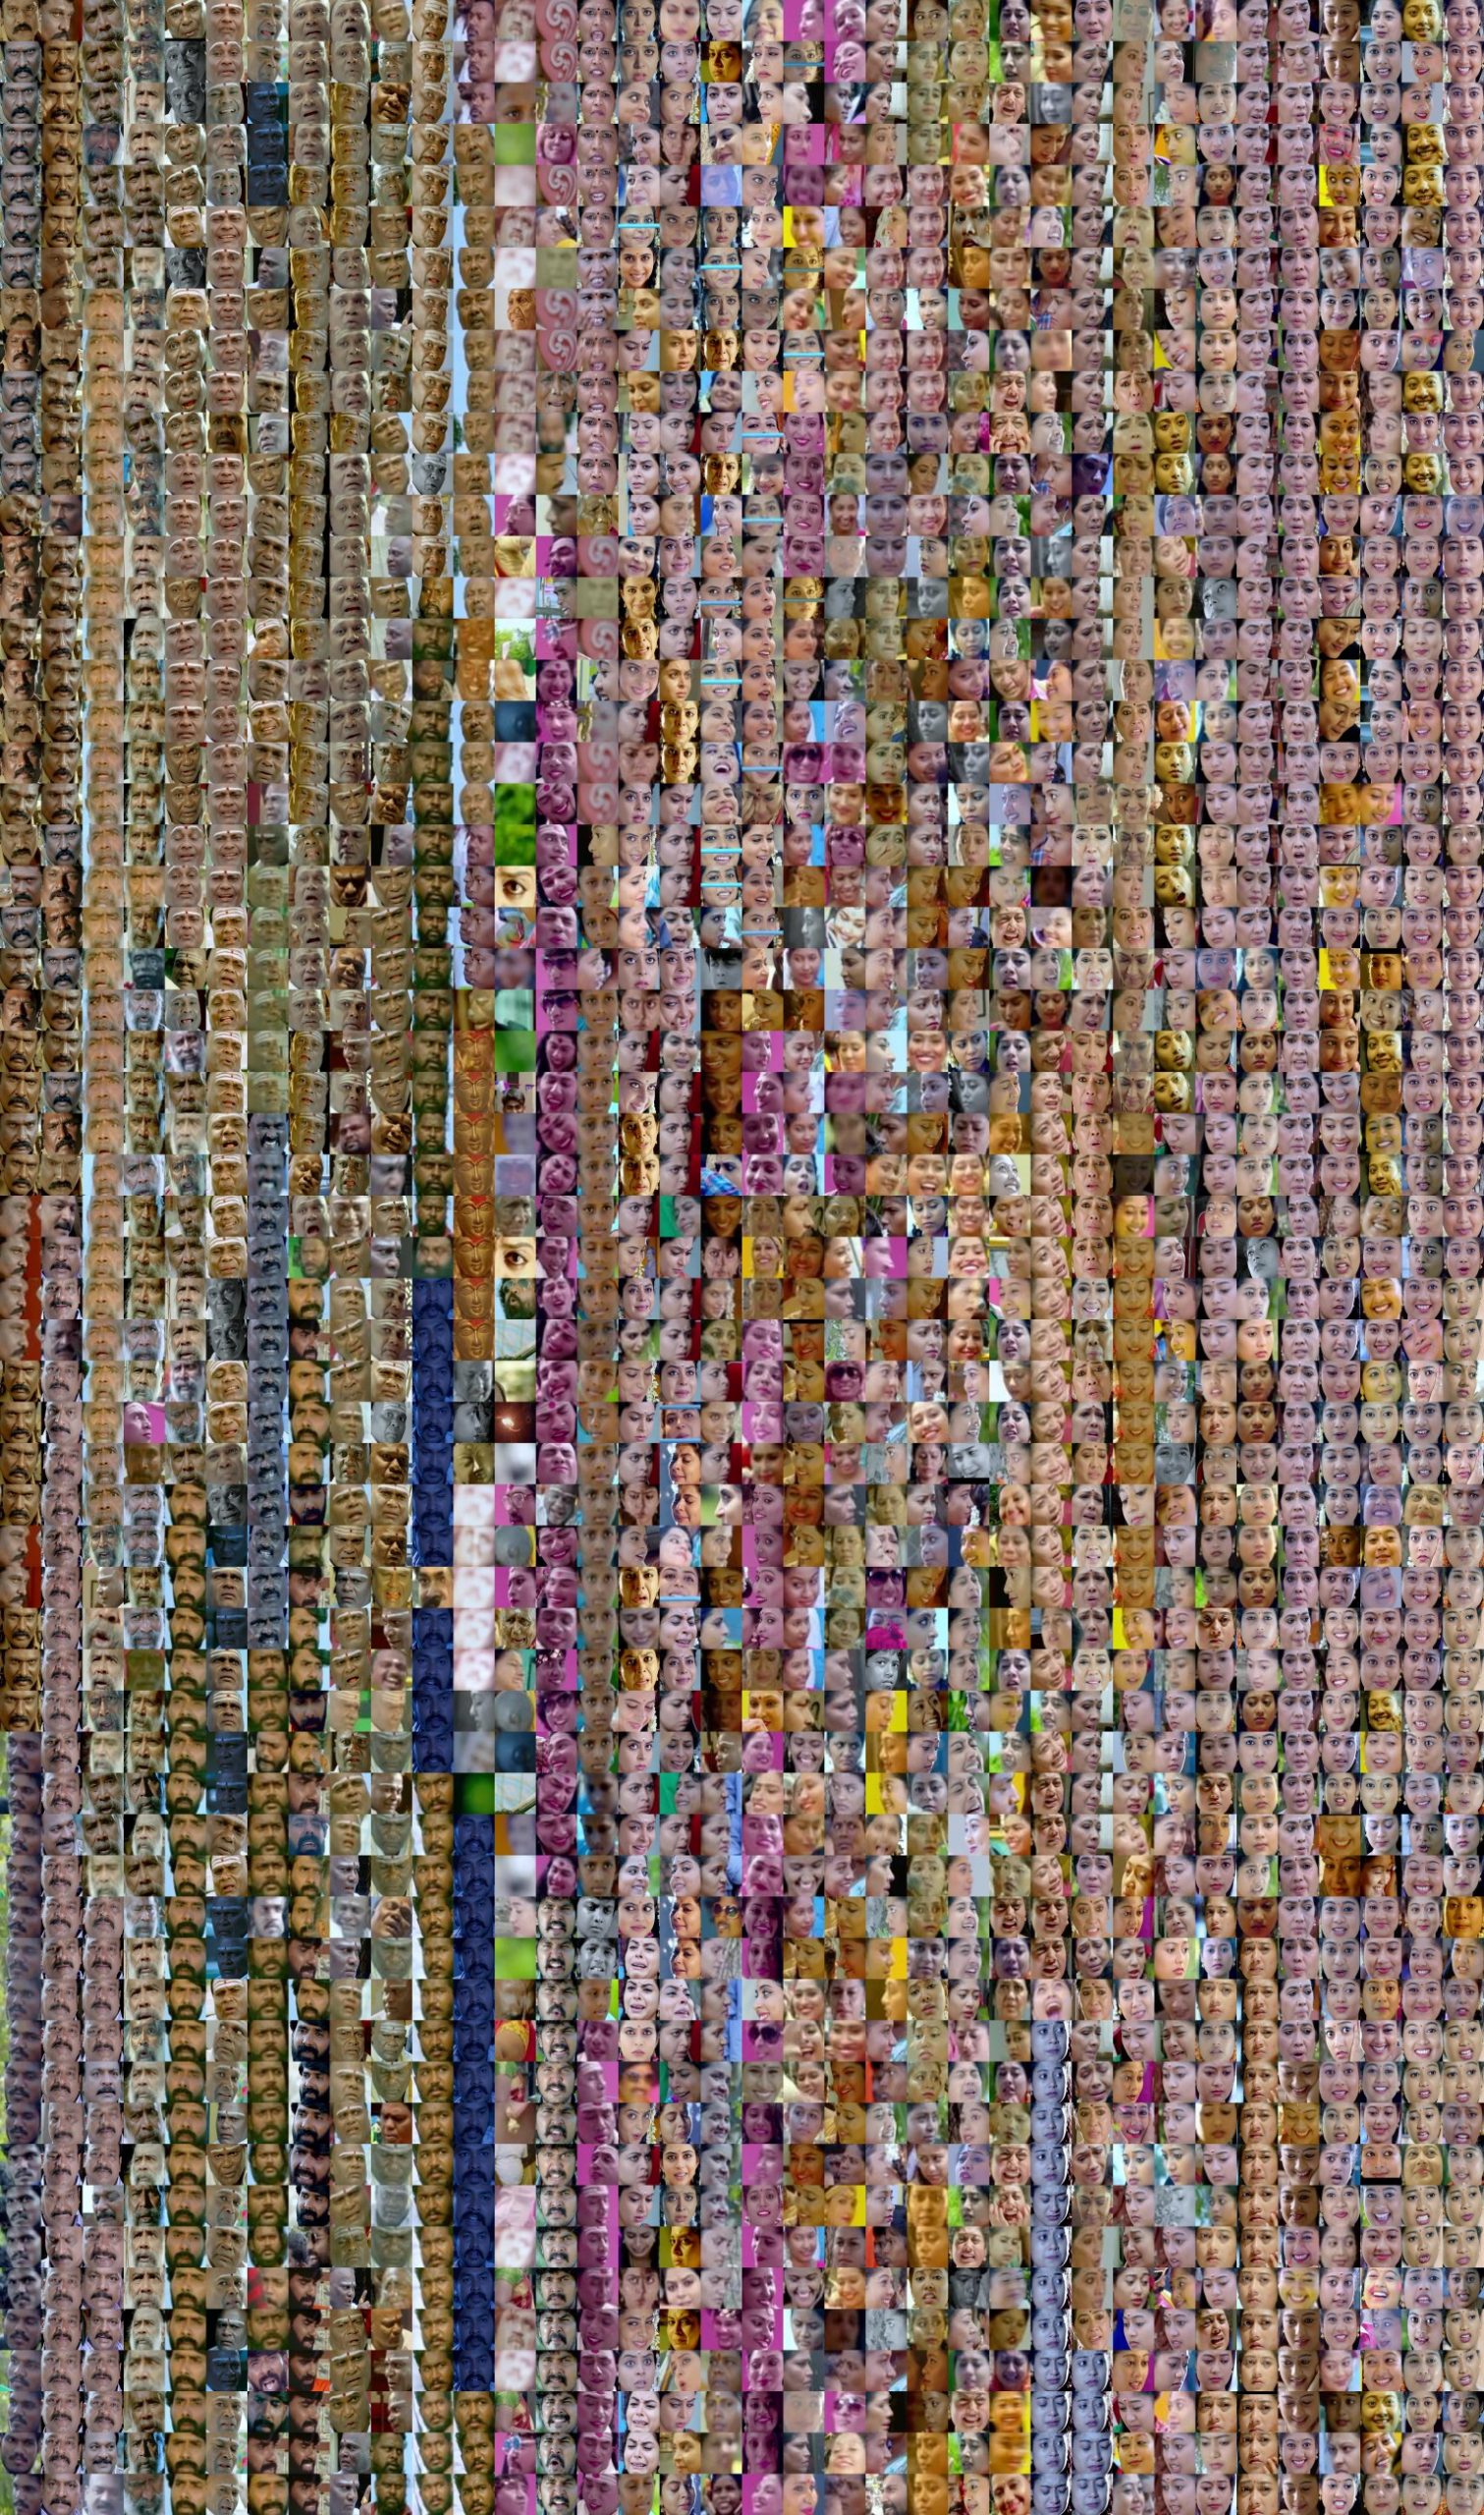
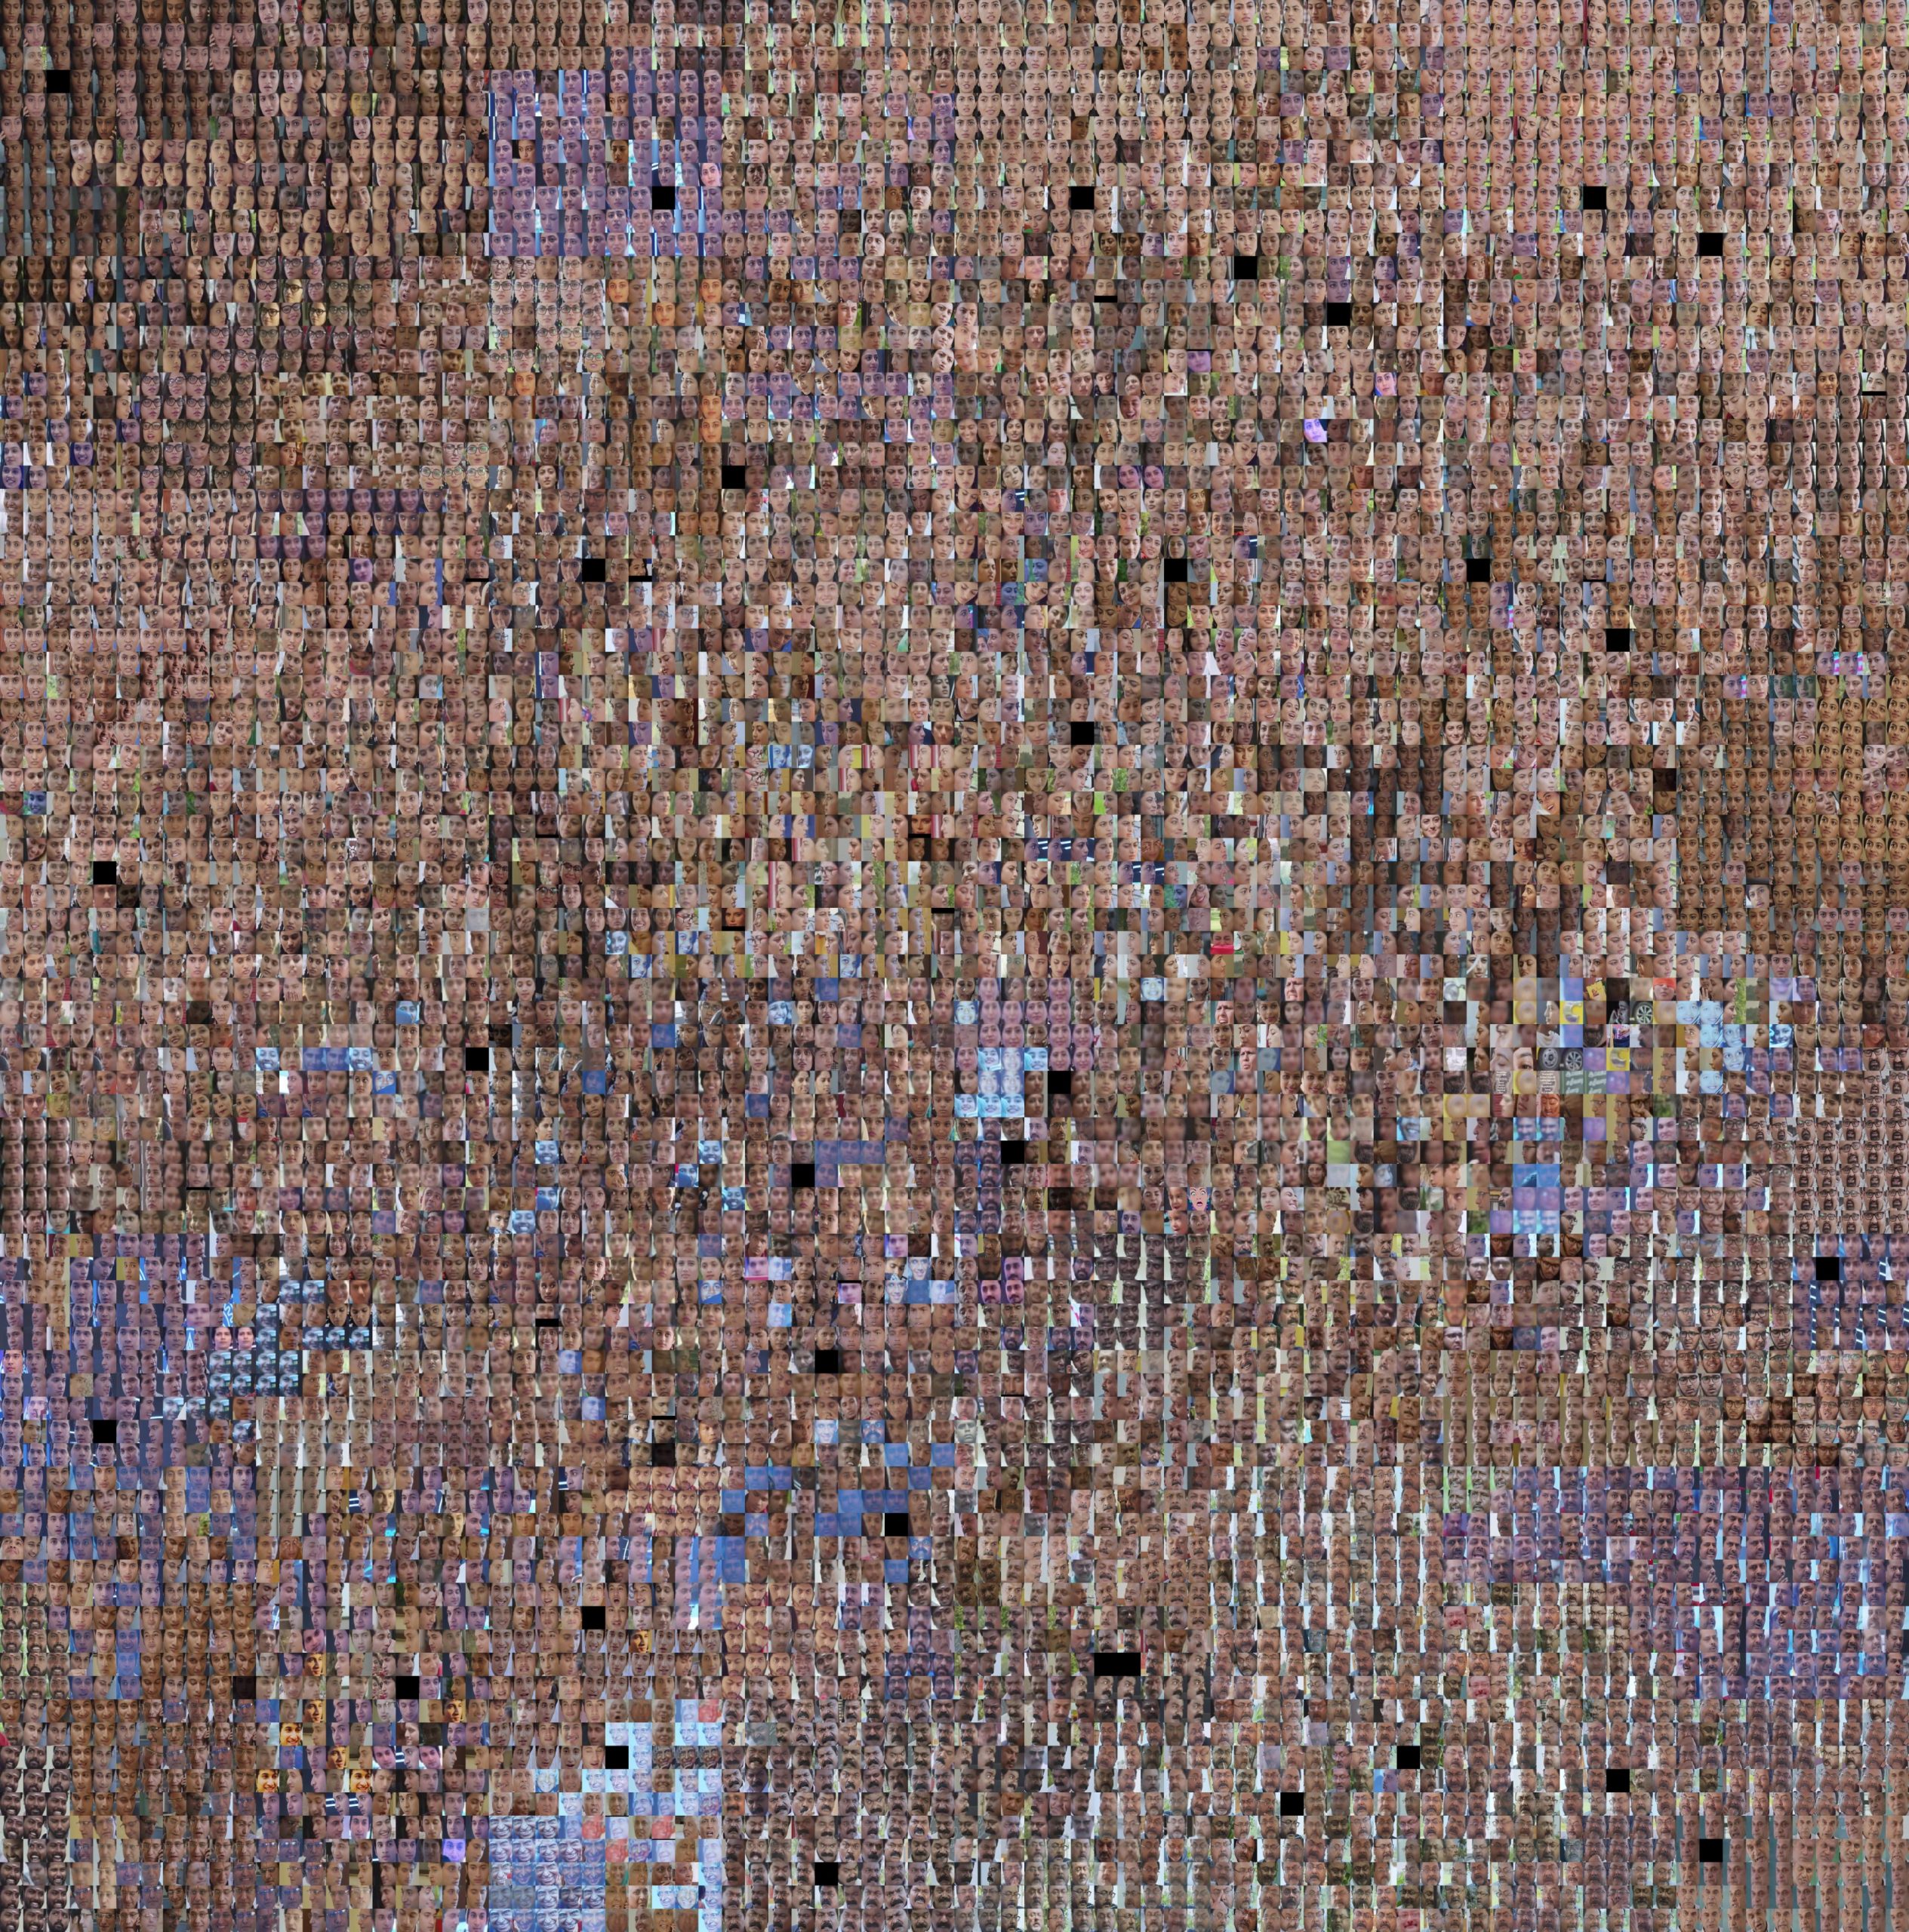
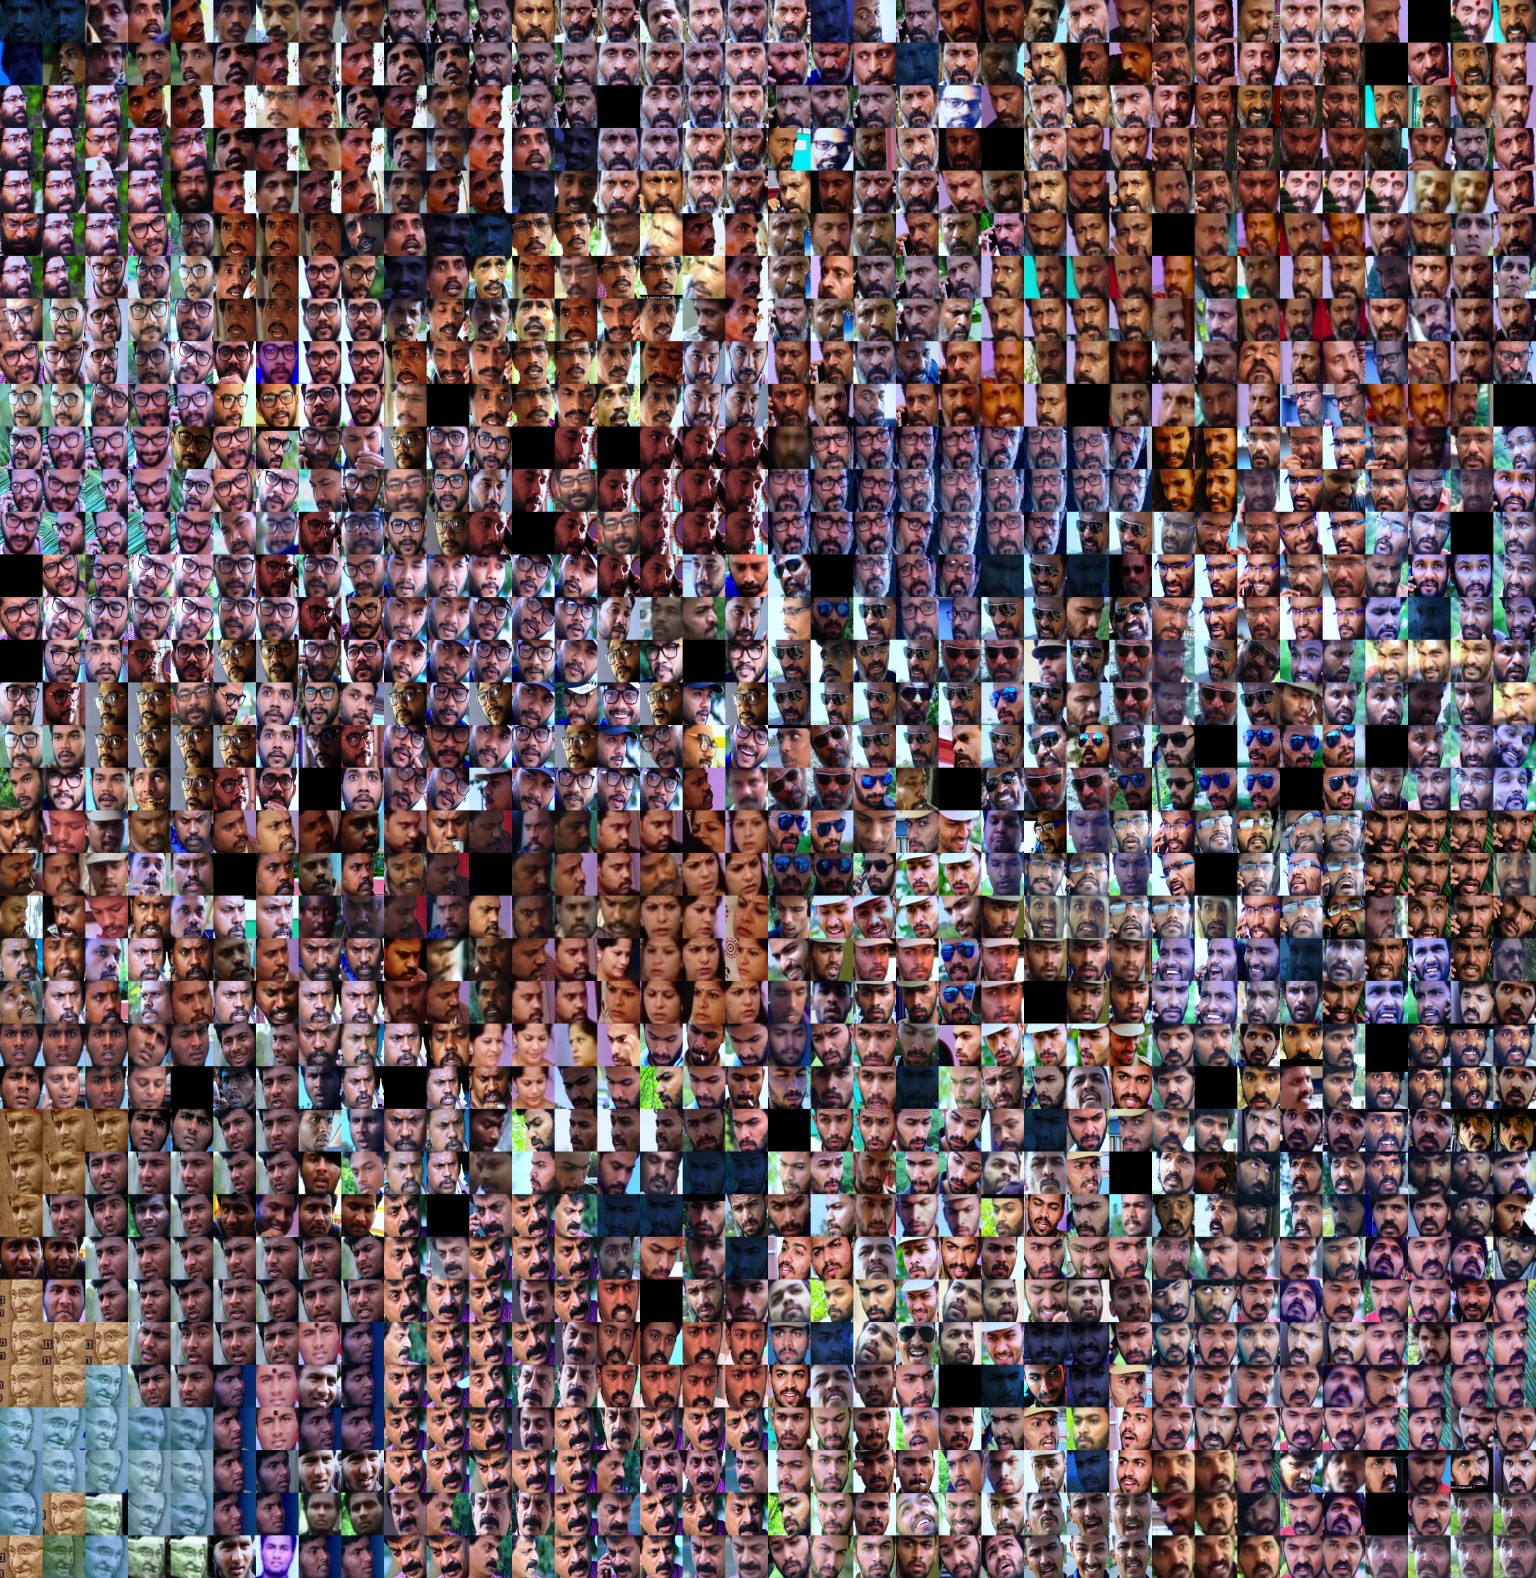
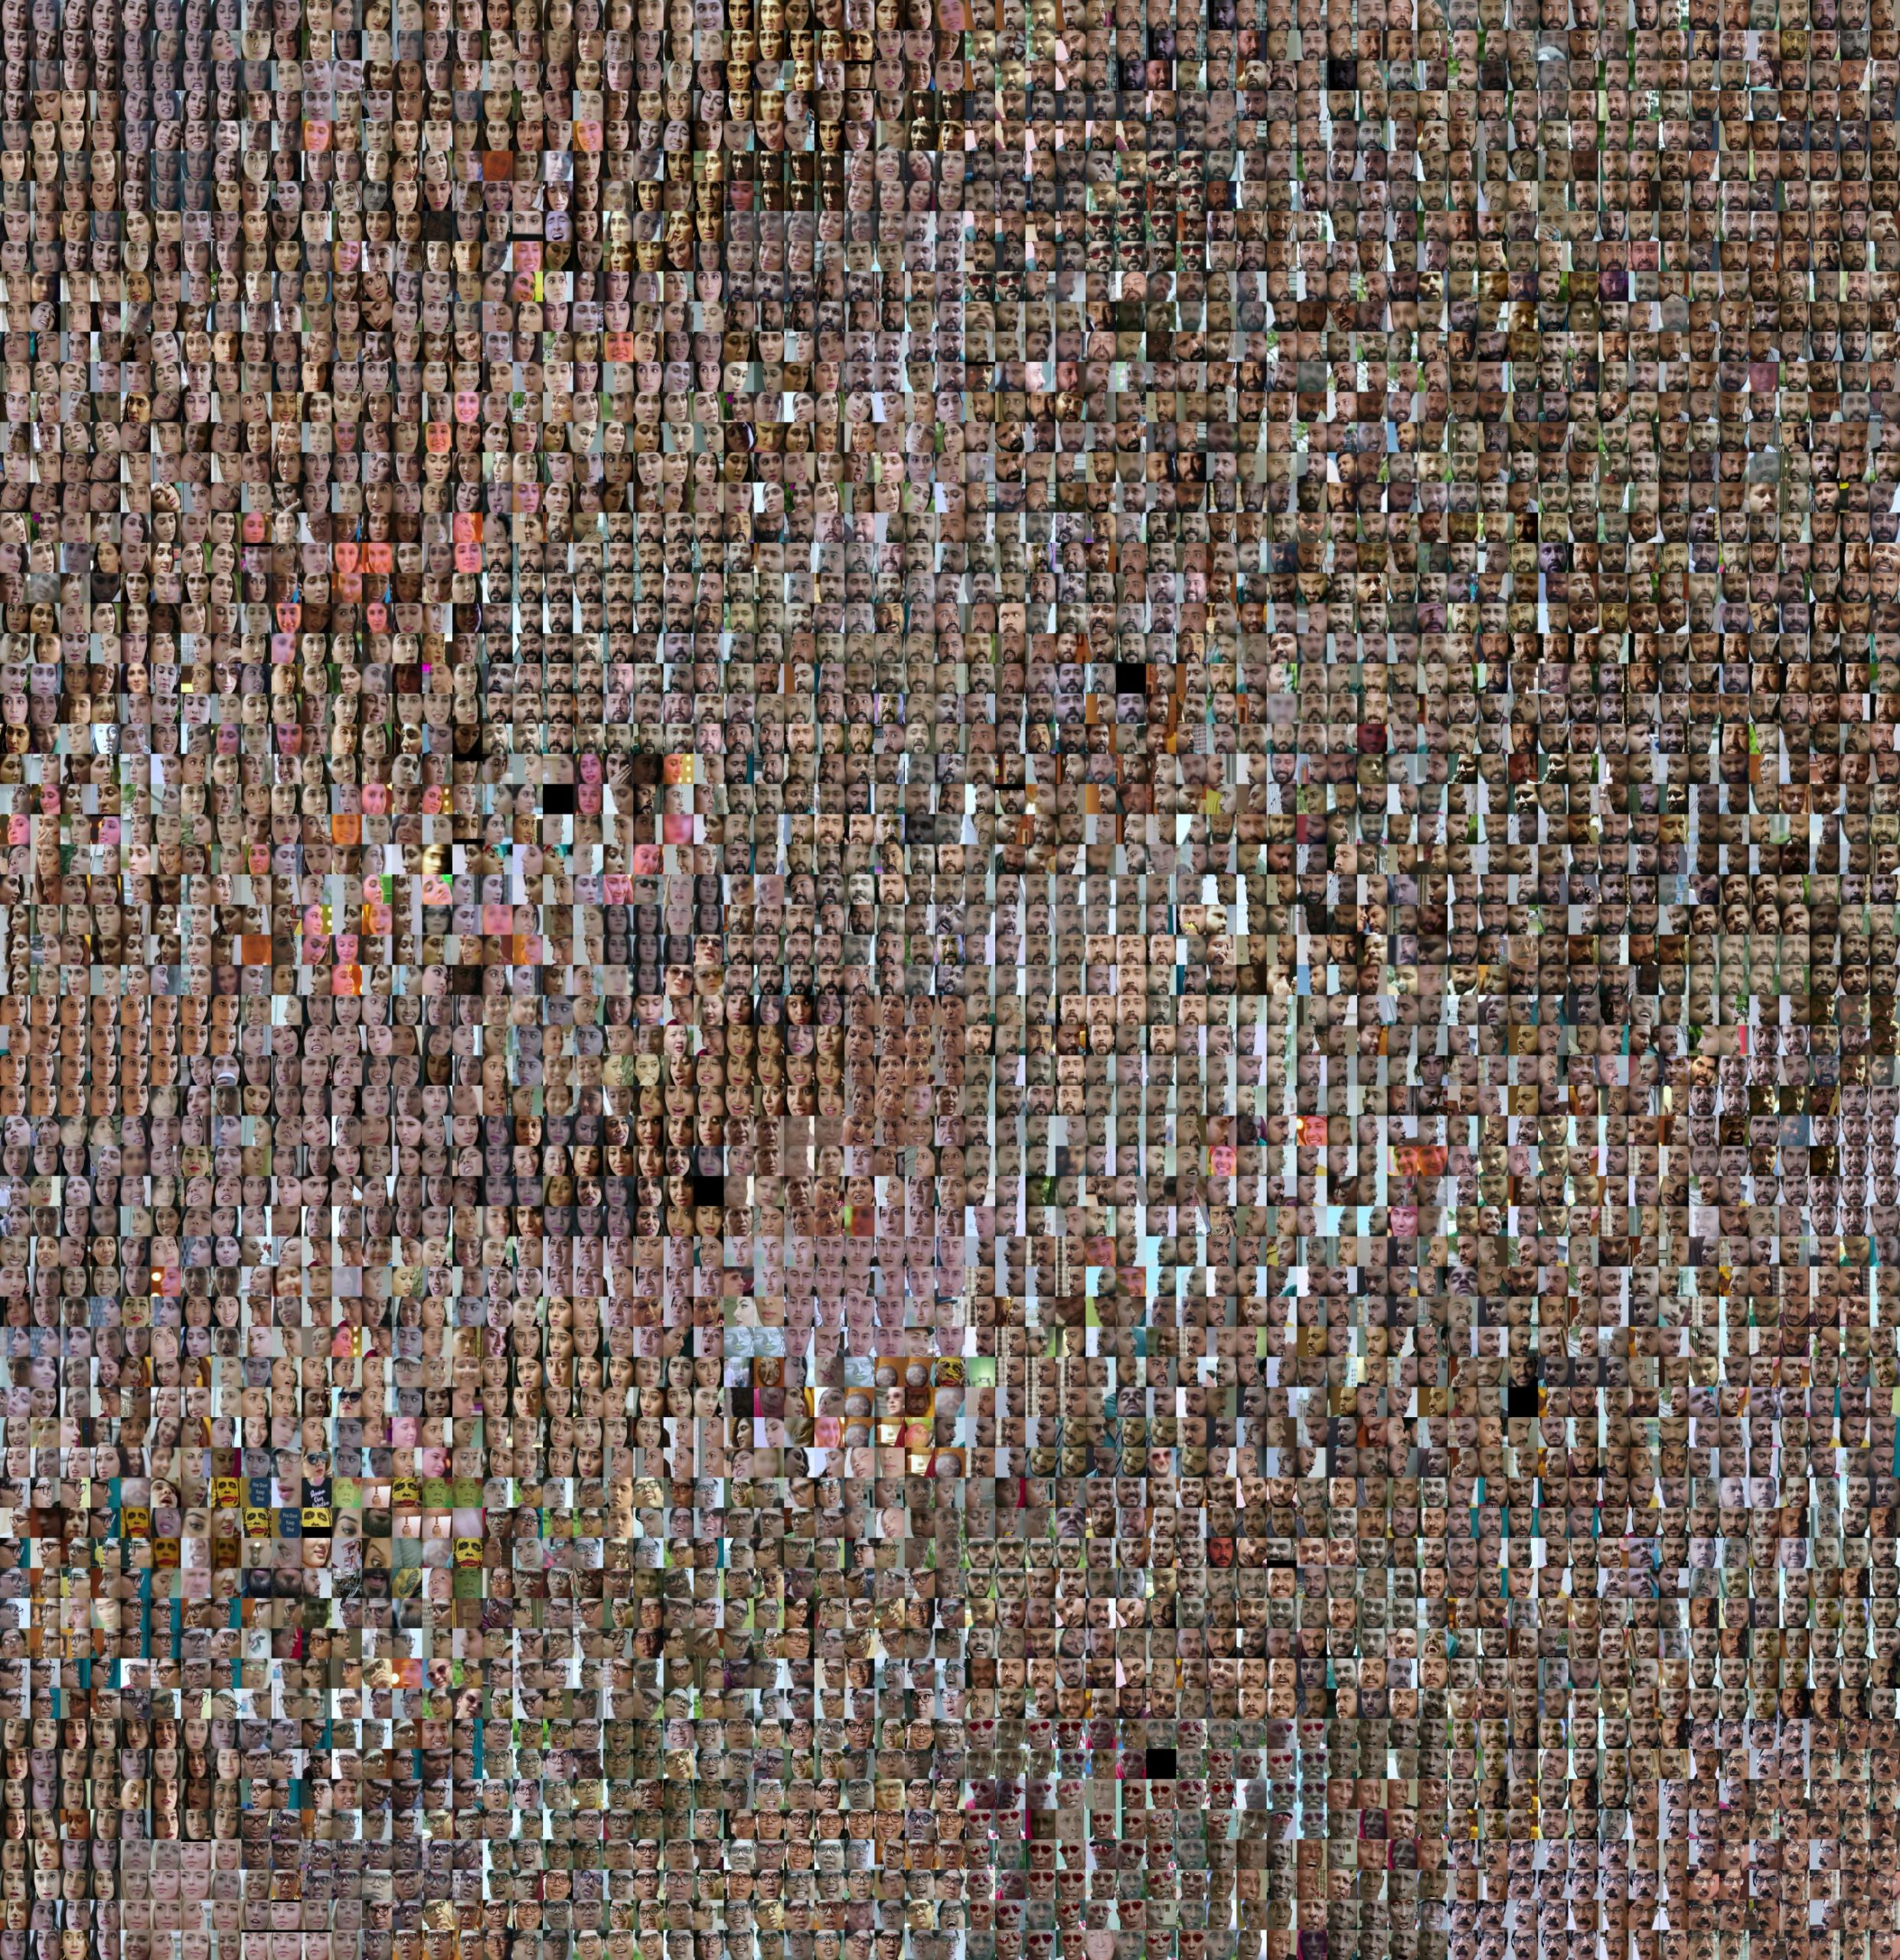
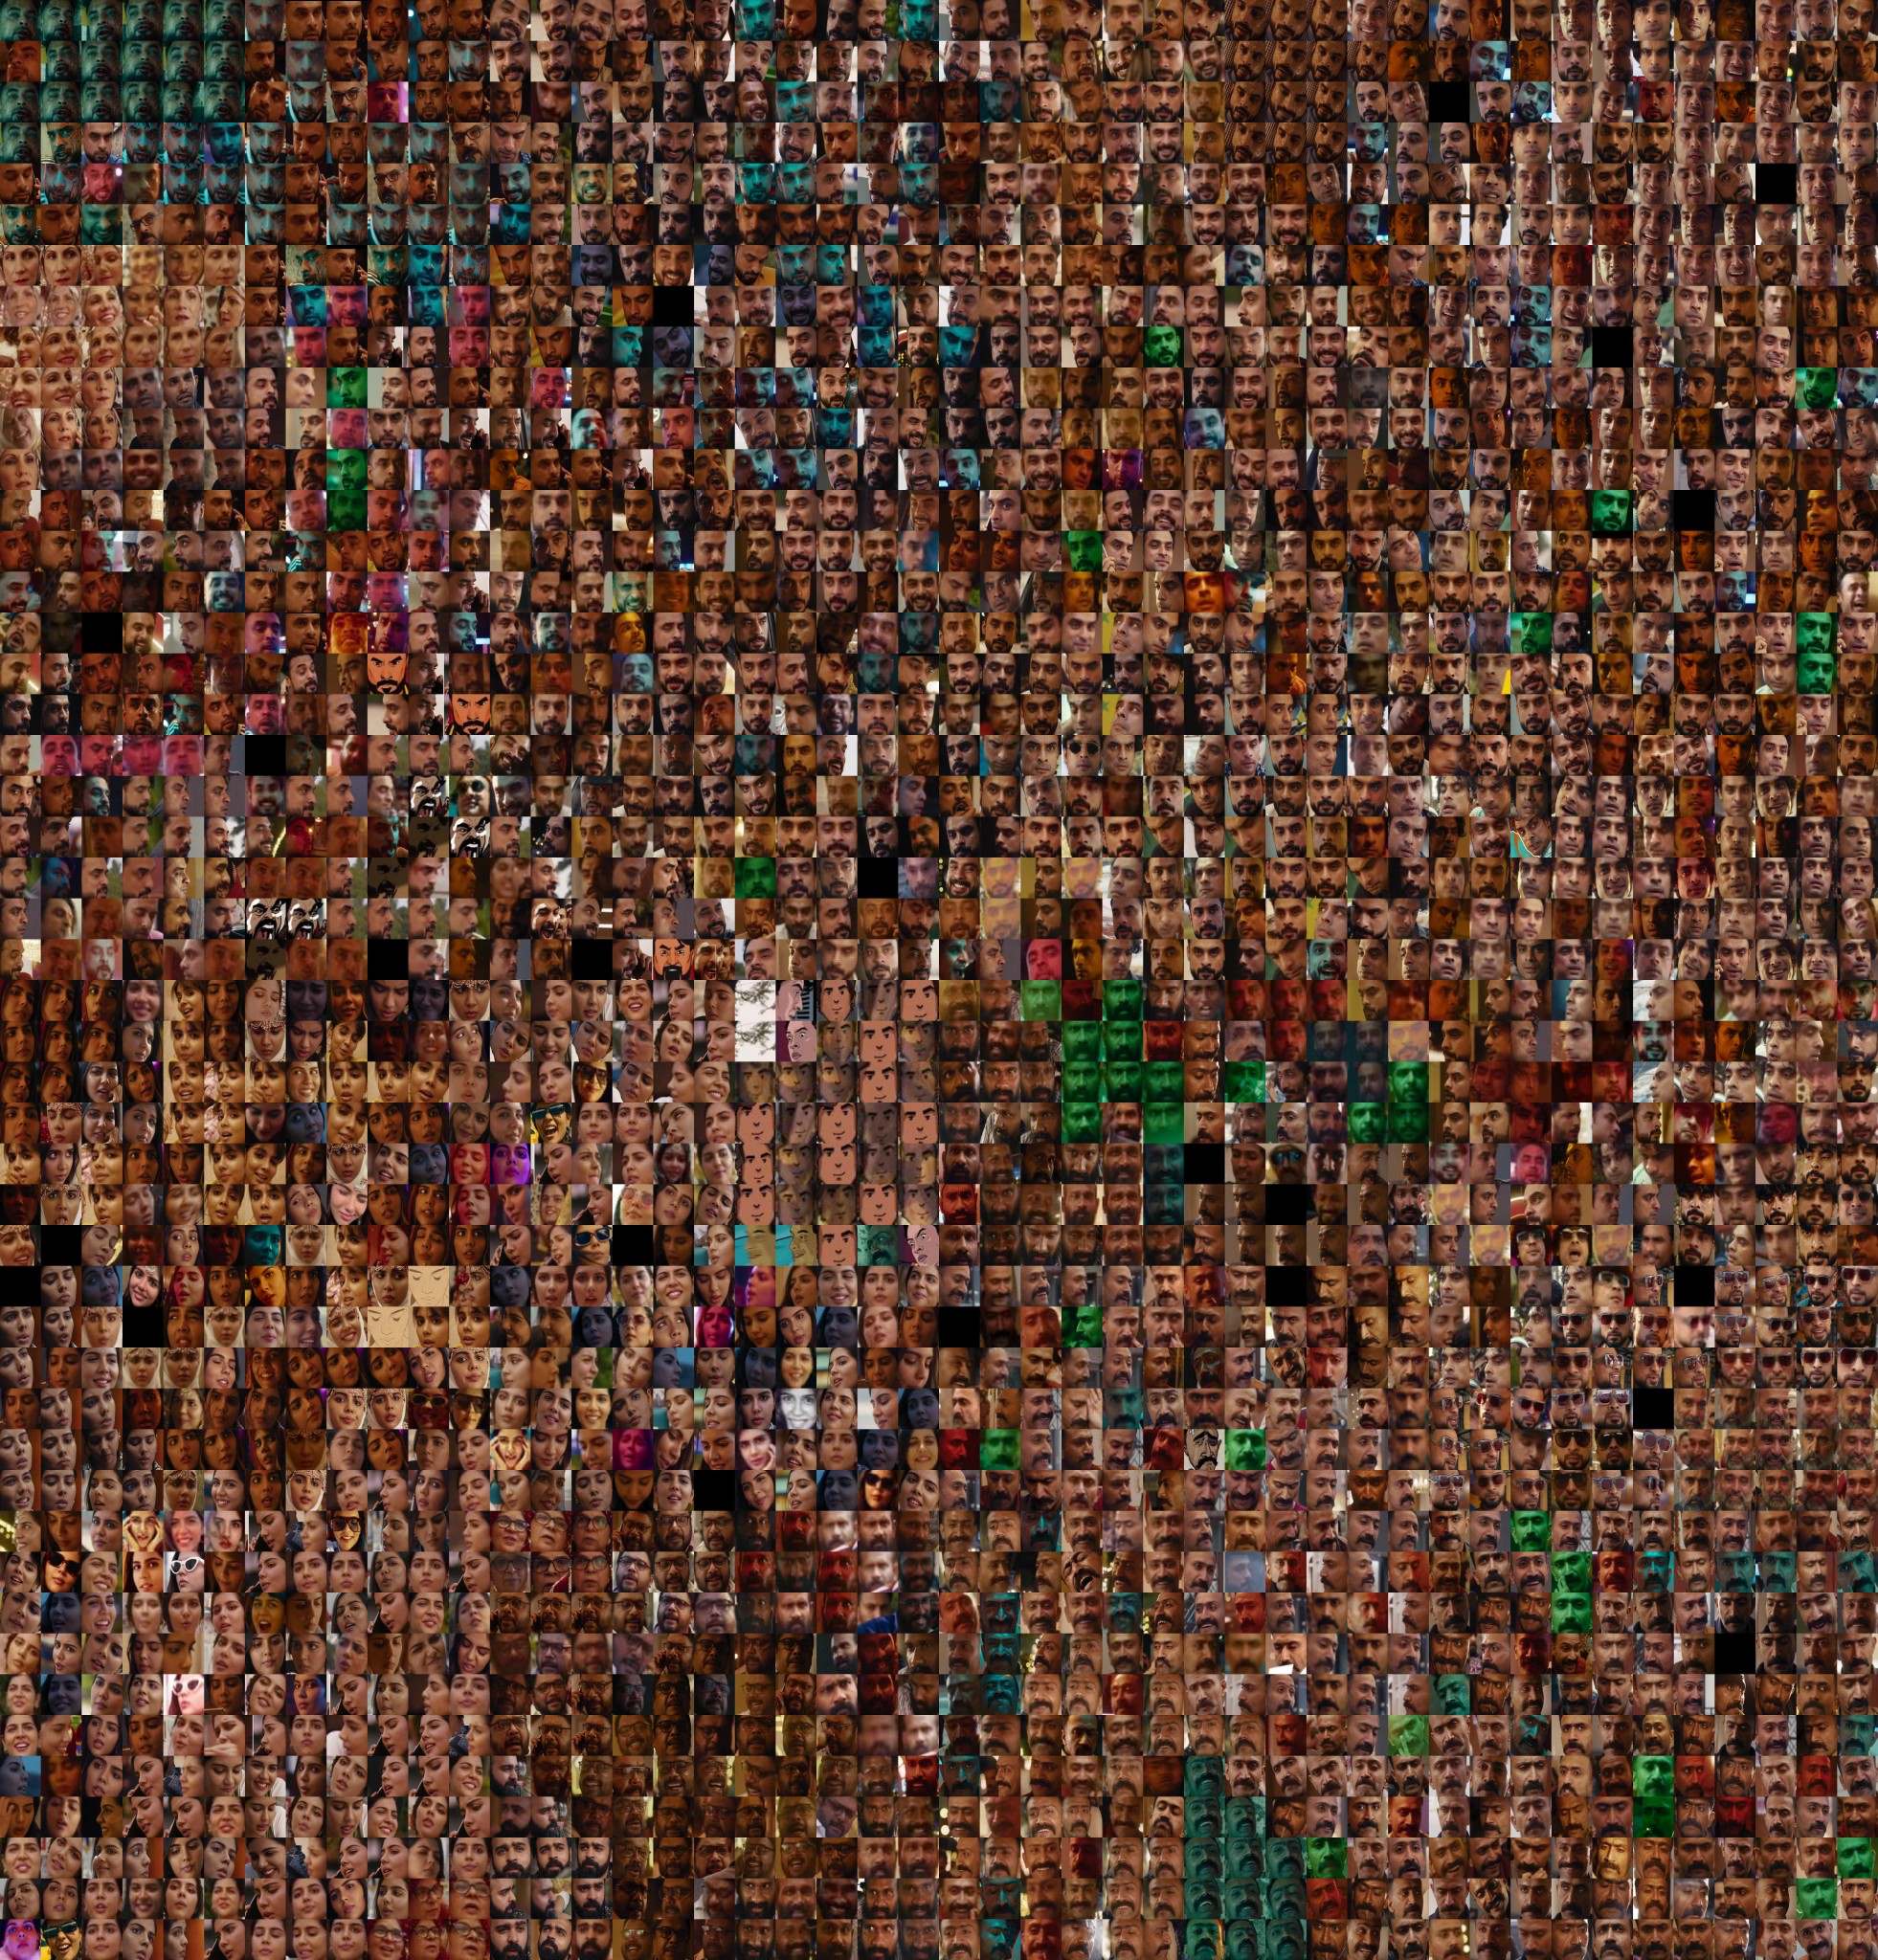
I failed at step 5 and 6. It ended up being more complicated than I anticipated to reconstruct the average skin tone of people and then construct a compelling interactive out of it. As a result, I have a sort of intermediate result instead. In the google drive below is essentially a collection of per movie images. Each image is the clustered faces of the people in that film organized by a reduced version of their embedding vector. The distance and location between faces in this representation is not directly related to skintone, rather it is what the computer decides best represents faces in 2d. That could be skin tone in some ways but it’s less obvious than that.
Result
reflecting on the end result: Though the intermediate product lacks the conceptual backing of my original proposal, in its own right I think it’s a series of compelling images. I do find it pleasurable to sit and scroll across the images and observe some of the dumb faces actors and actresses make.
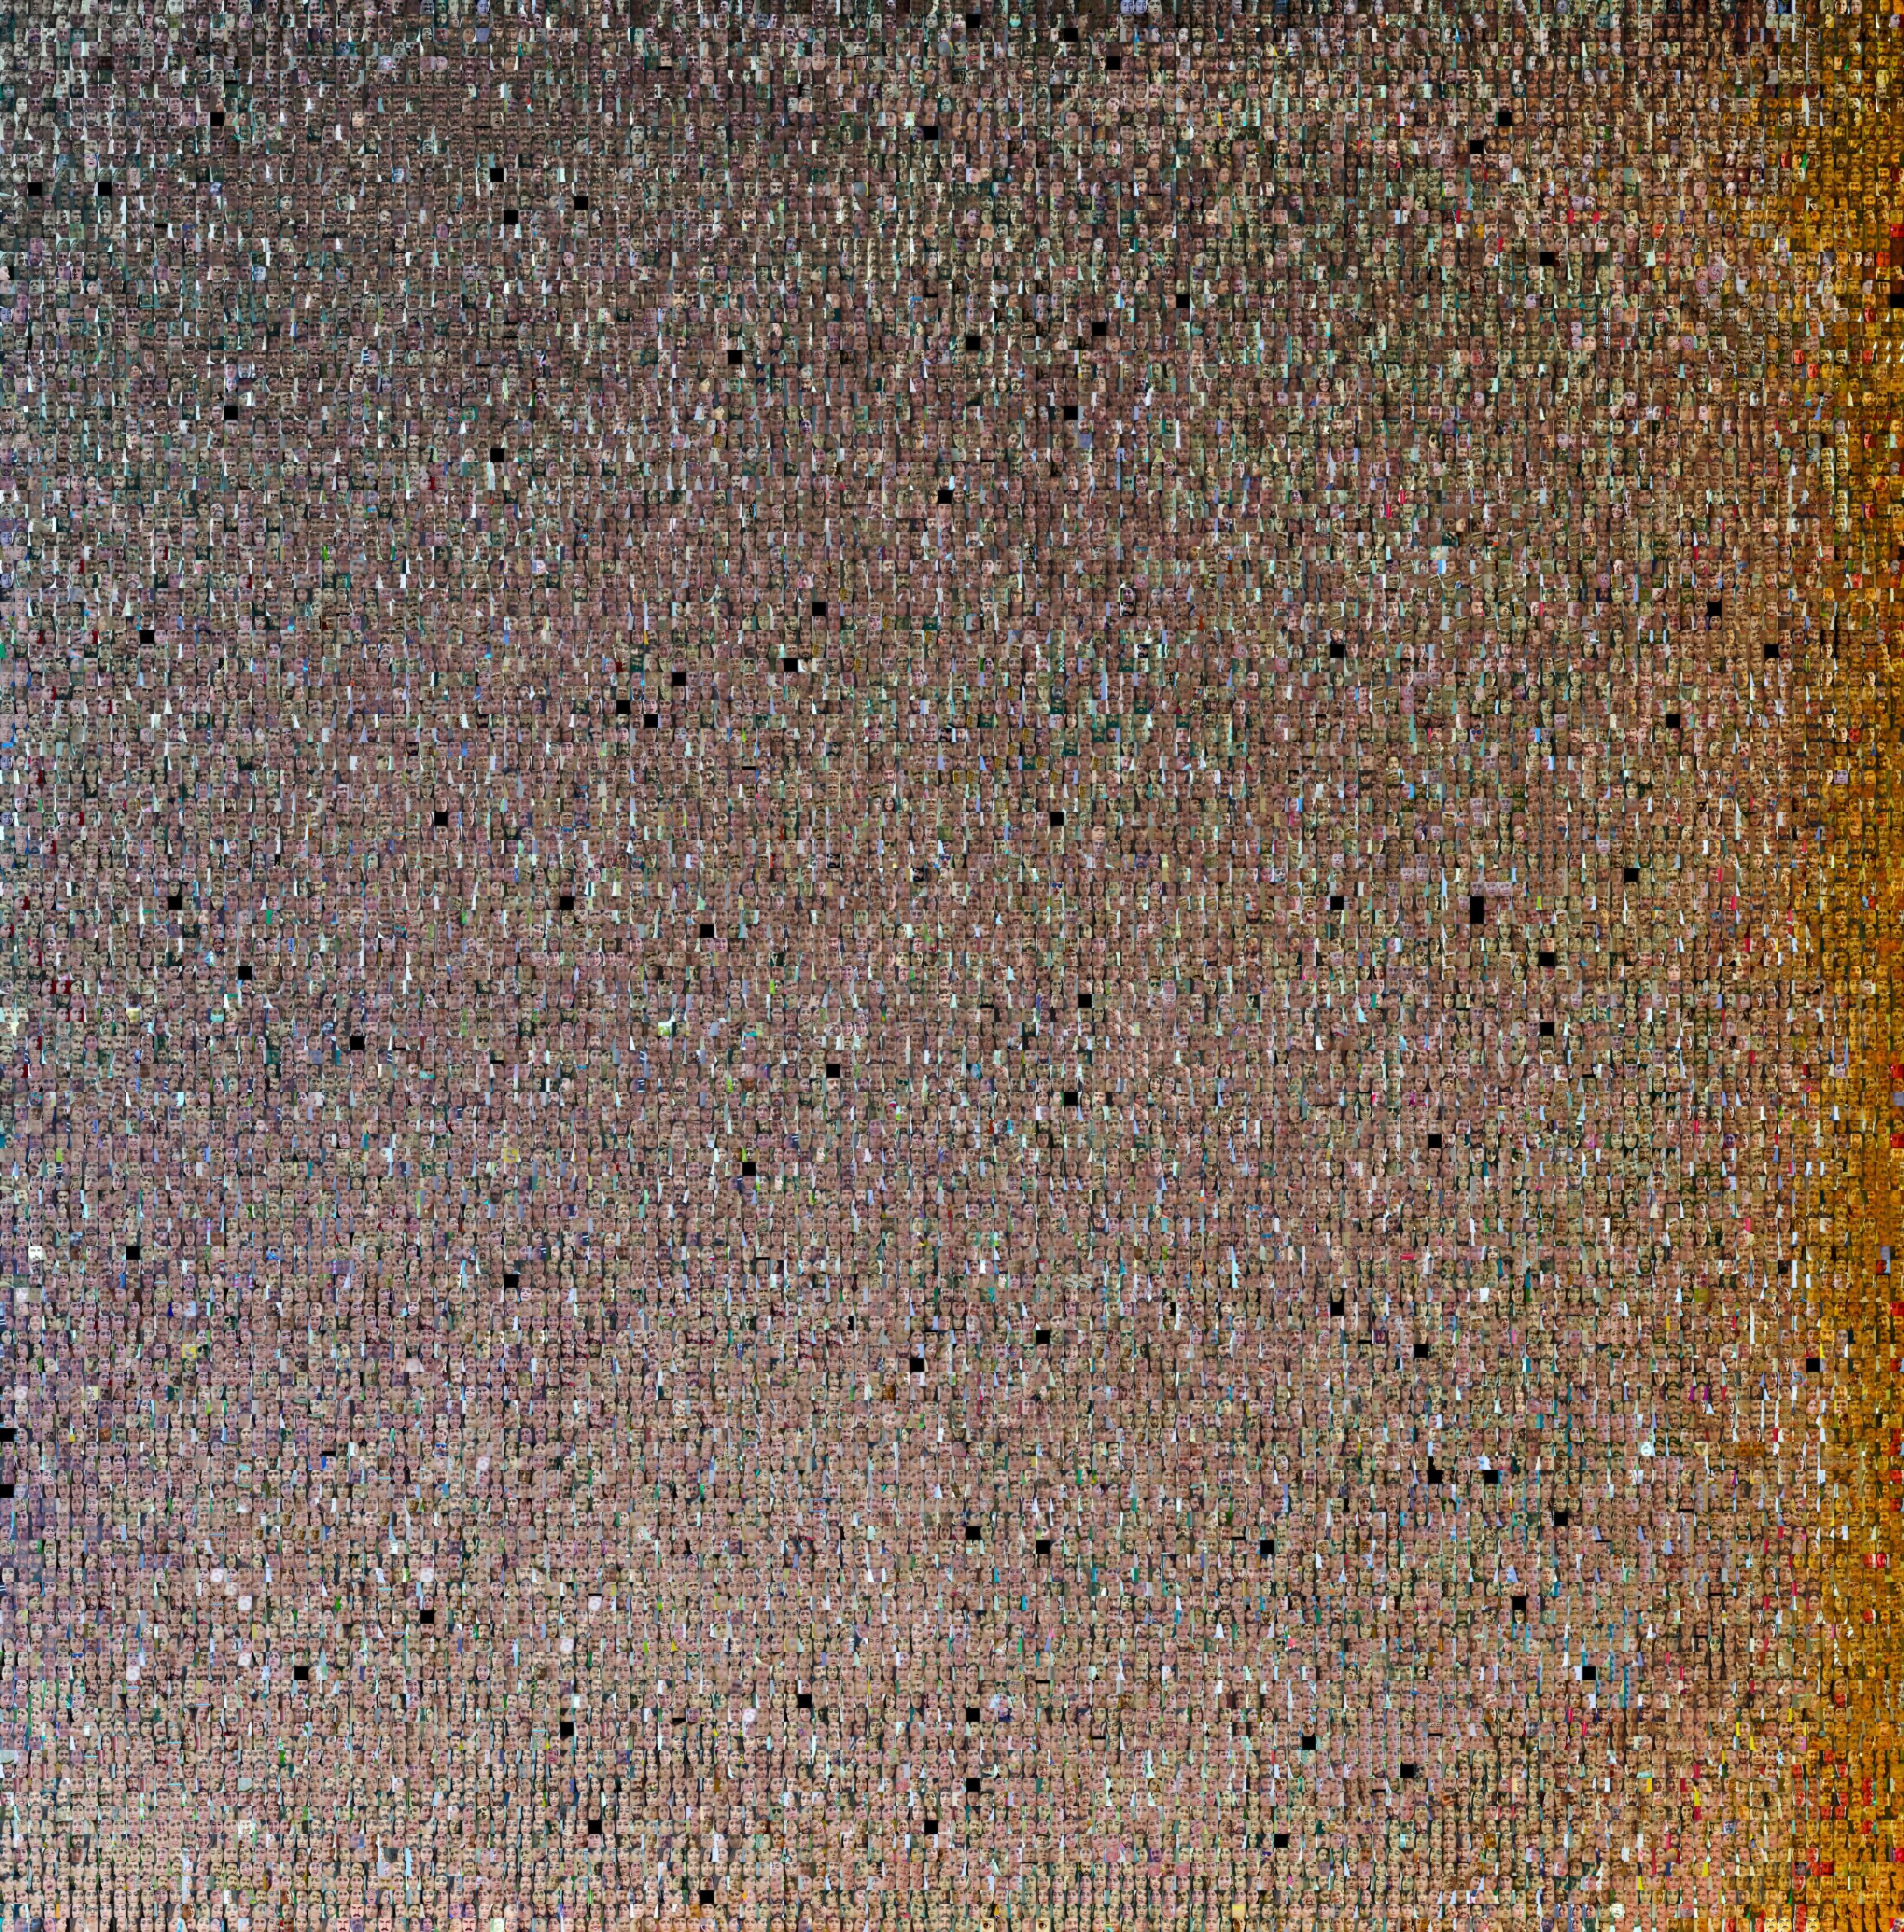
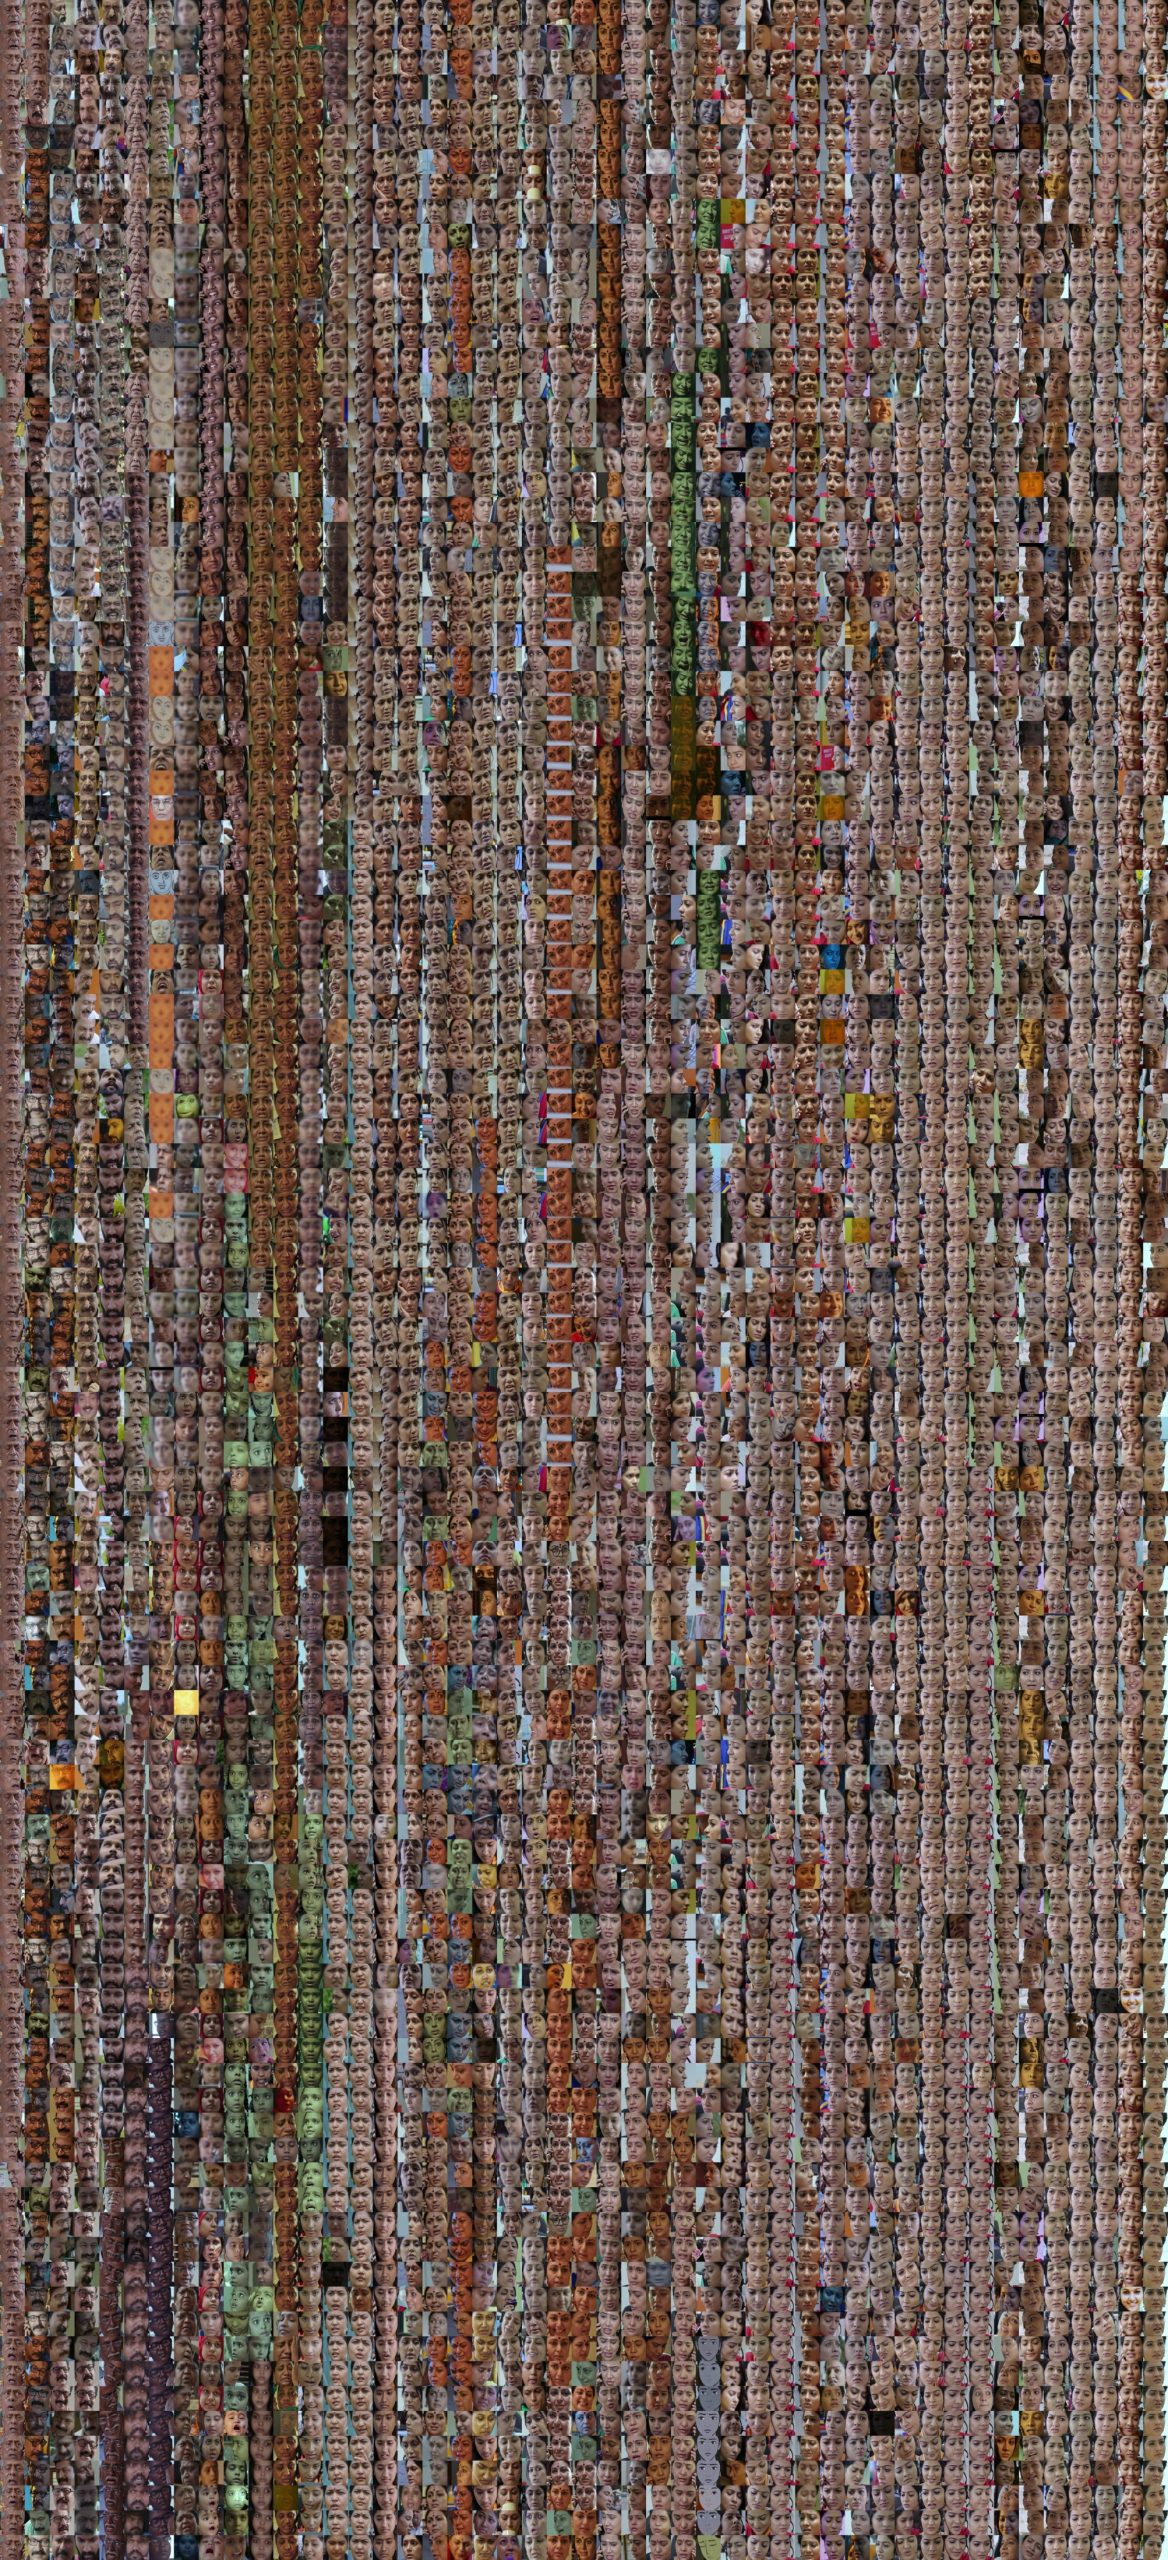
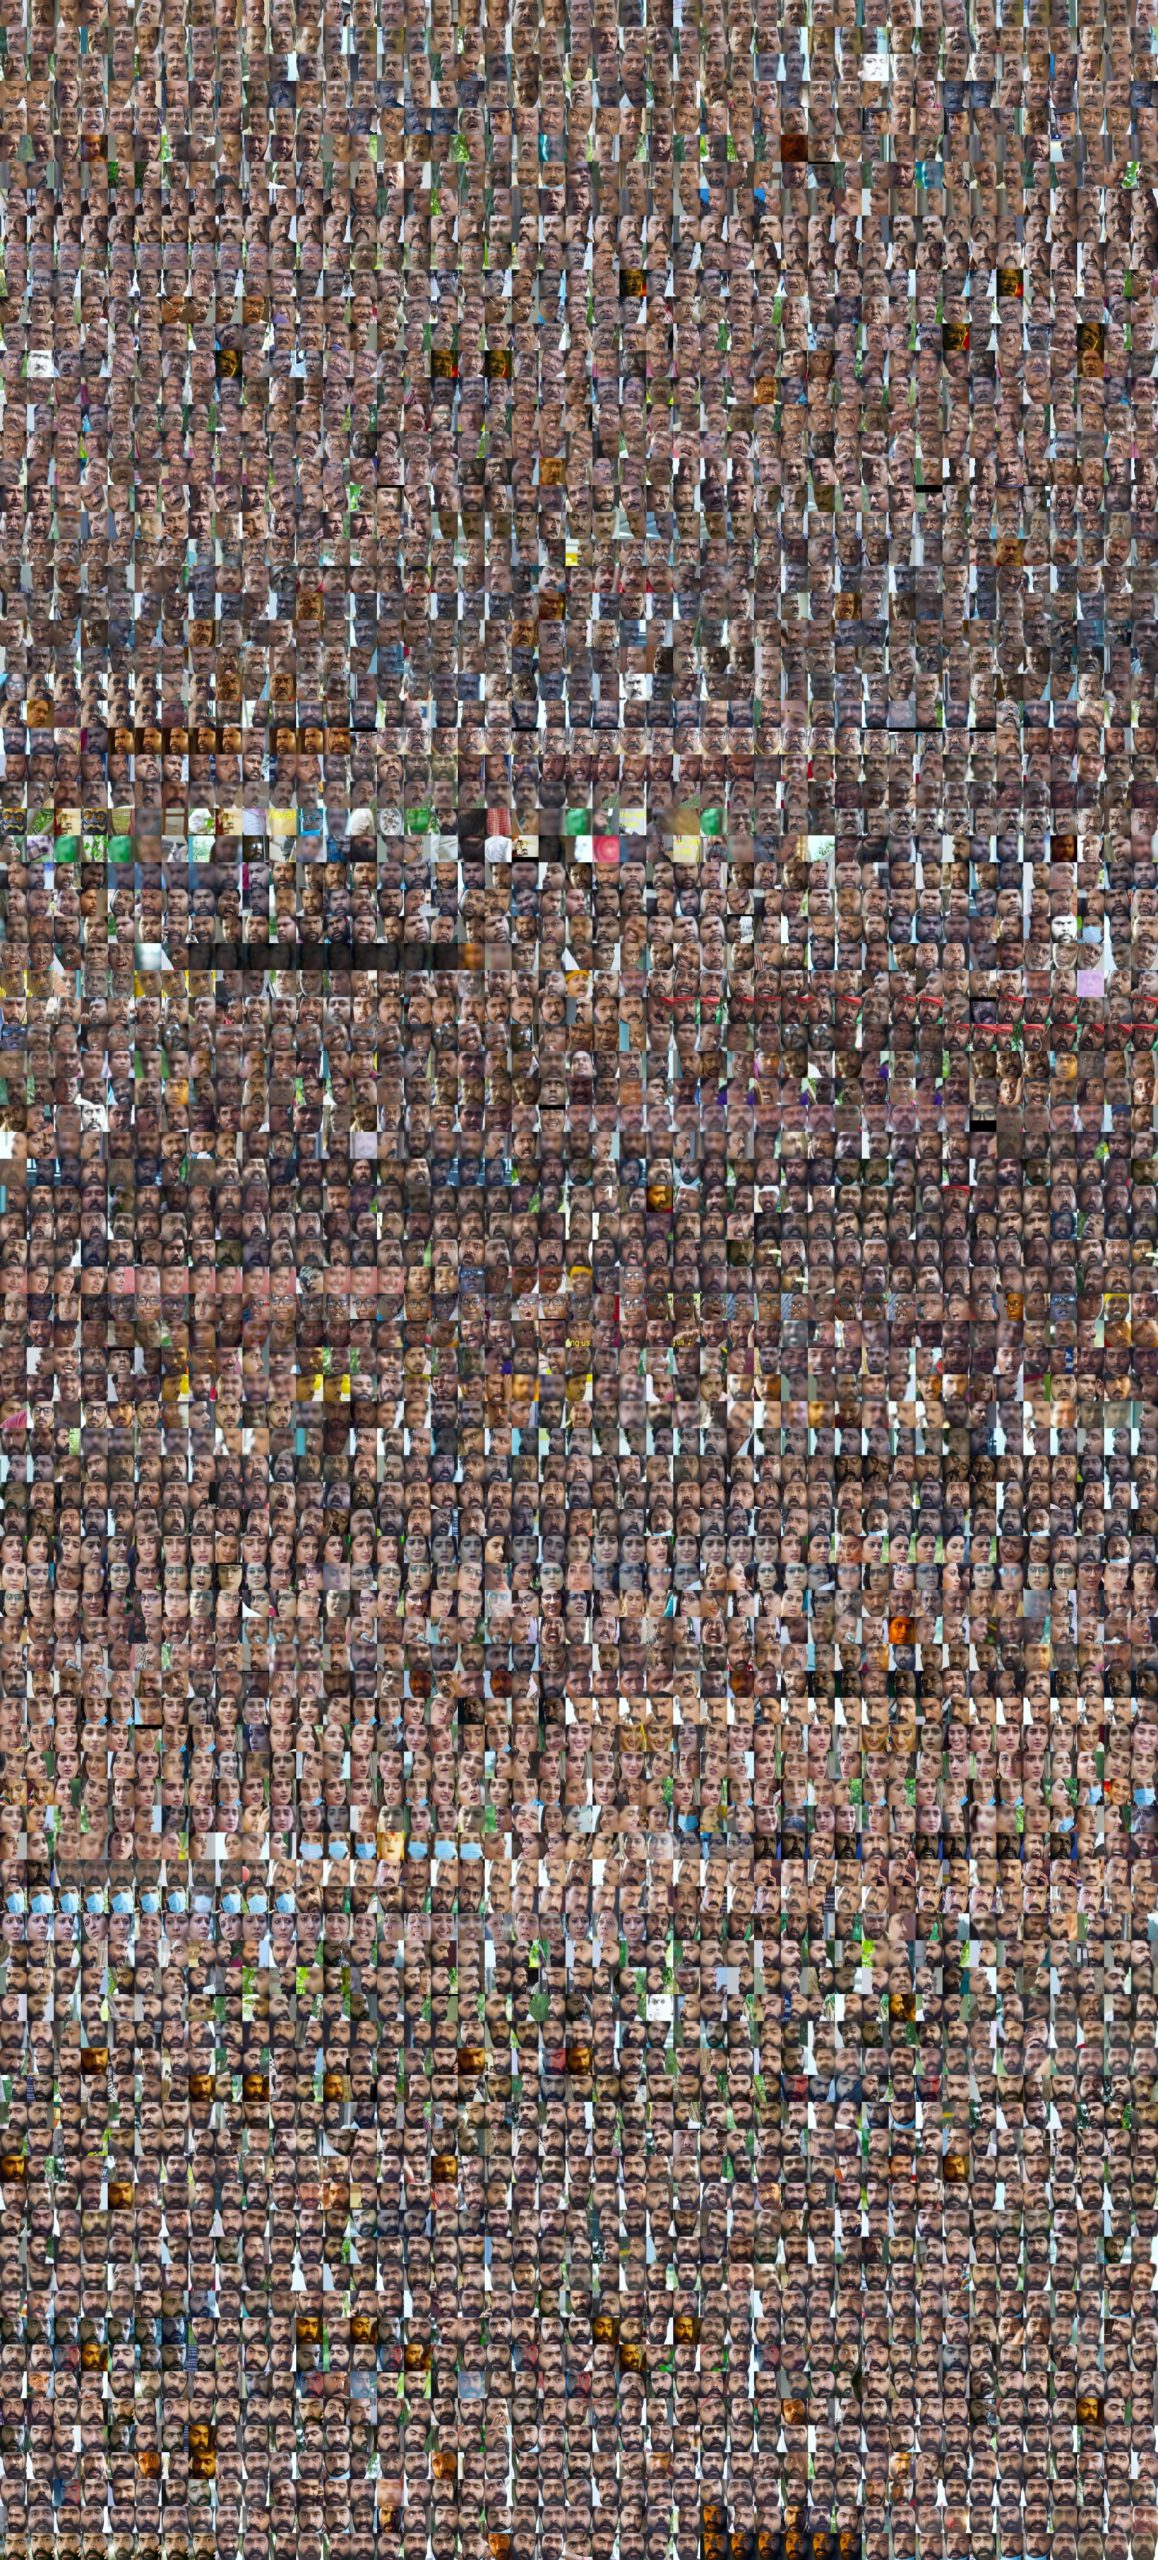
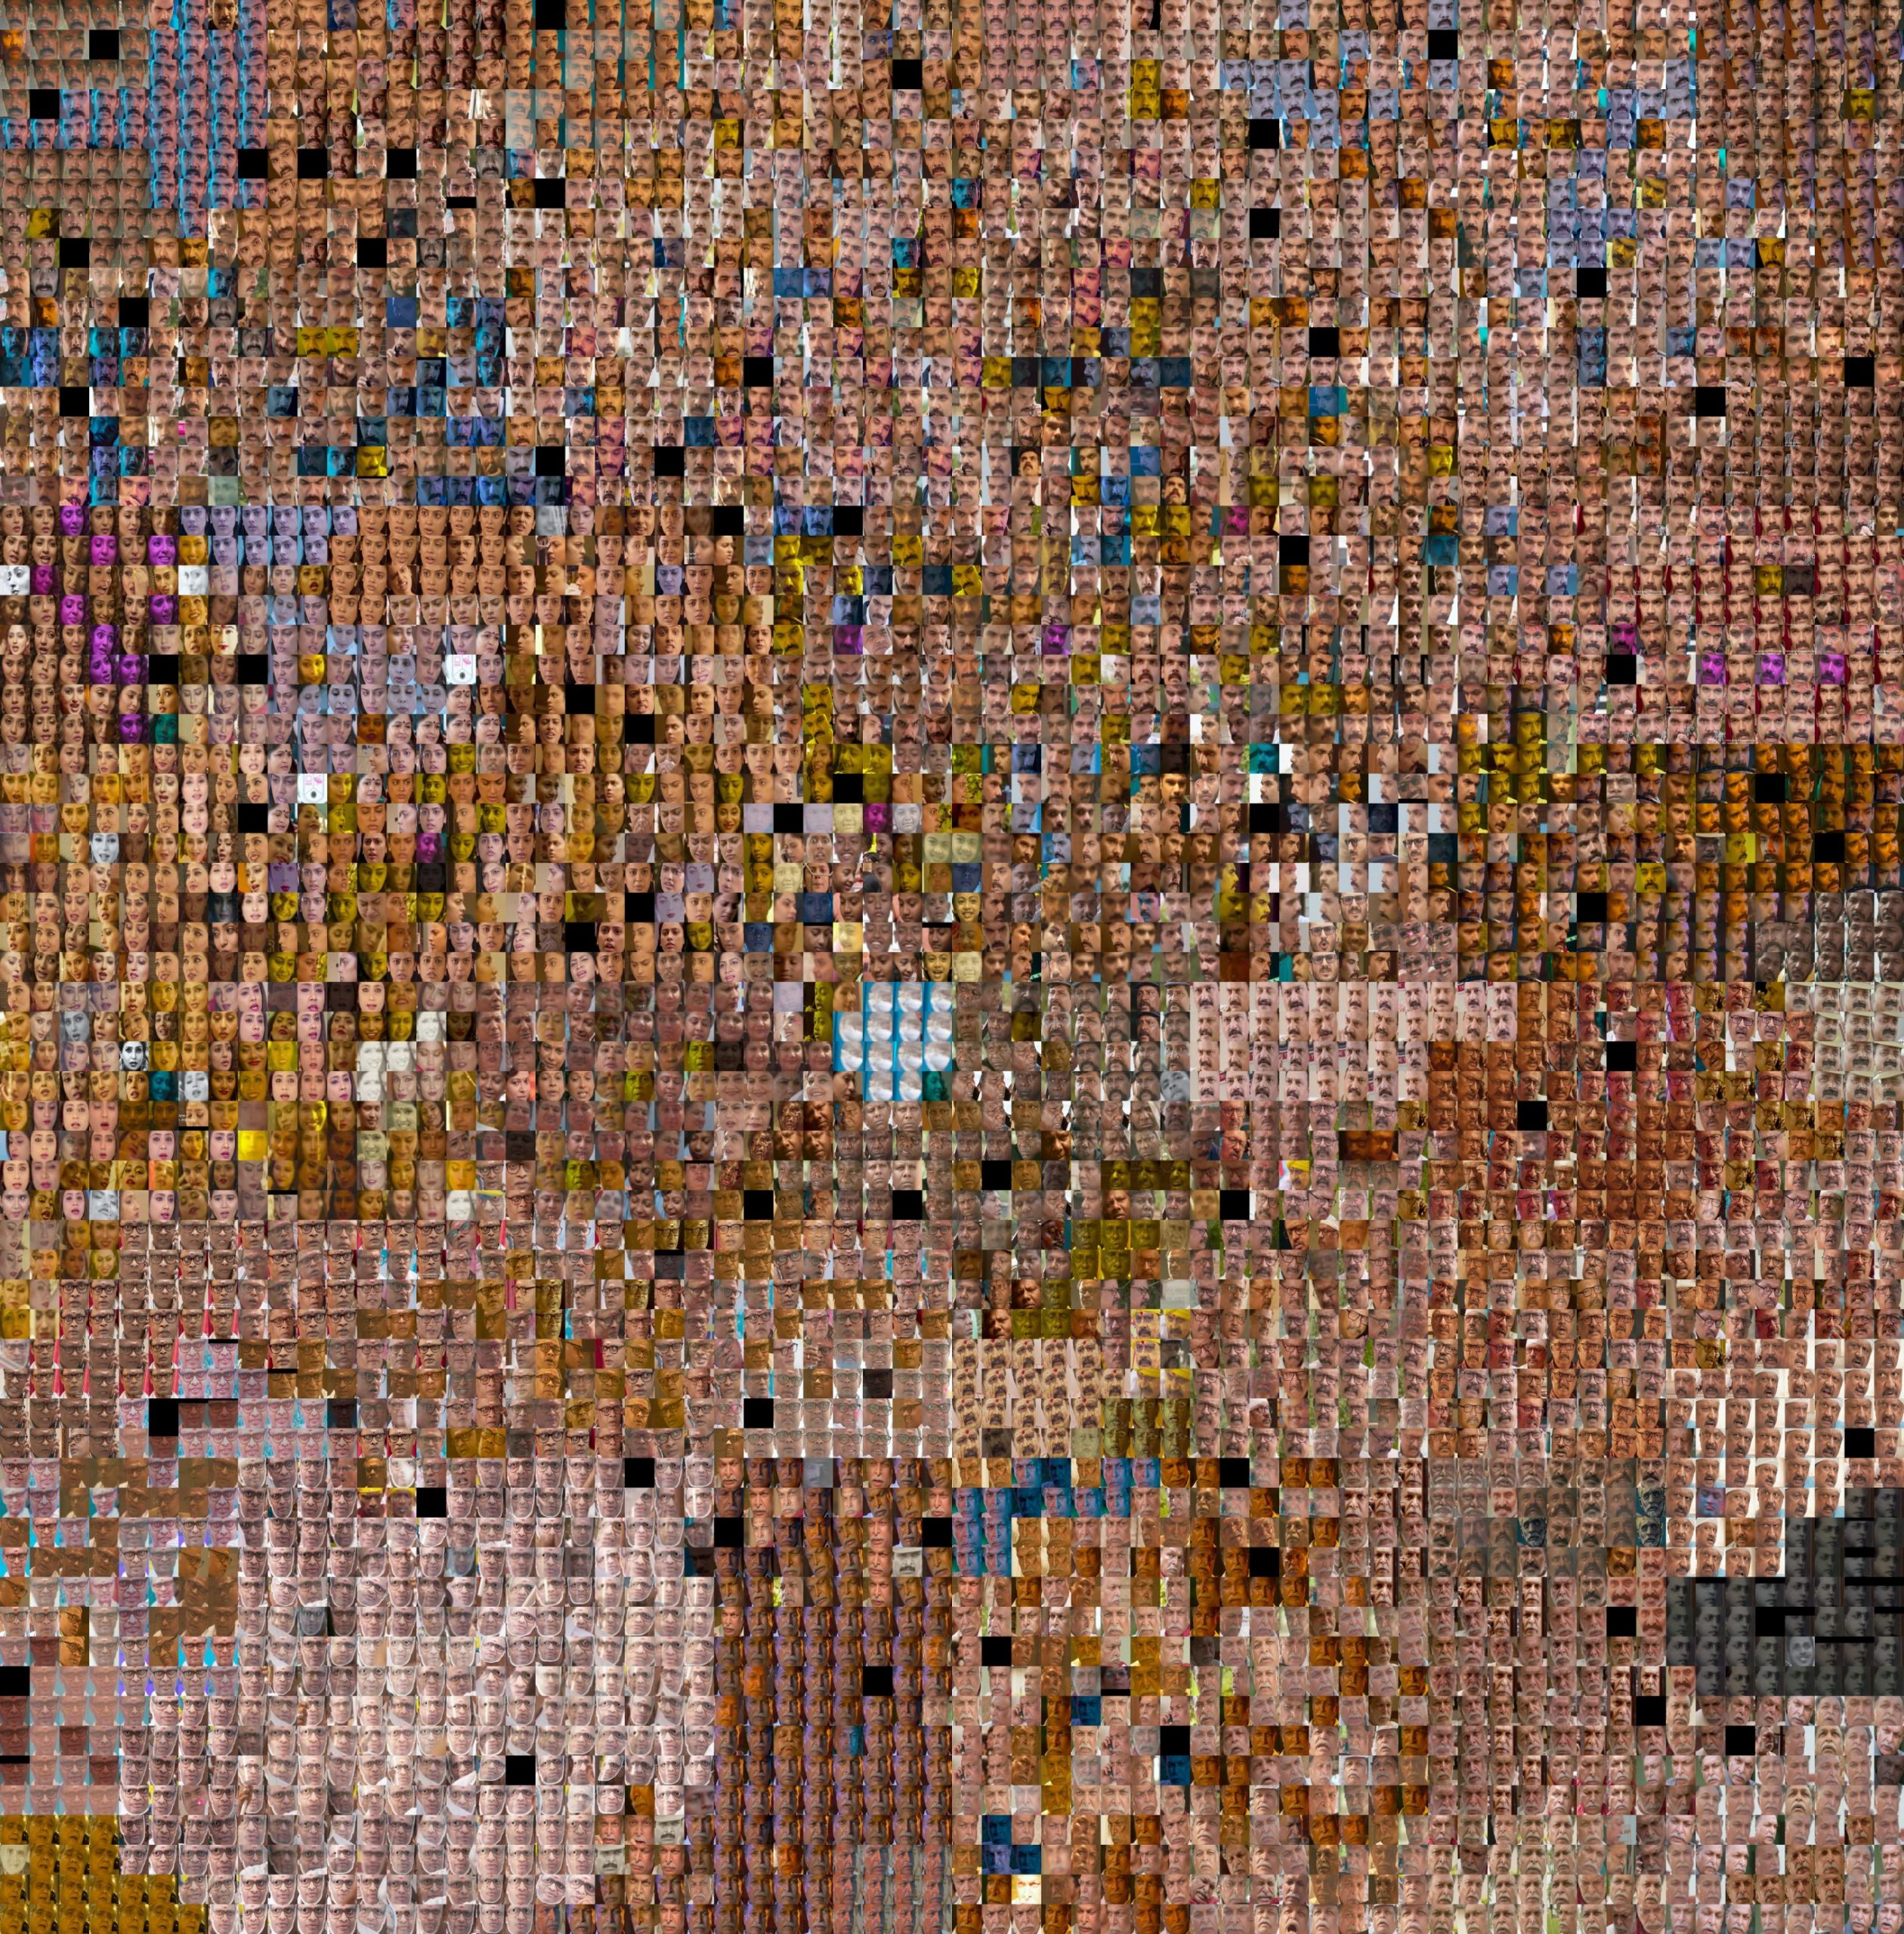
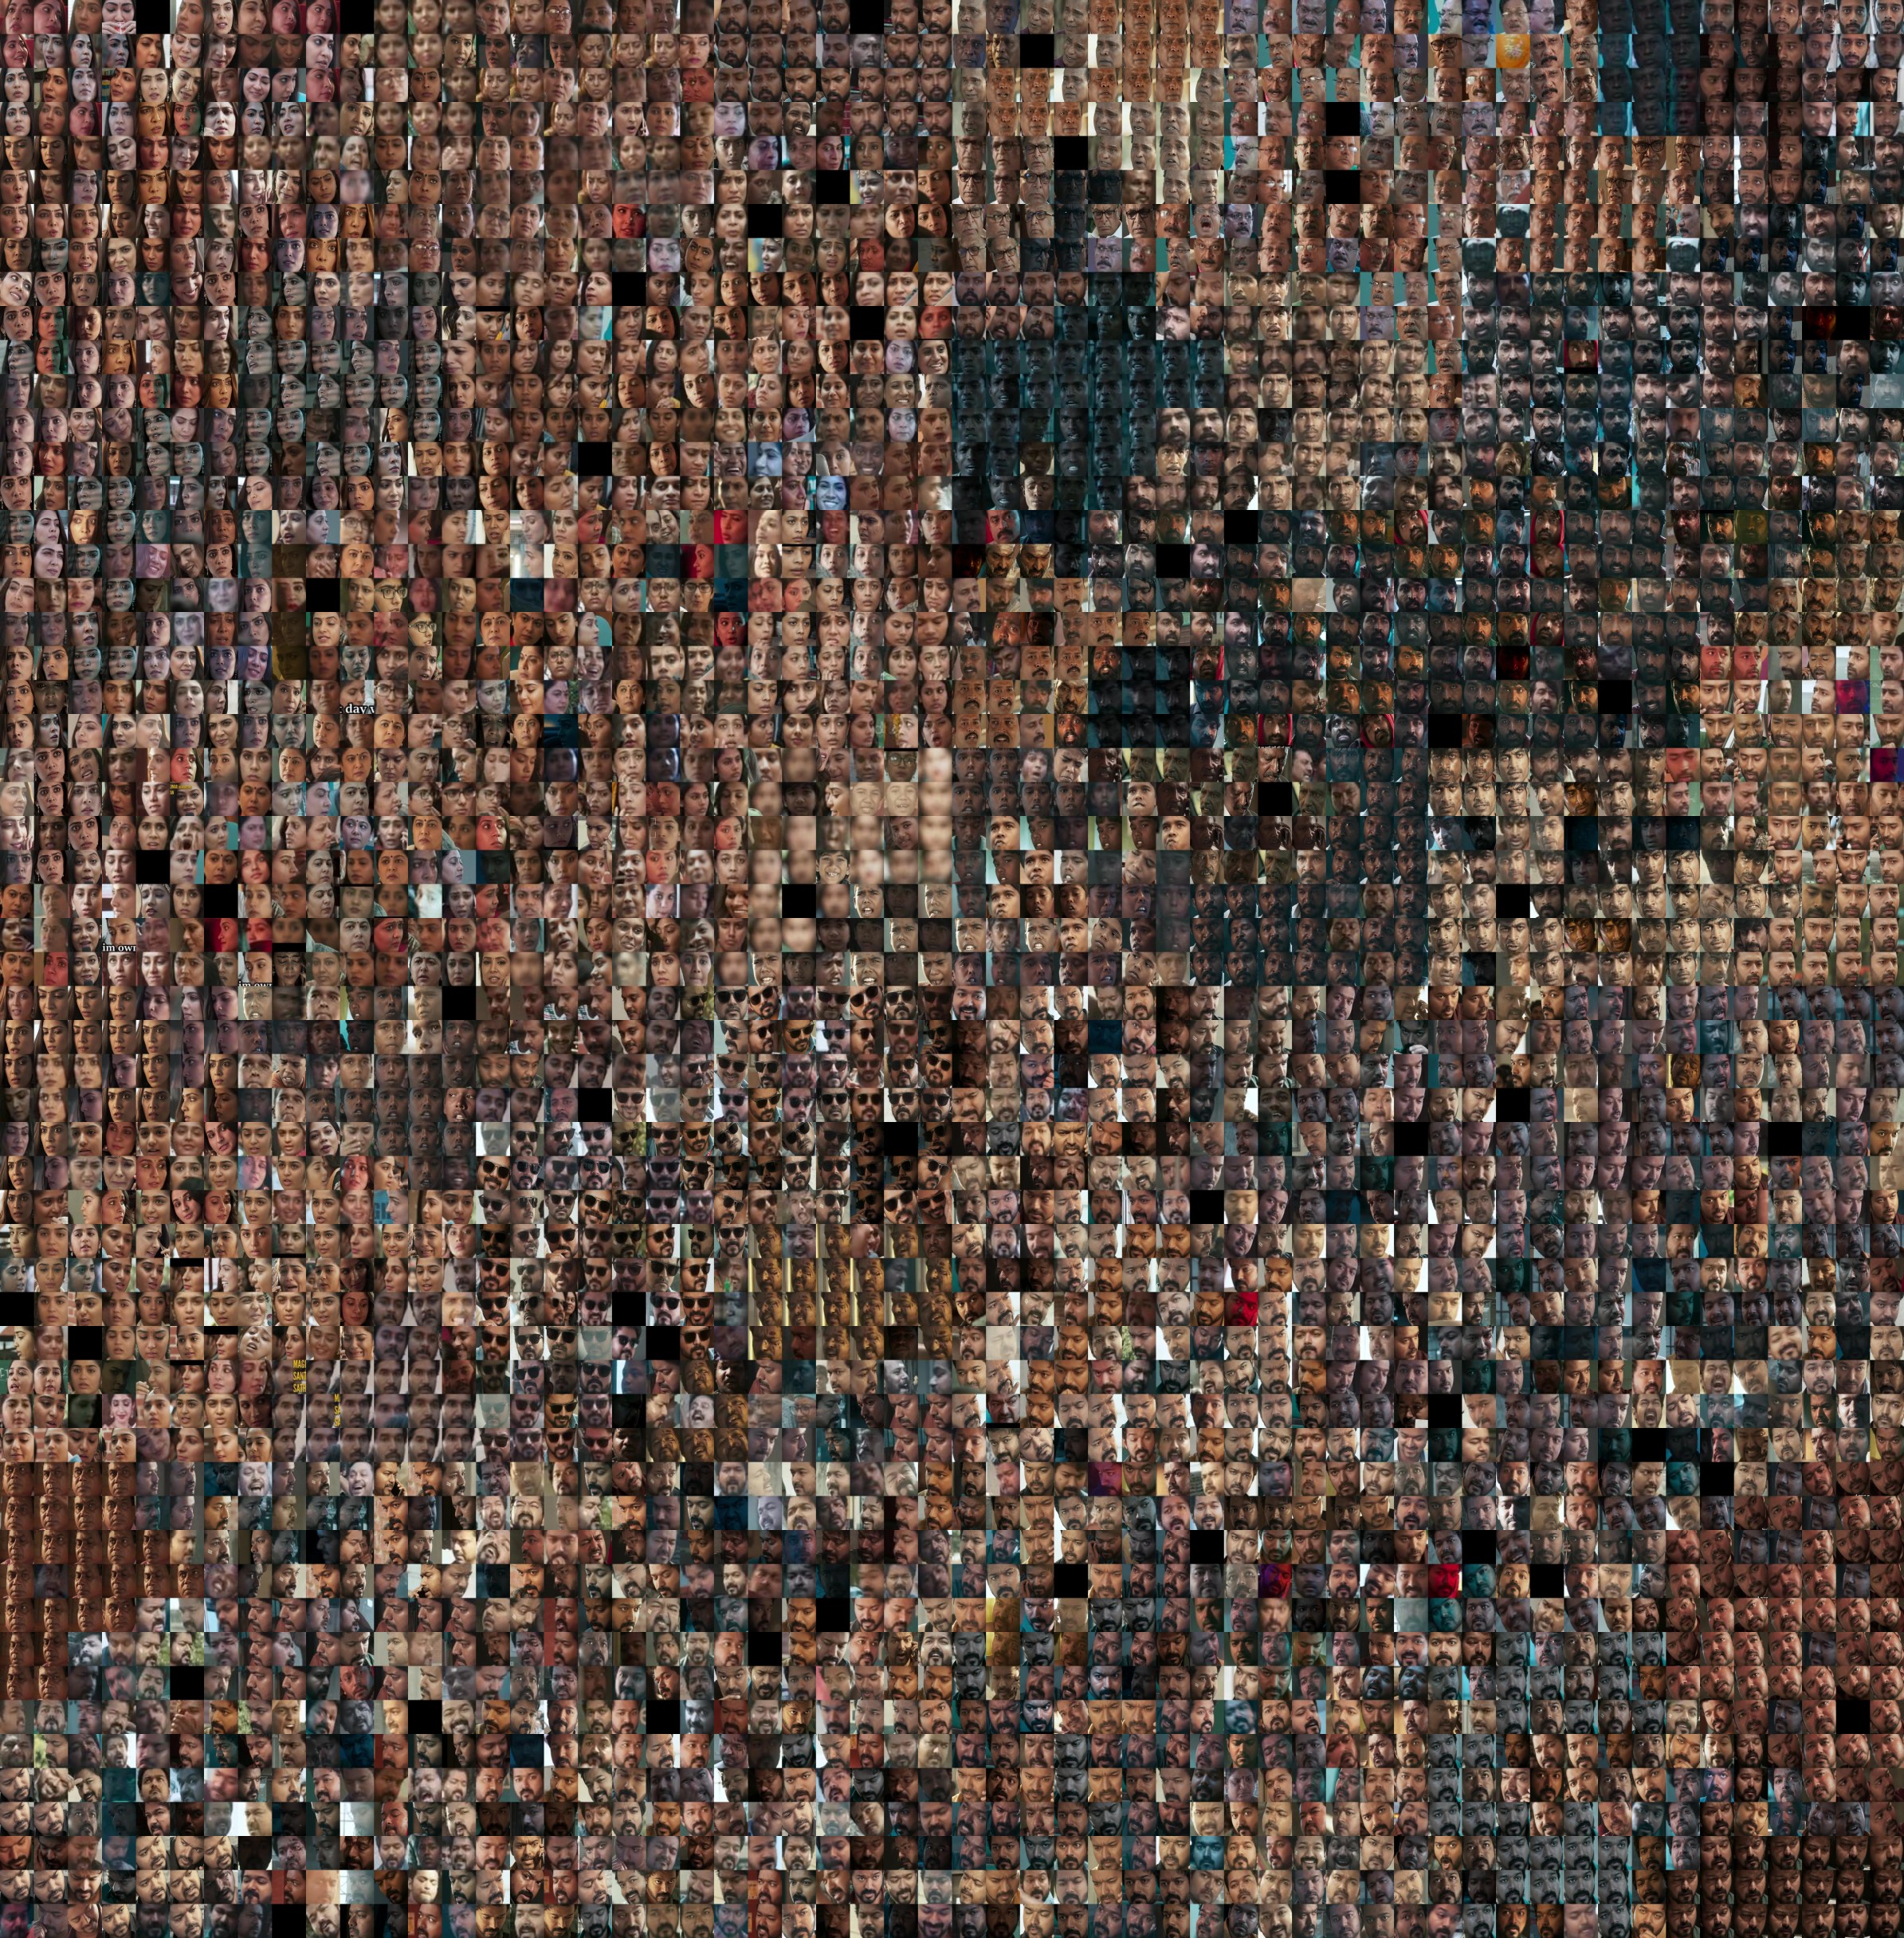
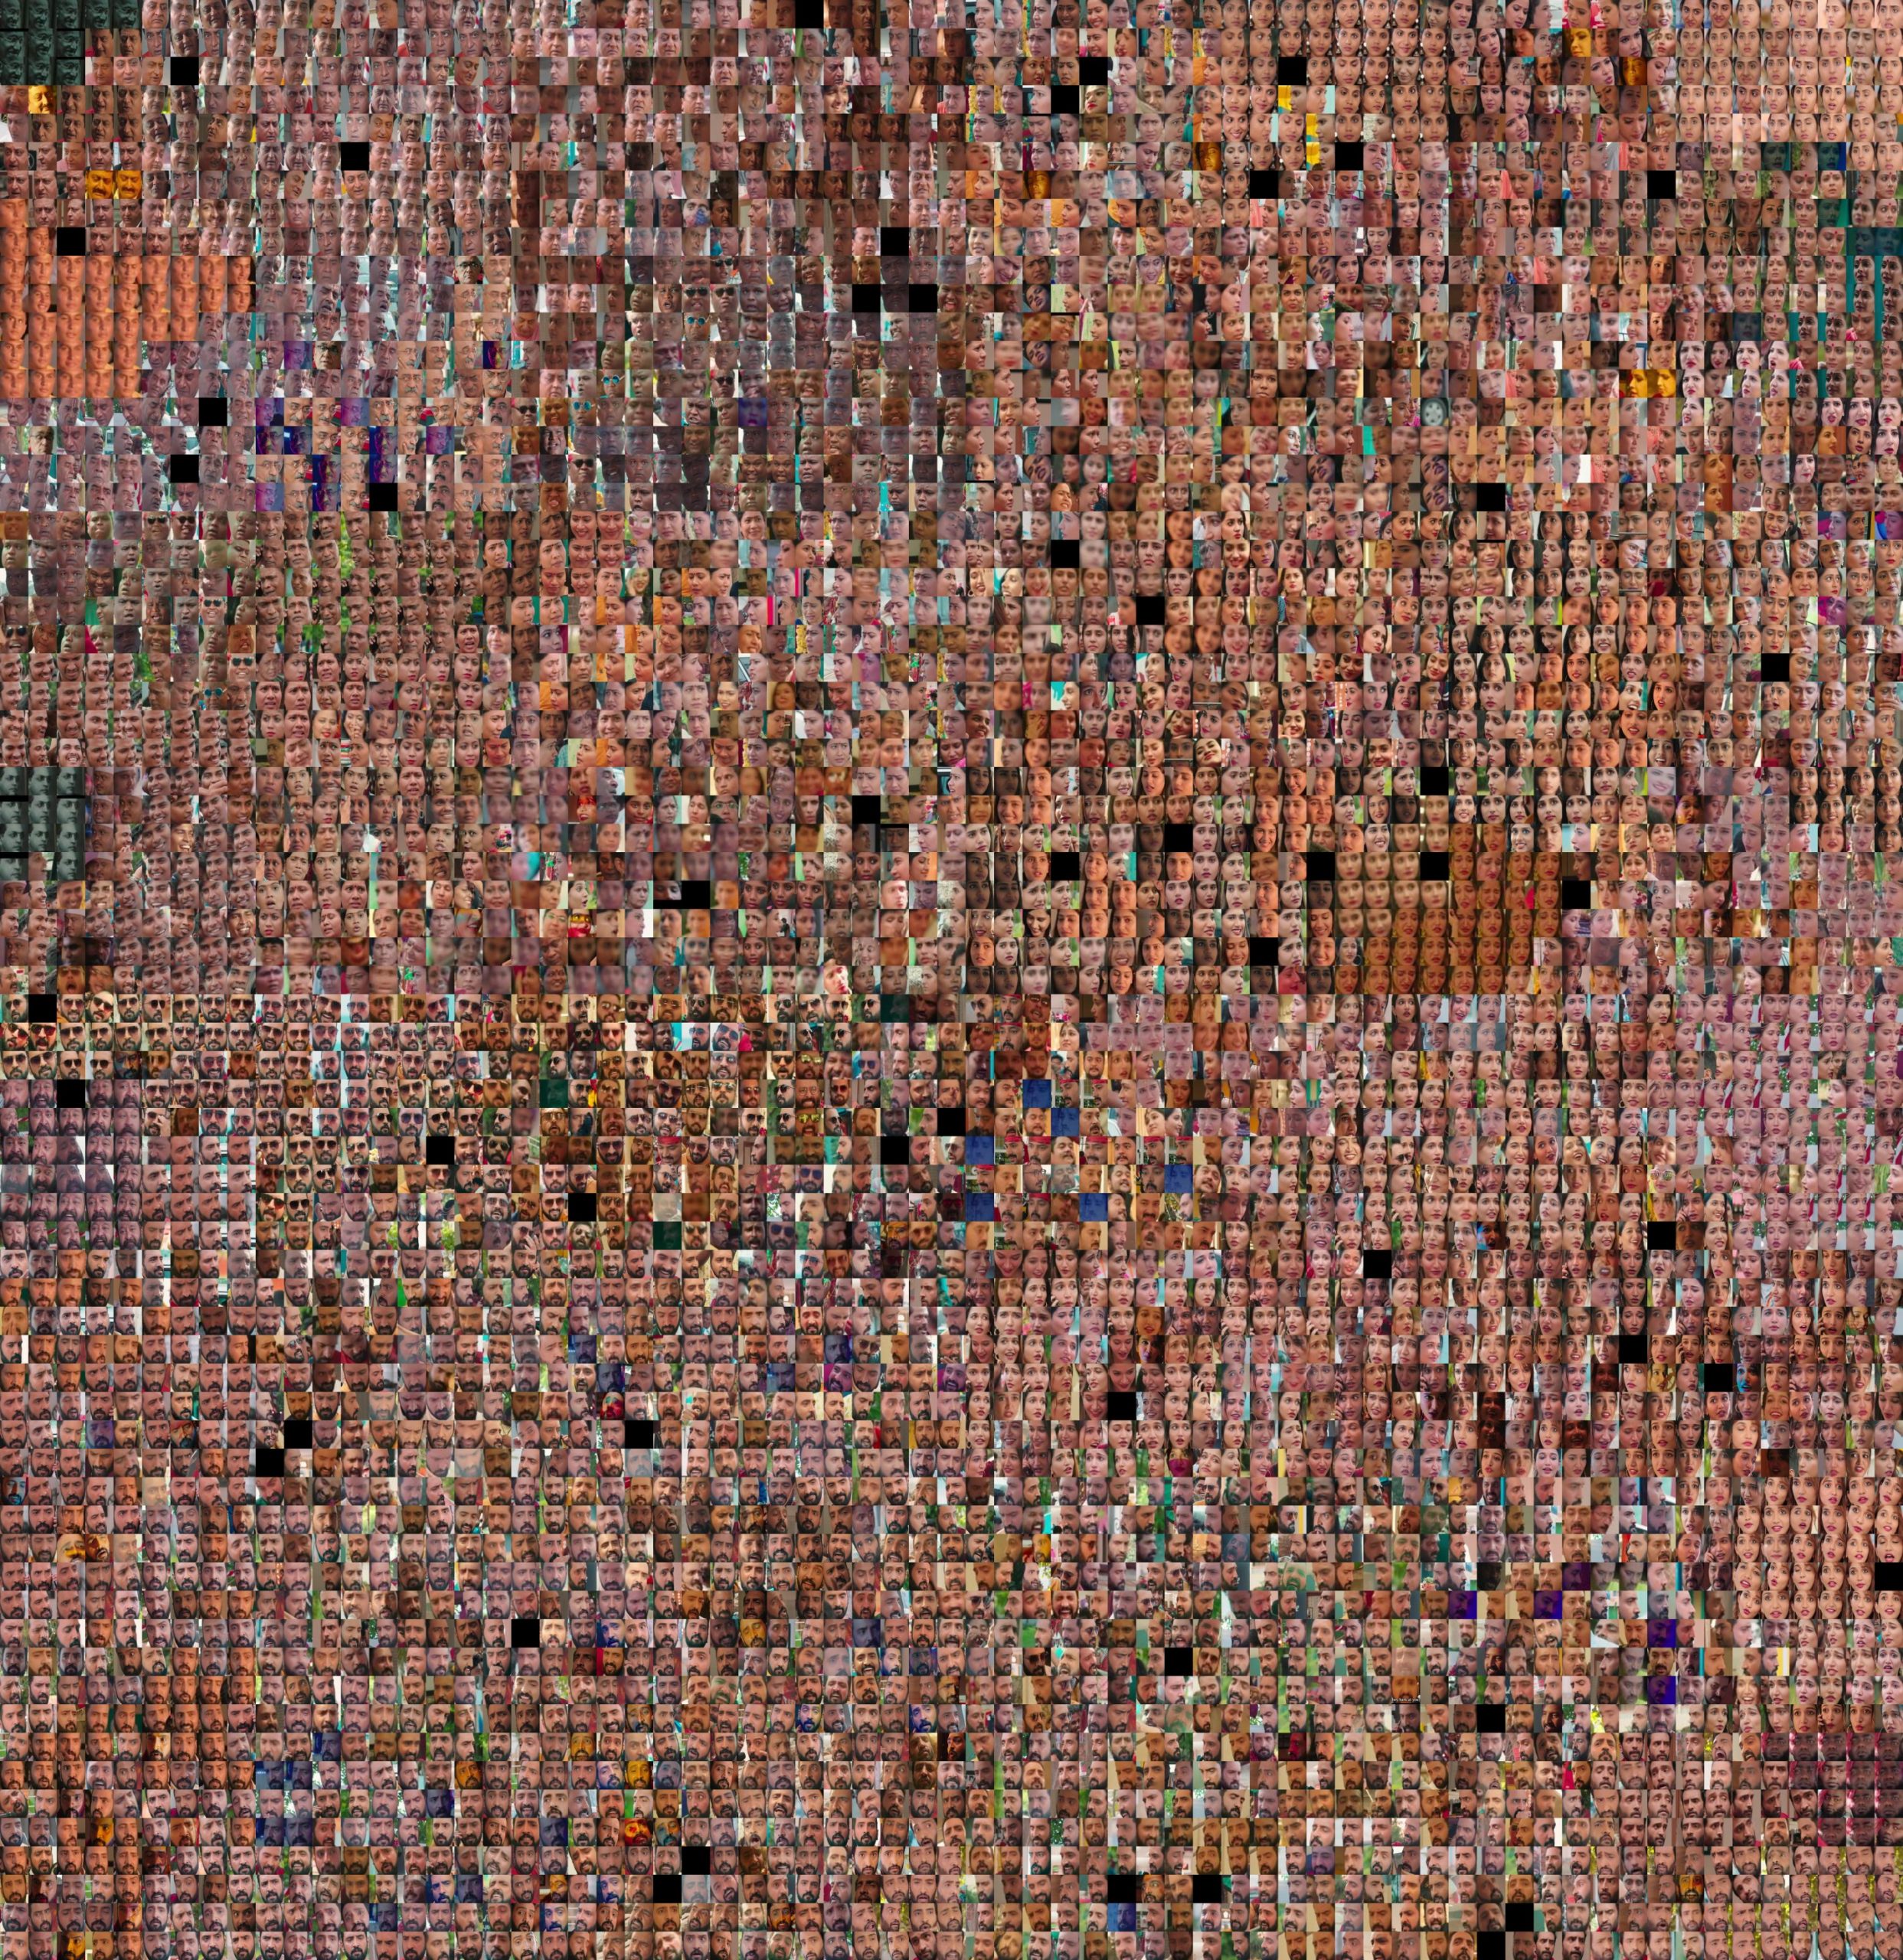
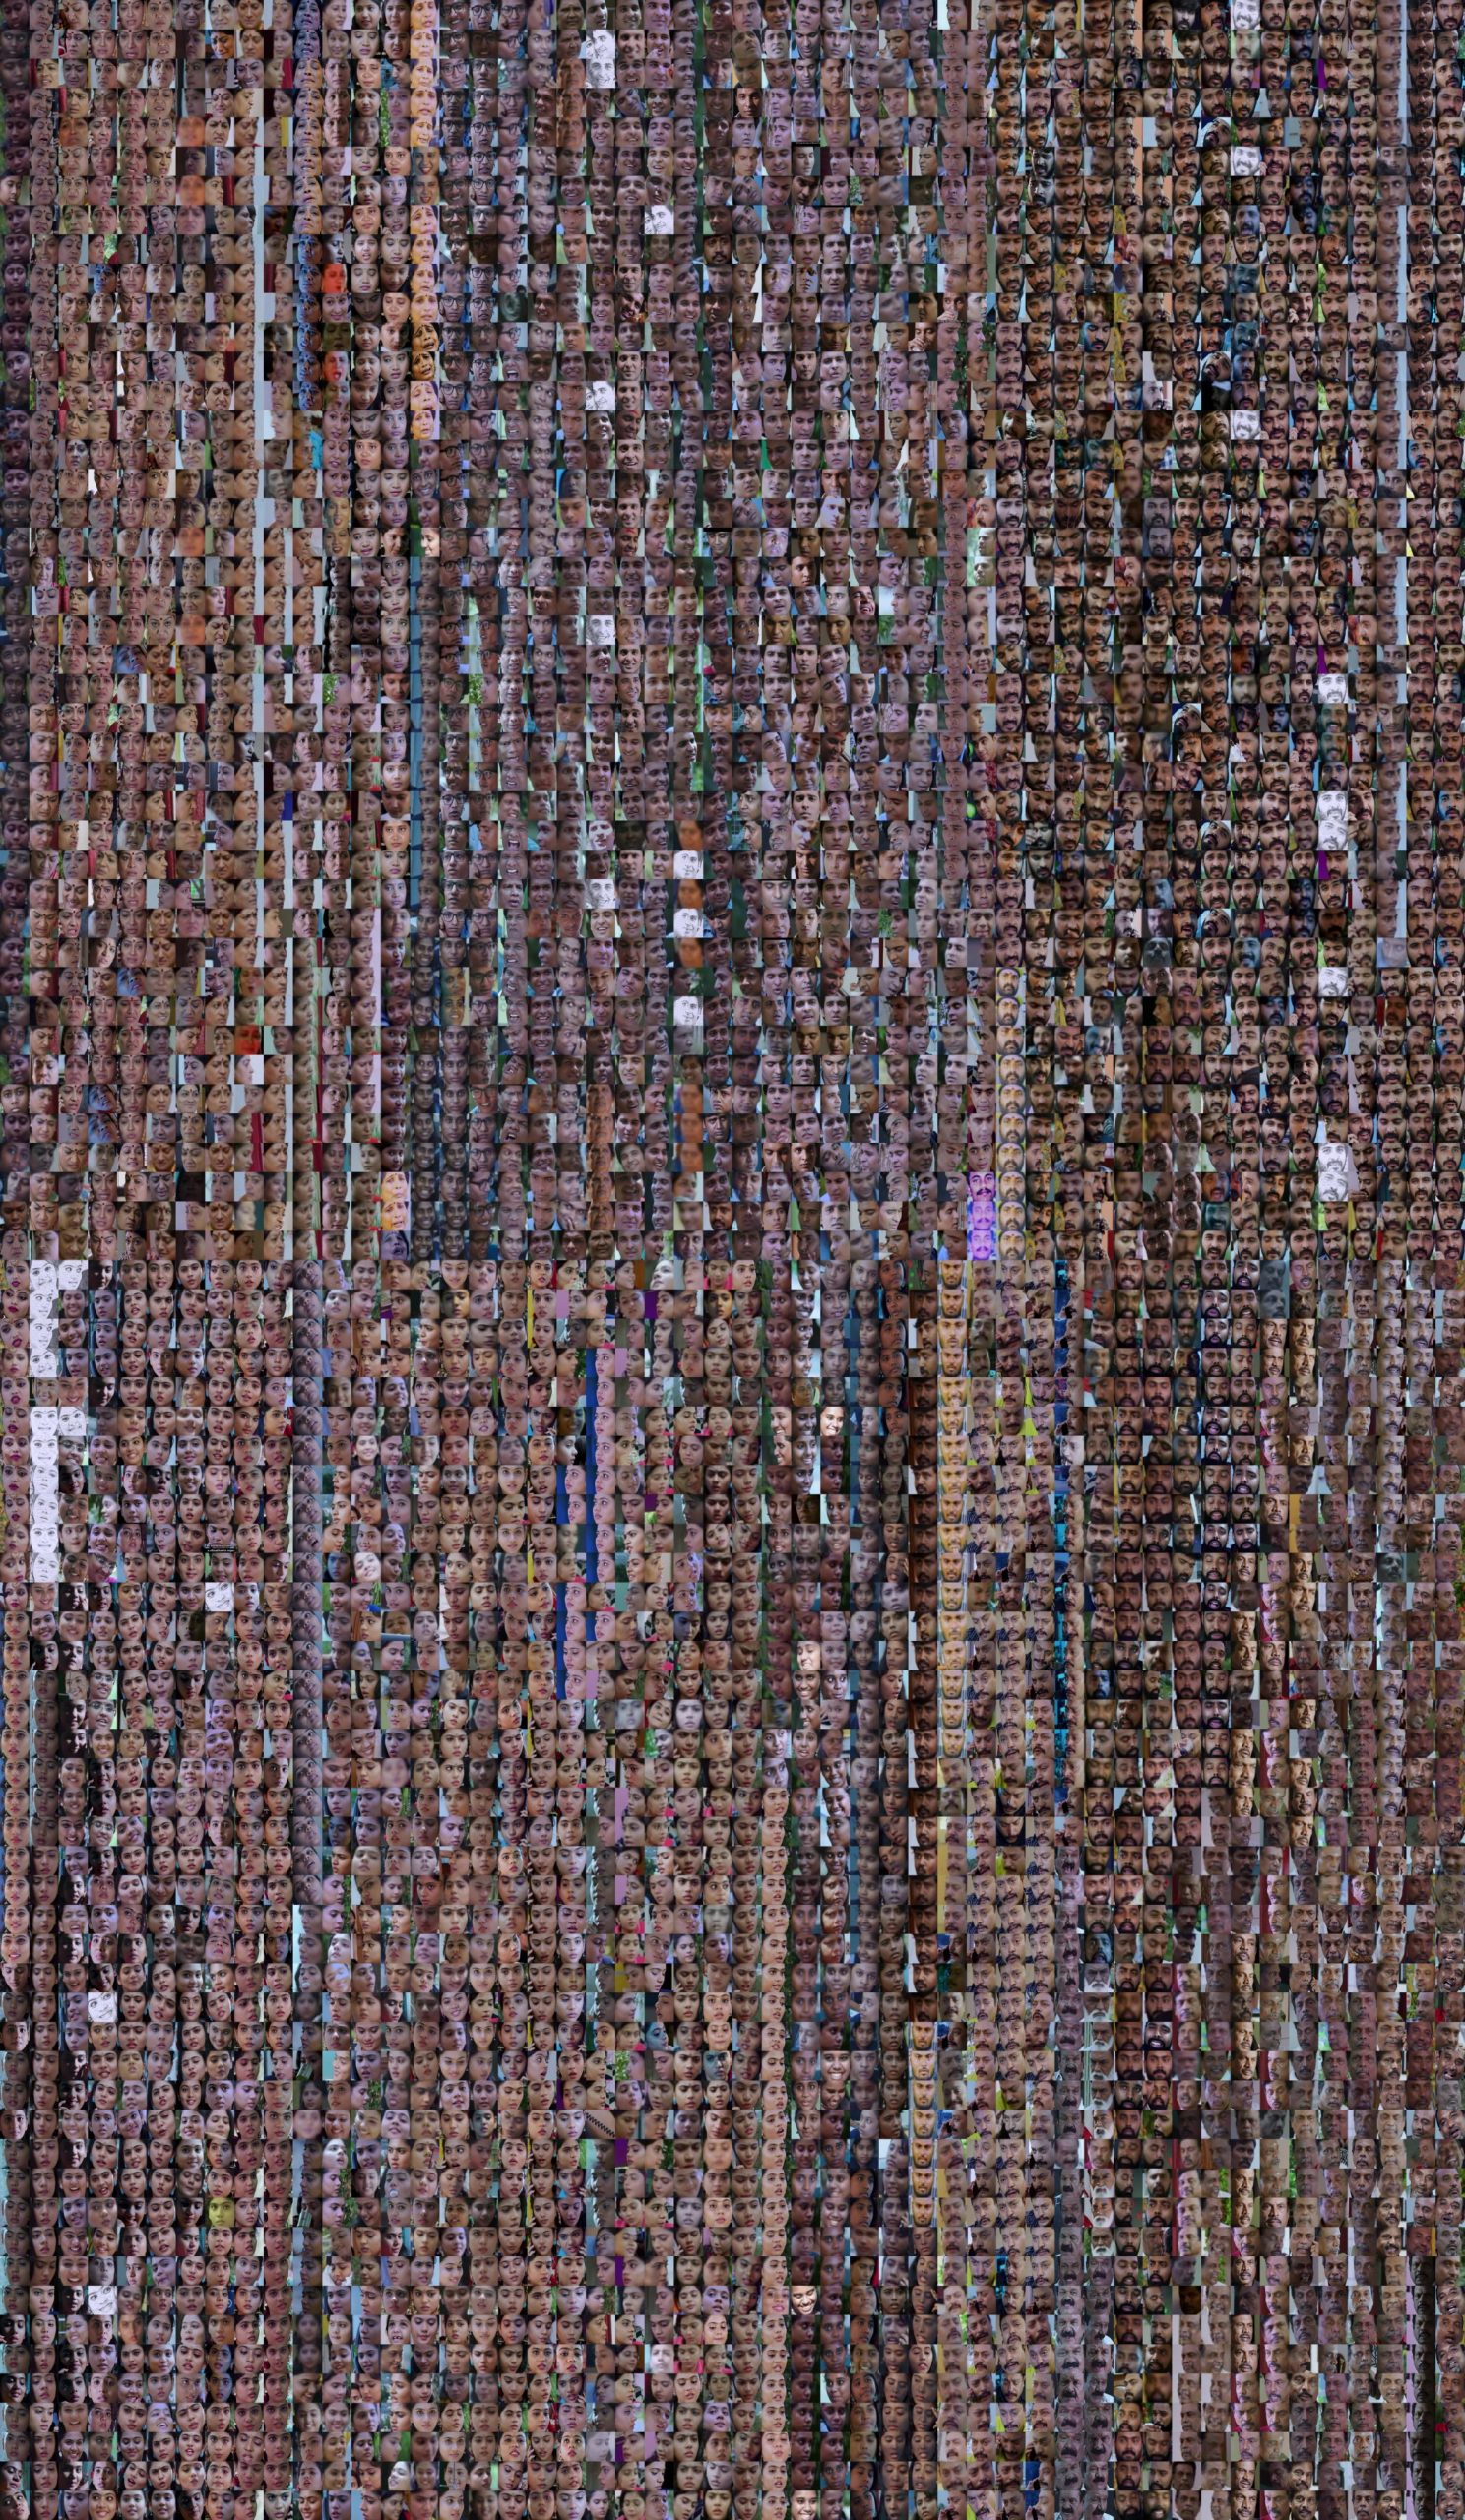
10/3: I’m updating this post as I get better visualizations of skintone. So I’ve included one mega image of all the people across multiple films organized by their average skin tone. Below that are the intermediate results of per movie images. In the Mega image I do see all the darker faces at the top are primarily the male lead while at the bottom they are primarily the female lead.
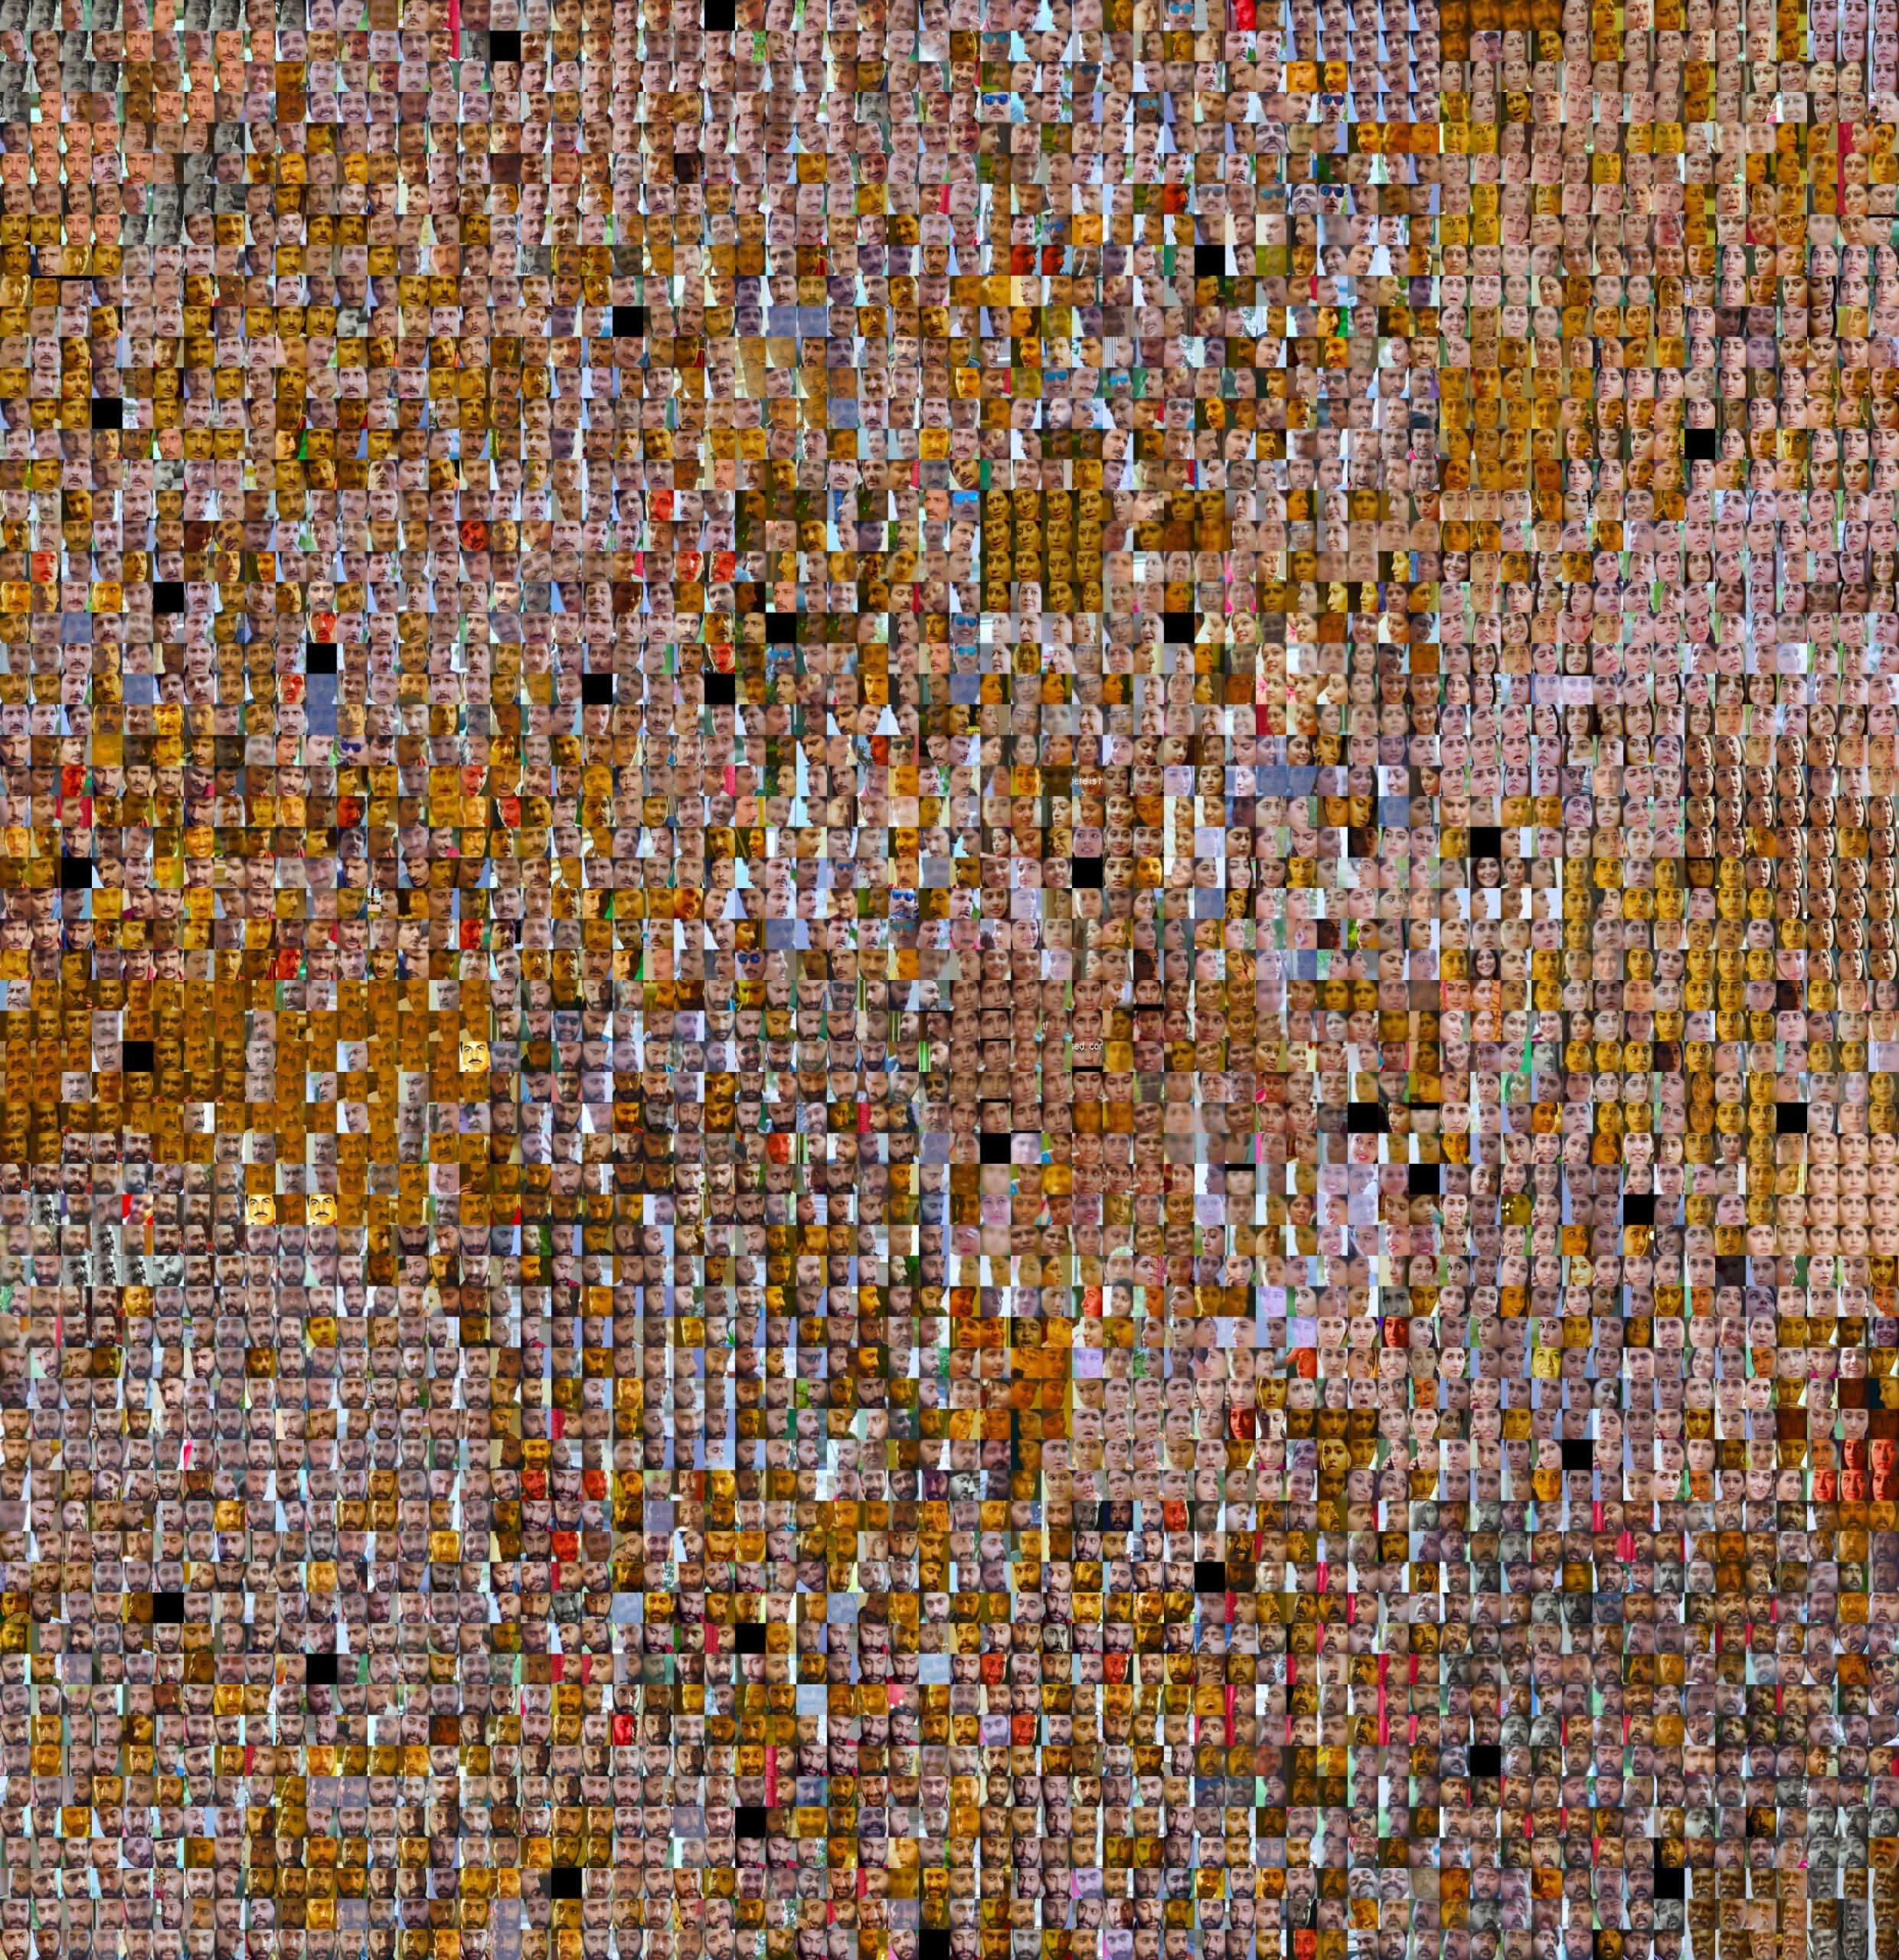
10/4: I’ve added “Better Mega Image” so please ignore “Mega Image”. I also included a video below that showing me scrolling top to bottom zoomed into the grid. I think it demonstrates some of the trends in gender and skin tone I wanted to show. I highly recommend watching the scrolling video to understand that I want the viewer to zoom in and traverse the landscape of the grid.
Mega image
Better Mega Image
Scrolling the Better Mega Image
Untitled (4)
Video Player is loading.
Current Time 0:00
/
Duration -:-
Loaded: 0%
0:00
Stream Type LIVE
Remaining Time --:-
1x
Chapters
descriptions off, selected
captions settings, opens captions settings dialog
captions off, selected
This is a modal window.
The media could not be loaded, either because the server or network failed or because the format is not supported.
Beginning of dialog window. Escape will cancel and close the window.
I think it’s interesting how dubious the scientific community was of photographs early on. Especially astronomers considering there was little venue for the general public to observe what they were seeing without a camera. There’s such a high overlap between the lens tech used for cameras and telescopes that I would think astronomers would be the most enthusiastic about using photographs. In some ways, the modern astronomer is also a photographer.
The practice of applying honey and sticky substances, having special development recipes, to old school plates breathes some artistry back into the medium. I’m too used to the click of a phone camera. I liked the photos of Venus and other planetary observations from multiple artists each using their own development recipe and photographic style. In some ways it more an objective documentation of each photographer’s quirks than an accurate record of planet.
I’m most excited about the use of the camera to scale time. Sped up videos of crowds, slowed down videos of objects crushed in a hydraulic press. It lets me experience different dimensions to a given object or experience. I also wrangle with its ability to warp distance and space. Whenever I pull out my iphone and the FOV, focal length, etc. make the camera different from what I see with my eyes it’s aggravating. I like that surprise especially when I use focal zoom on a camera and comb over the details in a scene.
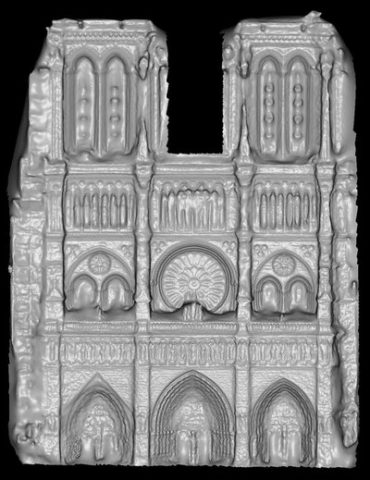
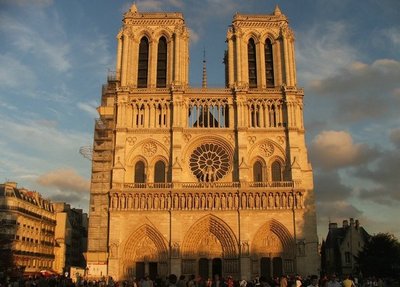
there are hundreds of thousands of tourist pictures of the notre dame. Each from a slightly different angle and location on the ground. CV experts at UW had the idea to use these free photos as photogrammetry inputs and estimate a 3d model of notre dame. This requires very intense knowledge of CV because each tourist photo needs to be mapped to a physical location around the building and then used to create a 3d model. This is like a much more complicated version of epipolar reconstruction. I think it’s interesting how this could be applied to virtually any location with enough footage or images. I took a class in cv, but I don’t really understand how enough 2d information can construct a 3d model with lots of math. Now that notre dame has burned down, processes like this allow retroactive 3d models of a a location that can no longer be captured.


 ‘
‘