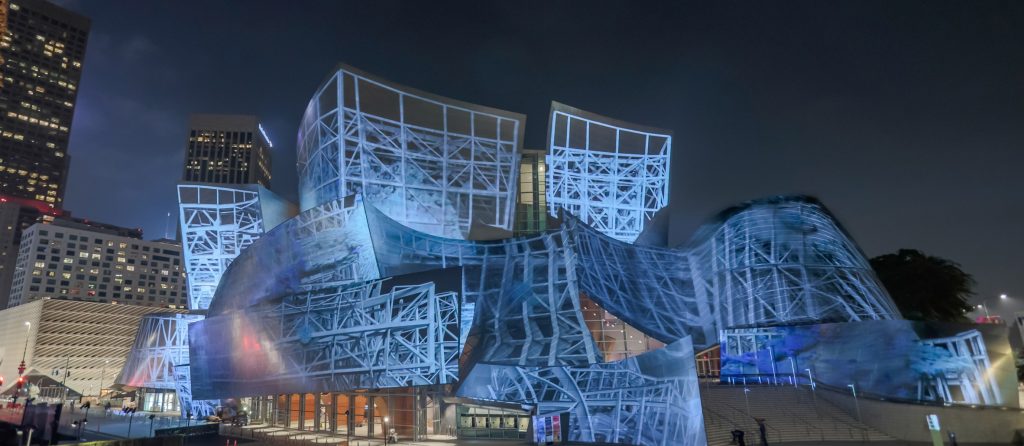
A Looking Outwards assignment that I found interesting was my classmate Taisei Manheim’s week 8 LookingOutwards post. I think this project, WDCH Dreams, that Tai has chosen is really interesting in that the data visualization was projected onto the facades of the Walt Disney Concert Hall. The displayed dataset was the 45 terabytes of data from the LA Phil data archives and through artificial intelligence algorithm, Refik Anadol utilized a computational ‘mind’ to mimic how humans dream – by processing memories to form a new combination of images and ideas.
Agreeing with Tai, this project truly shows really high levels of rigorous and endeavors as every detail of the Disney Concert Hall from old Catia models has been remodeled so that all the projection and data visualization will be smoothly and coherently mapped on the very irregular surfaces. As an architecture student, this project is really exciting to me in that it is fascinating to see a new layer of meaning and information on top of the original complex geometry. Through the use of light as an architectural median showing the memories that are associated with this concert hall, Refik Anadol has established a new sense of visual performance that has a hybrid relationship between architecture and media arts with machine intelligence.
Meejin Yoon is an architect and designer. She currently serves as the dean of the school of architecture at MIT. She got her bachelor of architecture education from Cornell and a master of architecture degree from Harvard GSD. She is truly a pioneer in designing interactive public space and she regarded her projects as bridges that engage technology in the public sphere. Her works that were presented in the talk really showed that she has successfully and effectively integrated technology to the architecture that aligns with the purpose and context of her projects.
One project that I really admired is MIT’s Collier Memorial. There are a number of concepts that are associated with this memorial. The form drew from MIT’s motto, “Mens et Manus,” Latin for “mind and hand.” Five radial stone walls form the hand’s fingers connecting by a vault; the palm and the open hand represent Collier’s spirit of helpfulness, and the space under the vault represented his absence. She successfully synthesized some really meaningful memories aligning with the core values of MIT and finally produced an elegant and beautiful memorial.
Eyeo 2015 – Meejin YoonHöweler + Yoon Architecture, Collier Memorial
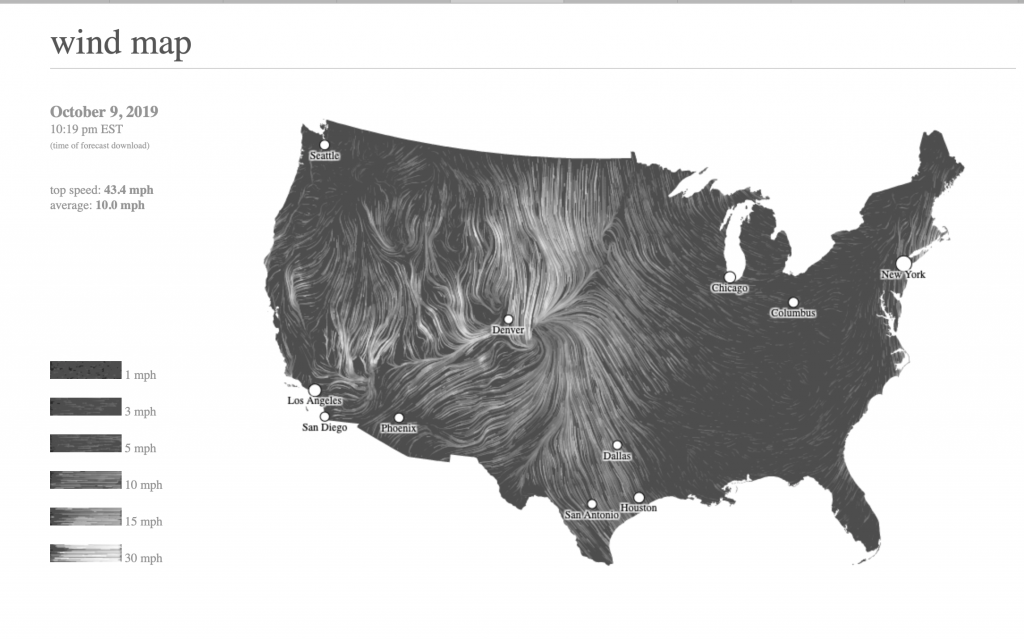
wind map simulation from http://hint.fm/wind/ created by Wattenberg and Viegas
This map shows the delicate tracery of wind flowing over the US. From this data visualization, there are a number of information that have been weaved together to show the flow of wind in a visually aesthetic way. From the map, we can understand the directionality, speed, as well as the top and average speed. As indicated in the website, the wind map website has used National Digital Forecast Database. These are near-term forecasts, revised once per hour. So the map is a live portray of the wind current condition over us.
This is a really interesting project to me as it gives a strong and dynamic visualization of how the wind moves and from the map so that we can potentially assume how the wind might have responded to the particular terrain and topology condition of US. Also for natural disaster such as hurricanes, the map would indicates the progress of a natural disaster and serving as a educational tool for viewers.
//Fanjie Jin
//Section C
//fjin@andrew.cmu.edu
//Project 7

function setup(){
    createCanvas(480, 480);
//set a initial start x and y value
    mouseX = 100;
    mouseY = 100;
}

function draw(){
    background(100);
    push();
//tranlate geometry to the center of the canvas
    translate(240, 240);
//constrain the mouse x value
    var x = constrain(mouseX, 5, 480);
//constrain the mouse y value
    var z0 = constrain(mouseY, 0, 240);
//constrain the mouse y value
    var z1 = constrain(mouseY, 0, 240);
//constrain the mouse y value
    var z2 = constrain(mouseY, 0, 360);

//remap the value of mouse X
    var a = map(x, 0, 480, 0, 200);
//remap the value of mouse X
    var b = map(x, 0, 480, 60, 60);
//remap the value of mouse X
    var c = map(x, 0, 480, 0, 100);

    noFill();
    beginShape();
//inside circle size variable
//Hypotrochoid Variation 1
    for (var i = 0; i < 120; i++) {
//defining the positions of points
//parametric eq1
        x1 = (b - a) * sin(i) + z0 * sin((b - a) * i);
//parametric eq2
        y1 = (b - a) * cos(i) - z0 * cos((b - a) * i);
//color variation
        stroke(b * 2, a * 3, a + b);
        vertex(x1, y1);
    };
    endShape();
//Hypotrochoid Variation 2
    noFill();
    beginShape();
    for (var i = 0; i < 120; i++) {
//parametric eq3
        x2 = (b - a) * cos(i) + z1 * cos((c - a) * i);
//parametric eq4
        y2 = (b - a) * sin(i) - z1 * sin((c - a) * i);
        stroke(b , c, a + b);
        vertex(x2, y2);
    };
    endShape();
//Hypotrochoid Variation 3
    noFill();
    beginShape();
    for (var i = 0; i < 120; i++) {
//parametric eq5
        x3 = (b - a) * sin(i) + z2 * sin((a - c) * i);
//parametric eq6
        y3 = (b - a) * cos(i) - z2 * cos((a - c) * i);
        stroke(a , c, b);
        vertex(x3, y3);
    };
    endShape();
    pop();
}
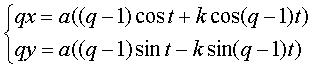
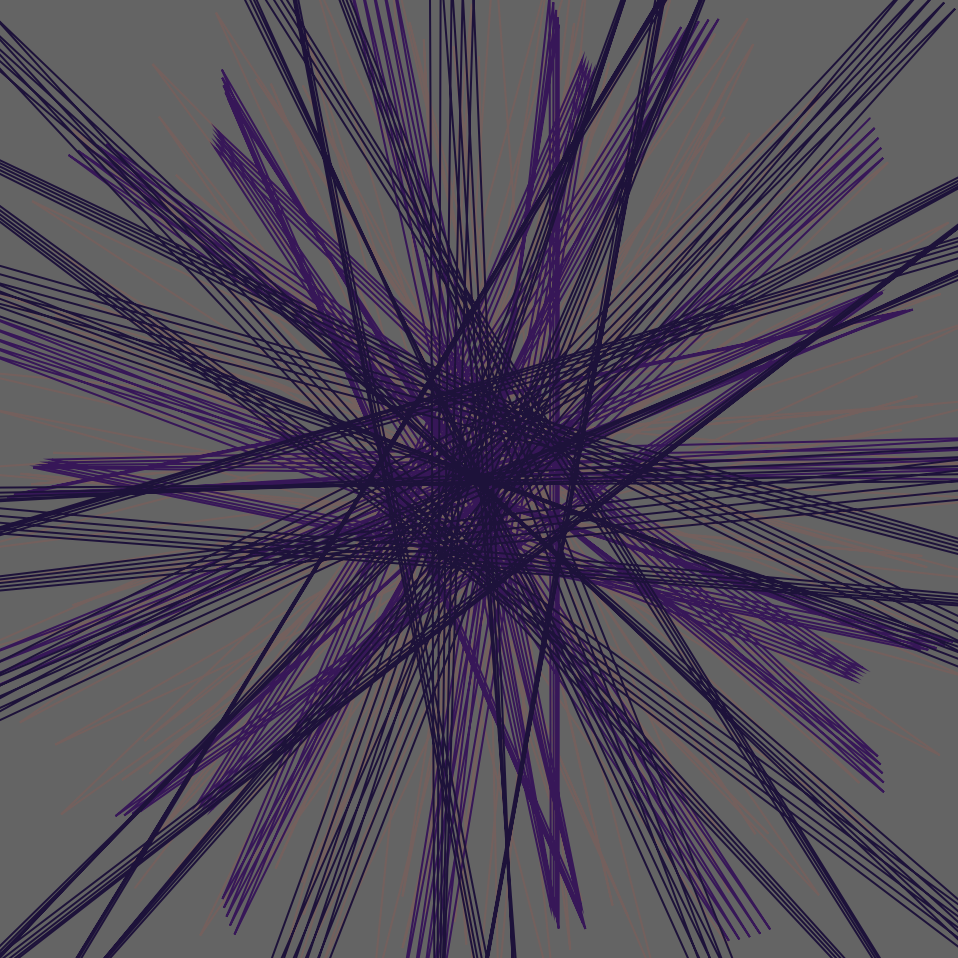
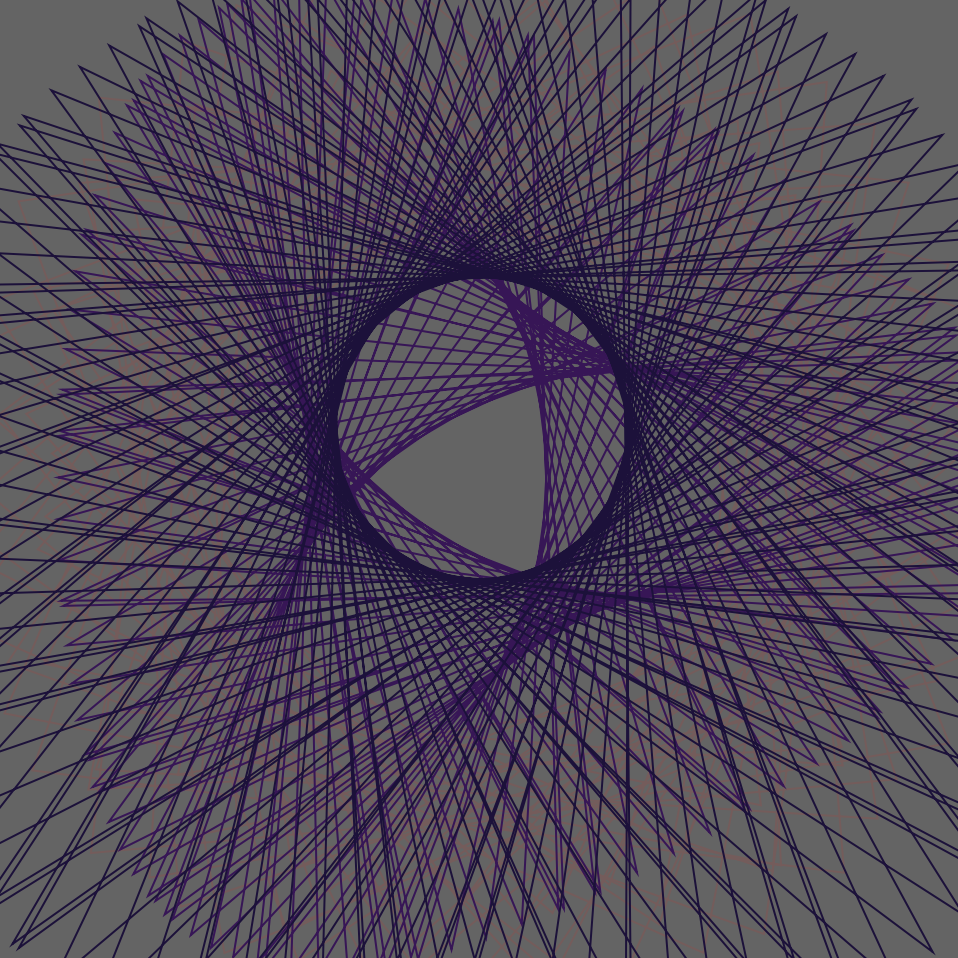
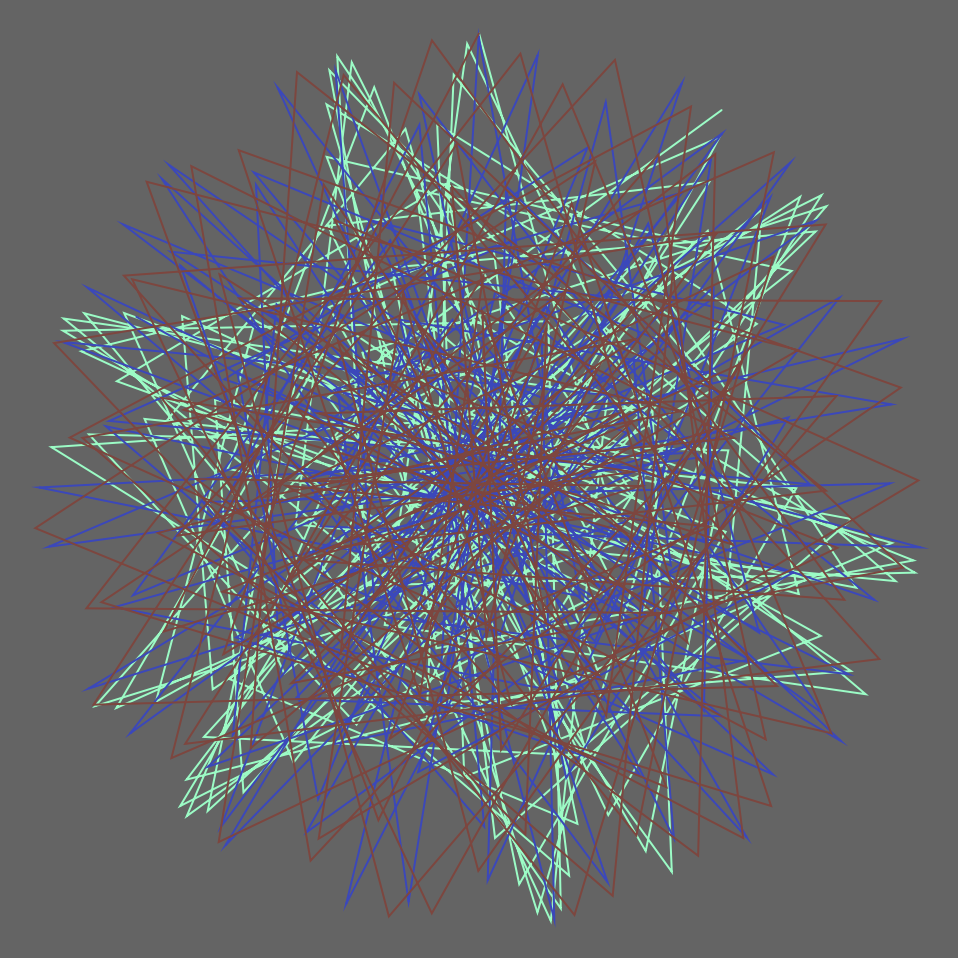
In this project, I have tried to use the equation for Hypotrochoid to generate some mathematically interesting compositions. The equation express is above; however, I have simplified and add another parameter to the equation so that more parametric shapes would be generated. I really enjoyed this project as I think it is really great to learn how to actually use these mathematical to generate patterns and sometimes when you move the mouse a tiny bit, the entire composition will be drastically changed. In this project, there are three rings and each of them has a different equation and they would move simultaneously once the mouse position is changed.
x = 240 , y = 120x = 200 , y = 160x = 100 , y = 360
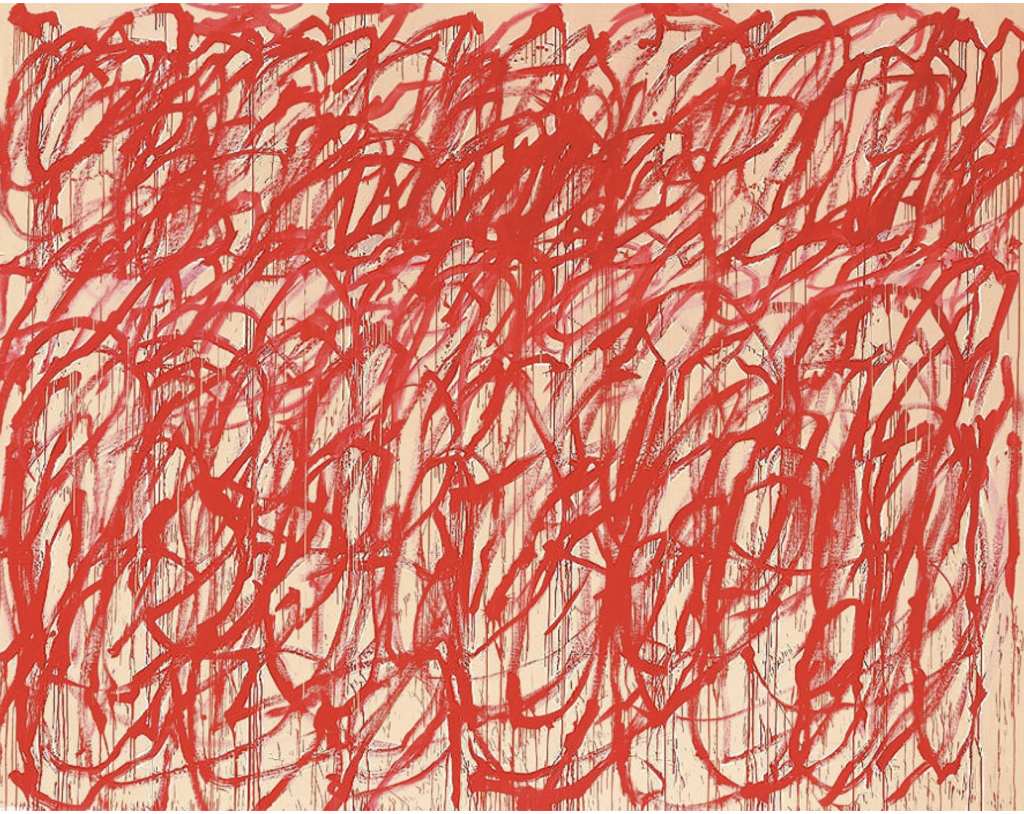
Cy Towbly, Bacchus, 2006-2008, Cy Twombly Foundation, currently exhibited in Gagosian New York
This painting is created by Cy Towbly, an American painter who has been acknowledge by his large-scale, freely-scribbled, calligraphic works on solid fields of plain colors such as off-white, grey and tan. His workflows are influenced greatly by Pollock, who has been mentioned in the description.
As this painting is completely based on his intuitive feeling about composition, shape and colors, it is an example of how the randomness of emotions and thoughts can be represented with color and gestures to articulate emotional expression. As the painting itself only consists of the simplest element- stoke, it allows viewers to examine the energy that’s associated with the expression and also has left room allowing viewers to interpret it.
This work is really inspirational to me as it has manifested how the randomly generated compositions can be really expressive and full of impact while being dynamic and unpredictable.
//Fanjie Jin
//Section C
//fjin@andrew.cmu.edu
//Project 6

function setup() {
    createCanvas(480,480);
}

function draw() {
   background(15, 20, 60);

//change the hour, min and sec into variables
    var S = second();
    var M = minute();
    var H = hour();

//display the grid for percentages
    stroke(255)
    strokeWeight(1)
    line(240, 25, 240, 455)

    stroke(255)
    strokeWeight(1)
    line(20, 240, 480, 240)

//display the percentage signs
    fill(255);
    text(" 0% ", 450, 237);
    fill(255);

    text(" 25% ", 228, 470);
    fill(255);

    text(" 50% ", 5, 237);

    fill(255);
    text(" 75% ", 228, 18);

//outer circle
    stroke(255);
    noFill();
    ellipse(240, 240, 400, 400);

//arc plate displays hours overall percentage of hour
    MappedH = H / 24;
    strokeWeight(1);
    fill(100, 140, 222);
    arc(240,240, 400, 400, 0, MappedH *2 * PI);

//outer circle
    fill(15, 20, 60);
    stroke(255);
    ellipse(260, 240, 300, 300);

//display the grid for hours
    for(a = 0 ;a < 360; a += 15){
      push();
      translate(240,240);
      strokeWeight(1);
      stroke(255, 255, 0);
      rotate(radians(a));
      line(0,0,200,0);
      pop();
    }

//outer circle
    fill(15, 20, 60);
    stroke(255);
    ellipse(260, 240, 300, 300);

//display the grid for seconds and how many seconds have passed
    for(i = 0 ;i < 360; i += 6){
      push();
      translate(260,240);
      stroke(255, 0, 0);
      rotate(radians(i));
      line(0,0,150,0);
      pop();
    }
      push();
      translate(260,240);
      rotate(radians(6 * S));
      stroke(255);
      line(0,0,150,0);
      pop();

    fill(15, 20, 60);
    ellipse(270, 240, 200, 200);

//display how many minutes have passed
    MappedM = M / 60;
    push();
    translate(270, 240);
    noStroke();
    fill(100, 108, 222);
    arc(0,0, 200, 200, 0, MappedM *2 * PI);
    pop();

//draw grid for minutes
    for(a = 0 ;a < 360; a += 6){
      push();
      translate(270,240);
      strokeWeight(1);
      stroke(255, 255, 0);
      rotate(radians(a));
      line(0,0,100,0);
      pop();
    }

//inner ellipse 3
    fill(15, 20, 60);
    stroke(255);
    ellipse(249, 240, 150, 150);

//circle at the center would expand based on seconds
    fill(50, 20, 60);
    noStroke();
    ellipse(249, 240, S * 2.5, S * 2.5);

//display the actual time at the middle of the canvas
    fill(255);
    text(nf(H, 2,0) + ":", 220, 237);
    text(nf(M, 2,0) + ":", 240, 237);
    text(nf(S, 2,0), 260, 237);

//line showing the beginning
    stroke(255);
    strokeWeight(2);
    line(240, 240, 600, 240);
}
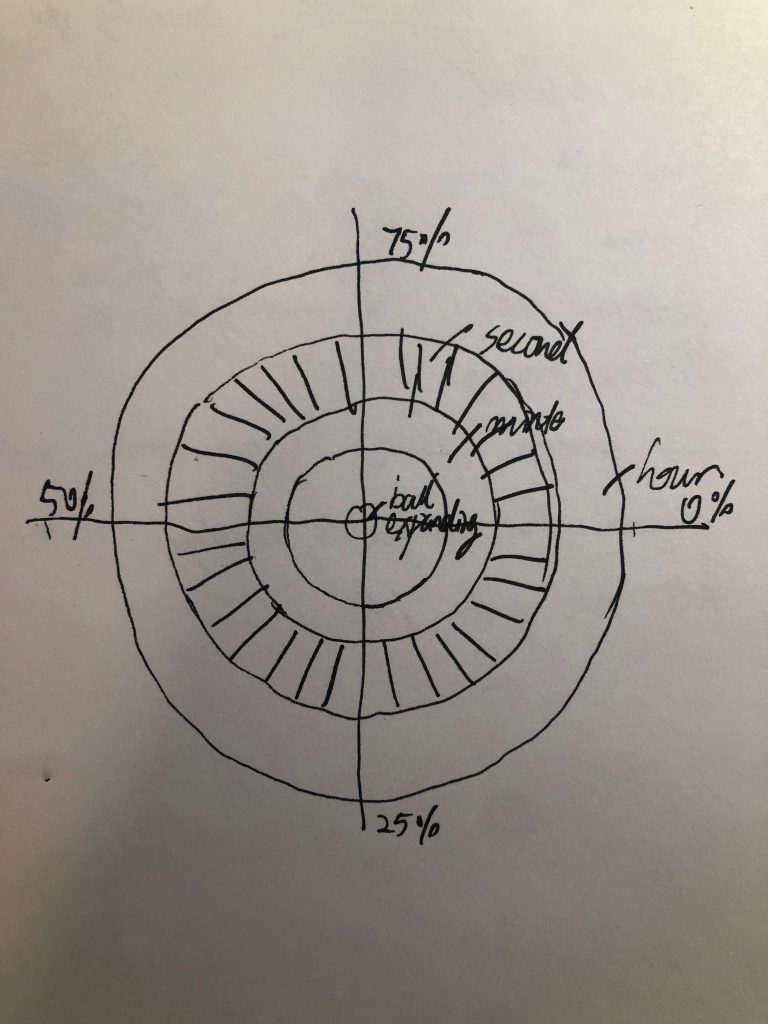
In this abstract clock project, I have decided to treat it with a minimalistic approach. Overall, there are three rings, and from the center to the outer ring, the minutes, seconds, and hours are being displayed. The gird has showed the percentage, so from the clock, viewer will be understand how much percent of the day has been passed. There is a circle expanding constantly at the center of the clock based on how many seconds have been passed. Lastly, I have experimented with the idea of offset so compositionally, its more intriguing.
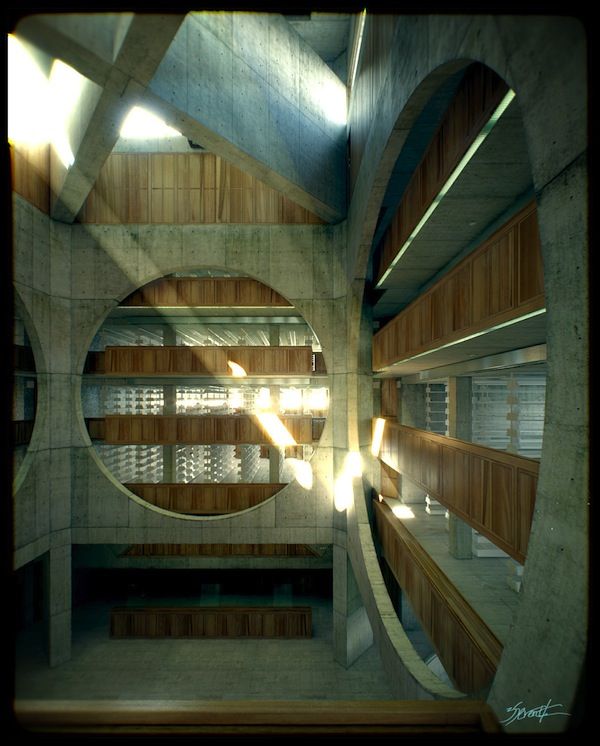
Phillips Exeter Academy Library Vray Render by Alex Roman
This image is rendered by Vray which is a computer based rendering software. The level of details and nuances rendered in this picture has made it just like a realistic photo. Alex Roman is really interested in using computer based render software to create some atmosphere in a building that we can’t really perceive by eyes in the real world. For example in this image, the lighting beam has casted a really dramatic light to the corner of the building and yet in the real world, this type of lighting condition can never really occurs. I really admire him in that he has used the computer based render software to portrait and visualize some dramatic and illusional lighting quality. In the rendered image, the boundary between real and unreal is blurred., I am incredibly impressed by the realistic attributes of this piece and as an architecture student, I wish I can create some renders as astonishing as this.
//Fanjie Mike Jin
//Section C
//rpai@andrew.cmu.edu
//Project-05

function setup() {
    createCanvas(400, 400);
    rectMode(RADIUS)
}

function draw() {
    background(100);
    drawGrid();
    drawSquare();
    drawCircle();
    noLoop();
}

function drawSquare() {
//nested loop for drawing the Squares
    for(var a = 1 ; a < 20; a ++){
      for(var b = 1 ; b < 20; b ++){
//change color transparency
        fill(255 - 7 * a, 255 - 2 * a, 200, 150);
        if(a % 2 == 0){
          strokeWeight(1);
          stroke(60, 211, 206, 90);
          rect(a * 20, b * 20, 20 - b , 20 - b);
        }else{
//odd columns that has a bigger square
          strokeWeight(1);
          stroke(255, 211, 206, 90);
          rect(a * 20, b * 20,  1 / 2 * b, 1 / 2 * b);
        }
      }
    }
}

function drawCircle(){
//nested loop for drawing the circles
    for(var a = 1 ; a < 20; a ++){
    for(var b = 1 ; b < 20; b ++){
      fill(255 - 2 * a, 255 - 2 * a,  100, 200);
      if(a % 2 == 0){
        strokeWeight(1);
        stroke(60, 211, 206, 90);
//color gradient
        ellipse(a * 20, b * 20, b , b);
      }else{
// odd columns
        strokeWeight(1);
        stroke(255, 211, 206, 90);
        ellipse(a * 20, b * 20, 20 - b, 20 - b);
      }
    }
  }
}

function drawGrid(){
//grids
    for(var c = 1 ; c < 20; c ++){
        stroke(255, 50);
        line(c * 20, 0, c * 20, height);
        line(0, c * 20, width, c * 20);
    }
}
I have experimented with using color transparency to create the perceptions of layerings in this wallpaper assignment. I aim to use some repetitive pattern to create some visually intriguing composition. From top to bottom, the size of the circle and square is either becoming larger or smaller. This process is enjoyable and I have gained much more familiarity with nested loop.
//Fanjie Mike Jin
//Section C
//fjin@andrew.cmu.edu
//Project-04

function setup() {
    createCanvas(400, 300);
}

function draw() {
    background(0);

    for (var i = 0; i < 401; i += 10){
 //top left curved lines
      stroke(179, 223, 242);
      line(i, 300, 0, i);
 //top left curved lines
      stroke(179, 183, 242);
      line(400 + i, 300, 0, i);
 //bottom right curved lines
      stroke(115, 236, 235);
      line(i, 300, 0, i / 2);
 //bottom right curved lines
      stroke(179, 223, 242);
      line(400 - i, 300, 400, i / 2);
//top right curved lines
      stroke(179, 223, 242);
      line(400 - i, 300, 400, i);
//top right curved lines
      stroke(179, 183, 242);
      line( - i, 300, 400, i);
//bottom left curved lines
      stroke(179, 223, 242);
      line(i , 0, 400, i * height / width / 2);
//bottom left curved lines
      stroke(115, 236, 235);
      line(i, 0, 400, i * height / width);
//top right curved lines
      stroke(115, 236, 235);
      line(400 - i, 0, 0, i * height / width / 2);
//top right curved lines
      stroke(115, 236, 235);
      line(400 - i, 0, 0, i * height / width);
// center line
      stroke(115, 236, 235);
      line(i ,0 ,0 ,i);
// center line
      stroke(115, 236, 235);
      line(400 - i ,0 ,400, i);
    }
}
In this project, I was interested in using a repetitive pattern to create an interesting composition. I was trying to use different curved lines to show depth of the layers and ultimately create a strong sense of different hierarchies.
This sound installation is titled “Chijikinkutsu”. It is created by a Japanese artist, Nelo Akamatsu. The name of the title is a sound installation ornament fro traditional Japanese gardens in the 16th century. In “Chijikinkutsu”, sewing needles are floating on water in glass tumblers so they are affected by the magnetism field and would turn like a compass. When electricity is applied to the coil, the needle would hit the glass and create a very delicate sound. This a very minimal approach but with this few elements, the sound it generates are rather complex and colorful. I particularly appreciate this project in that it uses the magnetism as the input parameter and as the magnetism field would be different in different parts of the world, the resultant sound installation would be different.
Video featuring the sound performanceview of the installation from http://www.everydaylistening.com/articles/tag/glass
![[OLD FALL 2019] 15-104 • Introduction to Computing for Creative Practice](https://courses.ideate.cmu.edu/15-104/f2019/wp-content/uploads/2020/08/stop-banner.png)