Siwei Xie – Final Project

sketch

//Siwei Xie
//Section B
//sxie1@andrew.cmu.edu
//Final Project

var size = 10;//original size of brush stroke

function setup() {
    createCanvas(480, 480);
    background("white");
    frameRate(500);//speed of drawing balls
}

function draw() {
    //fill unwanted borders with purple rectangels
	noStroke();
	fill(194, 192, 216);
	rect(0, 0, 480, 70);
    rect(0, 0, 150, 480);
    rect(450, 0, 30, 480);
    rect(0, 450, 480, 30);

    //titles & functions of drawing pad
	textStyle(NORMAL);
    textStyle(BOLD);
    textSize(27);
    fill("white");
    text('My Drawing Pad', 200, 50);

    textSize(15);
    fill(101, 67, 89);
    text('1. Drag mouse', 9, 115);
    text('to draw', 25, 133);
    text('2. Click buttons', 15, 220);
    text('to add patterns', 20, 235); 

    //notes for buttons
    textSize(12);
    fill("black");
    textStyle(ITALIC);
    text('Press B for big brush', 15, 153);
    text('Press S for small brush', 15, 168);

    //buttons for BACKGROUND 
    fill(185, 88, 84);//maroon square
    square(20, 250, 20); 

    fill("gray");//gray square
    square(60, 250, 20);

    fill("yellow");//yellow square
    square(100, 250, 20);

    //button for ERASE
    fill("white");
    rect(40, 360, 60, 40);
    fill("black");
    text('ERASE', 50, 385);
    
    //draw by using BRUSH
    if (mouseIsPressed) {
        fill(random(255), random(255), random(255));
        ellipse(mouseX, mouseY, size);
    }
} 

function keyPressed(){
    if (key === "B" || key === "b") {
        size += 10;//increase width of stroke
    }

    if (key === "S" || key === "s") {
        size -= 10;//decrease width of stroke
    }
}

function mouseClicked(){
    //PATTERN 1: use nested Loop to create shapes
    if(mouseX > 20 & mouseX < 40 && 
        mouseY > 250 && mouseY < 270){
    for (var j = 0; j < 12; j++) {
        for (var i = 0; i < 8; i++) {

        //maroon circles
        noStroke();
        fill(185, 88, 84);
        circle(i * 40 + 160, j * 30 + 95, 20);
        
        //white verticle lines
        fill("white");
        rect(i * 40 + 155, 80, 3, 370);
        }
    }
    noLoop();
    }

    //PATTERN 2: 
    if(mouseX > 60 & mouseX < 80 && 
        mouseY > 250 && mouseY < 270){
        fill("white");
        rect(150, 70, 300, 380);
        for (var y = 0; y < 360; y += 45) {
            for (var x = 0; x < 270; x += 45) {
                fill(182, 182, 182);
                circle(x + 180, y + 105, 45);
        }
    }
    noLoop();
    }

    //PATTERN 3: 
    if(mouseX > 100 & mouseX < 120 && 
        mouseY > 250 && mouseY < 270){
        for (var a = 0; a < 280; a = a + 1) {
        strokeWeight(20);
        stroke("yellow");
        //curve's starting point, height - curving extent * direction
        point(a + 160, 250 - 100 * sin(radians(a)));
        stroke(253, 241, 161);
        point(a + 160, 250 - 100 * cos(radians(a)));
        }
    noLoop();
    }

    //ERASE:
    if(mouseX > 40 & mouseX < 100 && 
        mouseY > 360 && mouseY < 400){
        noStroke();
        fill("white");
        rect(150, 70, 300, 380);
    }
}

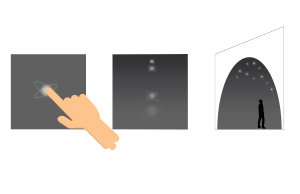
In my final project, I created an “Interactive drawing pad.” Firstly, users can drag mouse on the white drawing pad to draw colorful stroke. They can change width of stroke by pressing S or B. Secondly, users can click on the 3 buttons on the left to select different patterns to fill the pad. Finally, they can use ERASE function to erase previously drawn strokes or patterns.

Ghalya Alsanea – LO – 12

Project 1: Turning biometric data into art by The Mill+

The Lush Spa Experiment was designed to capture biometric data. This data drove a series of unique and meditative visualisations, which mirror the multisensory experiences of a Lush Spa treatment.

The Mill+ joined forces with Lush to create a 2-minute film created via biometric data visualization – the aim being to visualize the physical response someone has to a Lush spa treatment. Essentially, turning biometric data into art.

The film is an artistic rendition of the body’s response to the spa treatment.

Mill+ Creative Director Carl Addy comments, “The data captured was fascinating. It shows a clear correlation between the treatment and the subject’s biometric response. You can actually see the moments when a sound or touch elicited a shift in brain wave which then triggers a reaction in breath and heart rate.”

Find more here(credits) & here(behind the scenes).

PROJECT 2: Visualization Techniques to Calm Your Anxious Mind by Barbara Davidson

This post shows 7 visualization techniques to help ease your anxiety. For my final project I am looking at how visual queues can trigger emotional calming responses, and I was using this project as a study point. Here are some examples:

The stop sign technique is best used when you have an unwanted thought.
This technique is best used when you feel overwhelmed by your chattering mind .

I love the how coherent and consistent the graphics are. Something that I wouldn’t necessary do is put people in the visualization, unless they’re vague enough figures, because I worry when something is as personal as your mind, you wouldn’t want someone to feel like they can’t relate to the visualization because “it doesn’t look like them”.

Read more here.

Concolusions..

When comparing the two, I admire both the visual coherency that exists within each project. The first one is interesting because it is a visualization the takes inputs and does not necessarily have a specific output in mind. The second one is the opposite in the sense that it has a highly specific output it is trying to achieve through the visualization. For my final project, I want to find a way to do both and play with the two balances based on what’s needed.

Ghalya Alsanea – Project – 12 – Proposal

I want to create a smart watch interface for someone with anxiety and panic disorder. I plan on using real-time biometric data from sensors and using the data to trigger and display things using p5.js. I have done projects before the use p5 serial communication, but my plan b is that is it does not work, then I will simply use button interactions in p5.js to trigger the different modes.

The watch has two modes: Normal Mode & Panic Mode.

Normal Mode includes a watch interface that displays the time and date, in addition to the sensor data in an artistic, data-visualization way (I am thinking something similar to a mood visualizer type of thing). The panic mode can be triggered through two ways: a panic button the user presses or sensor data that indicates the user is having a panic attack. In Panic Mode, the canvas cycles through the following anxiety relieving techniques:

  1. Deep Breathing Exercise: using calming graphics to help guide the user through a deep breathing exercise. I will use online resources to figure out how the breathing exercise need to be in order to work, like WebMed’s Techiques for deep breathing.
  2. Body Scan: using the body scan technique found here.
  3. Distraction/Game Technique: using a jigsaw puzzle or some sort of mind occupying game that reduces stress but still allow you to channel your overactive brain somewhere.
  4. 5 Senses Technique: using the 5 senses to ground you, as shown below:
This is a type of grounding technique to help bring you back to reality during a panic attack.

If all of the following techniques do not work, then this triggers a “call emergency contact” state, which calls someone you designated as a person to reach out to. For example, “calling your mom…”

The biometric sensors I am thinking of using are: a heart rate (PPG) sensor, a GSR sensor, and a respiratory rate sensor. The last one, I might not need, I am waiting to confirm with a specialist…

The photoplethysmography (PPG) circuit ascertains the user’s heart rate.
The galvanic skin response (GSR) circuit ascertains the user’s skin conductance level – a measurement loosely coupled with perspiration indicative of stressful conditions (in other words, the more stressed you are, the more you sweat).

Nawon Choi— Looking Outward 12

“Strength” by Field for Deutsche Bank

I was really inspired by a studio called Field. They are a creative studio that creates immersive artistic experiences using technology. In particular, a project called “Evolving Environments” was very interesting to me. I really admire the beautiful motion graphics combined with and auditory component that creates a truly immersive and captivating experience. They used real-time code that reflects something happening in nature.

Light and motion graphics for a project for the car company Infinity

I was also inspired by the works of a studio called Nand. For this project, they tried to capture the experience of driving through data, light, and motion. I love the idea of taking data points such as speed, acceleration, heart rate, etc to incorporate into the visualization. I also like how they tried to evoke or emulate emotion through an abstract visualization.

Both projects take data points from “real life” and abstract them in a way to visualize motion and emotion. I really like this idea of creating computational art by incorporating data.

Julia Nishizaki – Project 12 – Proposal

For my final project, I want to create an instrument of sorts that is based on the sounds around us, both sounds of nature as well as sounds related to machinery, technology, or man-made systems. I was thinking about Greta Thunberg’s speech at the French Parliament in July, and I realized that I’m really not familiar with the IPCC’s reports or the fact that in just 11 years we’ll reach some tipping points that we likely won’t be able to recover from. Through this project, I want to help visualize and create a more concrete image of what the future could look and sound like if we don’t change, in terms of animal and plant life, water levels, weather, and technology. Similar to patatap.com, I want my instrument to have different sounds and visuals for each letter, so that as you type and your words appear on the screen, the landscape starts to scroll past, and forms like plants, animals, buildings, and cars start to populate it. However, when you press a key such as shift or the space bar, the landscape changes to a future where we didn’t actively try to combat climate change, and all the images and sounds your words create in this possible future reflect that.

Sketches and notes for final project proposal

Julia Nishizaki – Looking Outwards – 12

I am taking my second late day for this looking outwards post. Because I’m considering visualizing type as a part of my project, the two works I chose to look at explore type, one through sound, and the other through visuals.

A demonstration of typatone.com, an online instrument

The first work is typatone.com, by Lullatone and Jono Brandel, the same individuals who created patatap.com. I really enjoyed the visuals of patatap.com, but I like typatone’s direct connection between the user’s thoughts and what they see. It gives the sounds more meaning, and makes the interaction more personal.

“A Flowering Theory,” a visual depiction of the grammar structure of Darwin’s last lines in “On the Origin of Species”

The other work I decided to look at is called “A Flowering Theory,” by Stefanie Posavec and Abbie Stephens, and commissioned by Protein as a part of “Channel 4 Random Acts.” I was intrigued by this work, because rather than associate a sound or a visual with a single letter, Posavec analyzed the text’s grammatical structure, and the Stephens used that data to construct the growing plants and forms. I am interested in combining typatone.com’s more experimental approach and interactions, with visuals of flowers or smog that grow or change, like Posavec and Stephen’s interpretations.

Danny Cho – LookingOutwards 12

I looked at two people’s projects, Hannah Cai (2018 Fall) and Supawat Vitoorapakorn (2017 Fall). Hannah created an experience where you can select stars and connect them with different shapes, while Supawat created an environment to test out the process of evolution.

Above is Supawat’s evolution simulation

Above is Hannah’s interactive constellation

What I find very interesting in these two people’s projects is that they took completely different routes about what they want to convey. Hannah created a visually pleasing interaction while Supawat created a highly data-based visualization of constantly morphing information.

I wonder if I can take the middle ground of balance between these two. 

Danny Cho – Final Project Proposal

I am currently making a space for an experience for people to feel wonder and playfulness by creating stars shooting them into the night sky. Below is the sketch. The touch screen part will be substituted with the clicking motion and I want to create additive features that are activated in various conditions in relation to distance between different stars and their locations.

Jacky Tian’s Final Project Proposal

For the final project, I’m going to design a “catch and run” game. There will be two “characters” in the game where one represents the cop and the other one represents the thief. Players need to use their mouseclick to control the movement of the “thief”. The mission of the “thief” is to collect all the coins floating in the canvas. There will be other elements such as bombs that can result in penalty if thief touches.

Crystal-Xue-Project-12-Proposal

For my final proposal, I want to create a sound interactive project. There will be sound visualization for the main piece and mouse interactive parts that can control the pitch/volume etc. I will also make the changes to be perceivable in the visualization part. The geometry is not fully designed yet. I’ll have to experiment with the sound itself to decide the best way to deliver my project (possibly use the z-coordinate)

final project proposal