Siwei Xie – Final Project

sketch

//Siwei Xie
//Section B
//sxie1@andrew.cmu.edu
//Final Project

var size = 10;//original size of brush stroke

function setup() {
    createCanvas(480, 480);
    background("white");
    frameRate(500);//speed of drawing balls
}

function draw() {
    //fill unwanted borders with purple rectangels
	noStroke();
	fill(194, 192, 216);
	rect(0, 0, 480, 70);
    rect(0, 0, 150, 480);
    rect(450, 0, 30, 480);
    rect(0, 450, 480, 30);

    //titles & functions of drawing pad
	textStyle(NORMAL);
    textStyle(BOLD);
    textSize(27);
    fill("white");
    text('My Drawing Pad', 200, 50);

    textSize(15);
    fill(101, 67, 89);
    text('1. Drag mouse', 9, 115);
    text('to draw', 25, 133);
    text('2. Click buttons', 15, 220);
    text('to add patterns', 20, 235); 

    //notes for buttons
    textSize(12);
    fill("black");
    textStyle(ITALIC);
    text('Press B for big brush', 15, 153);
    text('Press S for small brush', 15, 168);

    //buttons for BACKGROUND 
    fill(185, 88, 84);//maroon square
    square(20, 250, 20); 

    fill("gray");//gray square
    square(60, 250, 20);

    fill("yellow");//yellow square
    square(100, 250, 20);

    //button for ERASE
    fill("white");
    rect(40, 360, 60, 40);
    fill("black");
    text('ERASE', 50, 385);
    
    //draw by using BRUSH
    if (mouseIsPressed) {
        fill(random(255), random(255), random(255));
        ellipse(mouseX, mouseY, size);
    }
} 

function keyPressed(){
    if (key === "B" || key === "b") {
        size += 10;//increase width of stroke
    }

    if (key === "S" || key === "s") {
        size -= 10;//decrease width of stroke
    }
}

function mouseClicked(){
    //PATTERN 1: use nested Loop to create shapes
    if(mouseX > 20 & mouseX < 40 && 
        mouseY > 250 && mouseY < 270){
    for (var j = 0; j < 12; j++) {
        for (var i = 0; i < 8; i++) {

        //maroon circles
        noStroke();
        fill(185, 88, 84);
        circle(i * 40 + 160, j * 30 + 95, 20);
        
        //white verticle lines
        fill("white");
        rect(i * 40 + 155, 80, 3, 370);
        }
    }
    noLoop();
    }

    //PATTERN 2: 
    if(mouseX > 60 & mouseX < 80 && 
        mouseY > 250 && mouseY < 270){
        fill("white");
        rect(150, 70, 300, 380);
        for (var y = 0; y < 360; y += 45) {
            for (var x = 0; x < 270; x += 45) {
                fill(182, 182, 182);
                circle(x + 180, y + 105, 45);
        }
    }
    noLoop();
    }

    //PATTERN 3: 
    if(mouseX > 100 & mouseX < 120 && 
        mouseY > 250 && mouseY < 270){
        for (var a = 0; a < 280; a = a + 1) {
        strokeWeight(20);
        stroke("yellow");
        //curve's starting point, height - curving extent * direction
        point(a + 160, 250 - 100 * sin(radians(a)));
        stroke(253, 241, 161);
        point(a + 160, 250 - 100 * cos(radians(a)));
        }
    noLoop();
    }

    //ERASE:
    if(mouseX > 40 & mouseX < 100 && 
        mouseY > 360 && mouseY < 400){
        noStroke();
        fill("white");
        rect(150, 70, 300, 380);
    }
}

In my final project, I created an “Interactive drawing pad.” Firstly, users can drag mouse on the white drawing pad to draw colorful stroke. They can change width of stroke by pressing S or B. Secondly, users can click on the 3 buttons on the left to select different patterns to fill the pad. Finally, they can use ERASE function to erase previously drawn strokes or patterns.

Siwei Xie – Final Project Proposal

Sketch of “drawing pad”

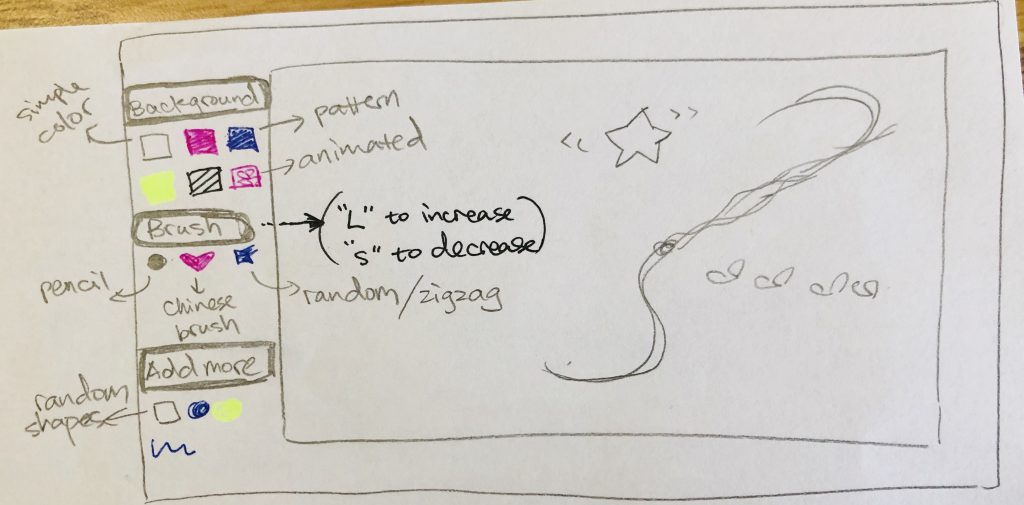
For my final project, I’ve decided to create an “Interactive drawing pad.” Basically, users can click on the buttons on the left to select different backgrounds, brushes and add more special effects. The pad will have the following functions for users to create their own paintings.

  1. Change background:
    • basic function: change into pure colors
    • advanced: use patterned background (I will refer to wallpaper, nested loop, use sin and cos to make curves, turtle pattern, etc.)
  2. Change type of brush:
    • basic “pencil” function:change stroke width and color by pressing “L” (large) / “S” (small) / “R” (red) / “B” (blue) / “Y” (yellow)
    • special brush 1: Chinese brush (I will refer to mouse dragging function)
    • special brush 2: zigzags (random lines)
    • special brush 3: make new balls (objects function)
    • special brush 4: change into a flower and record traces of movements
  3. Add randomness:
    • add random stars at night (tie making of random spot with seconds),
    • add colorful balls (add moving particles),
    • * moving mountains (make terrain animation),
  4. Add other shapes:
    • moving star (make a star that’s changing shape randomly),
    • rotating rectangles (rotate and translate rectangles)
    • (press “space” to delete the shape created)

Siwei Xie – Looking Outwards – 12

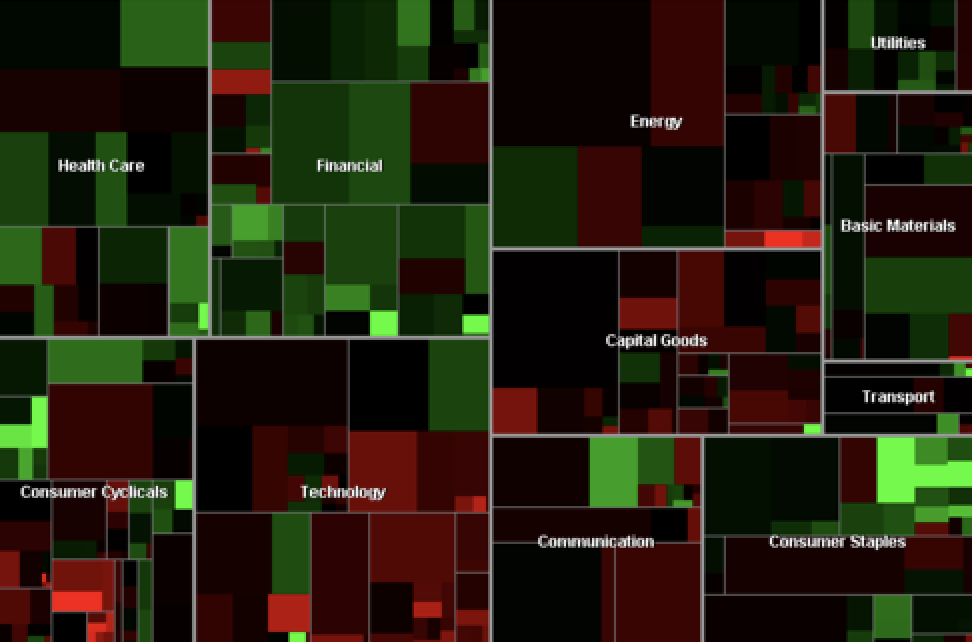
Project 1: The Map is divided into rectangular tiles that represent publicly traded companies. The area of a rectangle corresponds to the market capitalization of the company, and the color tells you how the stock price has changed since the previous market close. Unlike a traditional treemap, the Map of the Market introduced a new algorithm designed to create tiles that were close to square.

Martin Wattenberg, Map of the Market (1998)

Source of Map.

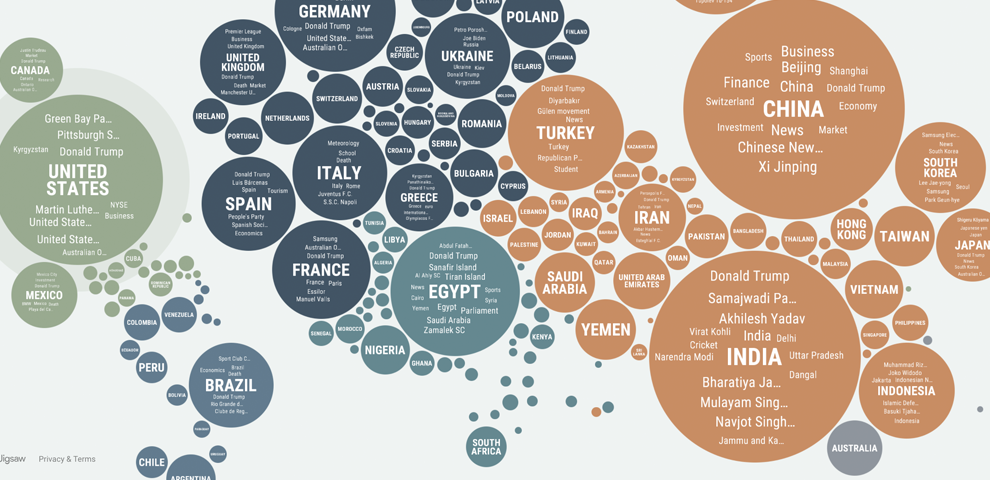
Project 2: Based on Google News data and state-of-the-art translation technology, the site identifies and displays which subjects are disproportionately covered in the news in each country. Users can explore the relative coverage of any particular subject across the globe. They also can see a view that emphasizes exactly the news that is not being published widely in their own country.

Martin Wattenberg, Live Visualizations at Google

Source of Live Visualization.

Comparisons: I admire the projects because both of them represent data in a visual and artistic form. However, the data they took is different, which results in different analysis and forms of expressions. They might overlook the progression of data over time and reasons behind layouts of the data. 

Siwei Xie – Project 10 – Sonic Sketch

sketch

//Siwei Xie
//Section B
//sxie1@andrew.cmu.edu
//Project-10-sonic sketch

var img;
var dog;


function preload() {
    //load "pets" image from imgur
    img = loadImage("https://i.imgur.com/iqyeVWW.png");
    
    //load sound tracks
    // dog = loadSound("dog.wav");
    // cat = loadSound("cat.wav");
    // bird = loadSound("bird.wav");
    // fish = loadSound("fish.wav");
    dog = loadSound("https://courses.ideate.cmu.edu/15-104/f2019/wp-content/uploads/2019/11/dog.wav");
    cat = loadSound("https://courses.ideate.cmu.edu/15-104/f2019/wp-content/uploads/2019/11/cat.wav");
    bird = loadSound("https://courses.ideate.cmu.edu/15-104/f2019/wp-content/uploads/2019/11/bird-1.wav");
    fish = loadSound("https://courses.ideate.cmu.edu/15-104/f2019/wp-content/uploads/2019/11/fish.wav");
}

function setup() {
    createCanvas(466, 350);
}

function draw(){
    background(100);
    
    //scale the image according to canvas size
    image(img, 1, 1, 
        img.width * 0.4, img.height * 0.4);
}

function mousePressed(){
    //play "dog" track when clicking on upper left area
    if(mouseX < 233 & mouseY < 175){
        dog.play();
    }
    //play "cat" track when clicking on upper right area
    if(mouseX > 233 & mouseY < 175){
        cat.play();
    }
    //play "bird" track when clicking on lower left area
    if(mouseX < 233 & mouseY > 175){
         bird.play();
    }
    //play "fish" track when clicking on lower right area
    if(mouseX > 233 & mouseY > 175){
        fish.play();
    }
}

I used 4 sound tracks for this project and created a “pet zoo.” The tracks contain dog barks, cat meows, fish bubbling and bird singing. You can play different sound tracks by clicking on different section of the image. I had fun creating this project because it enables me to insert sounds into post and make it interesting.

Siwei Xie – Looking Outwards – 10

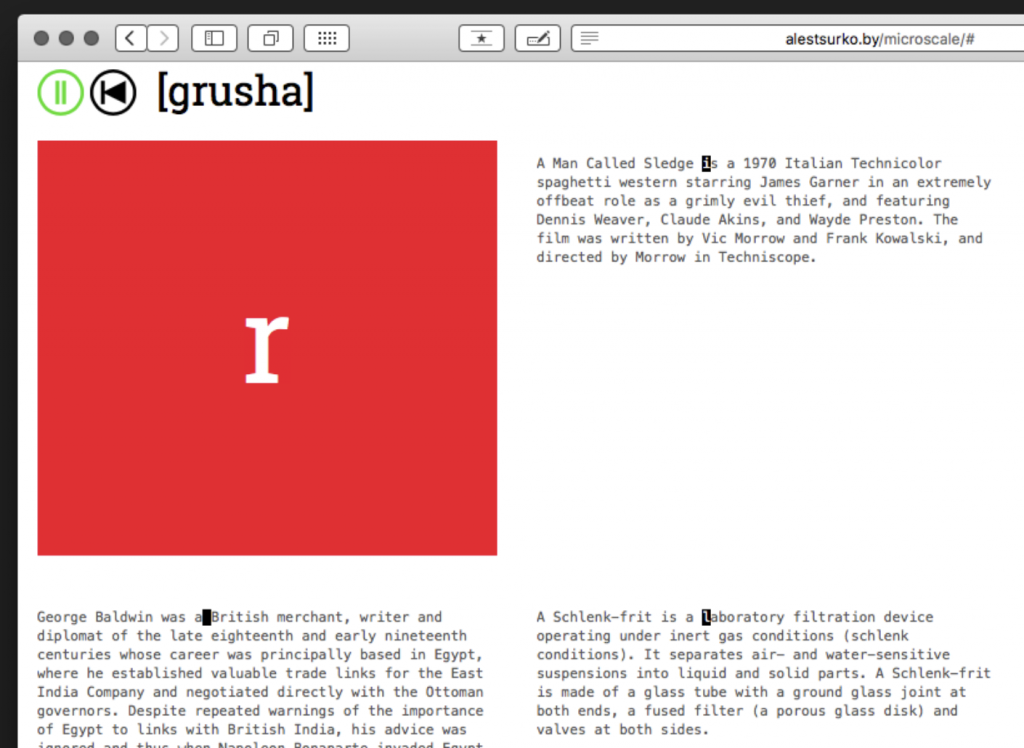
Microscale is a generative and web-based album. I admire it because although the creator has written generative/algorithmic music before, and almost all of his previous work has procedurally generated material, microscale is his first fully generative album which was created from a “generative” idea. Creator’s artistic sensibilities manifest because this album has been created not so much by thinking, as by emotions – so it’s not purely artificial intelligence or computer music. 

The music on microscale is generated in real-time from random Wikipedia articles. Each article becomes a step sequencer, where the letters are the sequencer steps and the track titles are regular expressions that switch the steps of the sequencers on and off.

The concept of the album is to show that through transforming one media (text) into another media (music), the meaning can be transformed – the article has its own meaning, but the music has a completely different meaning. And it’s not just one-to-one transformation – there are six articles (i.e. six meanings), which although unrelated to each other, create a whole piece of music that has one singular meaning.

Ales Tsurko, Microscale, 2017

Link to original source.

Siwei Xie- Project 11 – Landscape

sketch

//Siwei Xie
//Section B
//sxie1@andrew.cmu.edu
//project-10-landscape

var terrainSpeed = 0.0002;//speed of terrian moving
var terrainDetail = 0.015;//smoothness of terrian
var star = [];

function setup() {
    createCanvas(480, 480);
    frameRate(20);//speed of refreshing frames (stars changing)
}

function draw() {
    background("black");

    makeMountain();
    makeMoon();
    makeStar();
    makeCar();
}

//moving terrian
function makeMountain(){
    noStroke();
    fill("blue"); 
    beginShape(); 

    for (var x = 0; x < width; x++) {
      var t = (x * terrainDetail) + (millis() * terrainSpeed);//shape & moving speed of terrian 
      var y = map(noise(t), 0, 1.8, height/8, height);//y-coordinate of terrian
      vertex(x, y);//draw terrian continuously
    }

    vertex(width, height);//constrain range of terrian
    vertex(0, height);//terrian restarts at left side of canvas
    endShape();
}

function makeMoon(){
    noStroke();
    fill(252, 242, 166);
    ellipse(2 * width / 3, height / 4, 120, 120);//outer layer
    fill(239, 207, 104);
    ellipse(2 * width / 3, height / 4, 80, 80);//inner layer
}

function makeStar(){
    fill(270);
    for (var i = 0; i < 30; i++) {
      var starX = random(width); //random stars on upper canvas
      var starY = random(0, 200);
      ellipse(starX, starY, 3, 3);
    }
}

function makeCar(){
    fill("yellow");
    rect(100, random(375, 380), 100, 30);//lower body of shaking car
    rect(100, 350, 70, 30);//uppper body of shaking car

    fill("green");
    stroke("black");
    circle(120, random(410, 415), 30, 30);//left wheel
    circle(170, random(410, 415), 30, 30);//right wheel
}
   

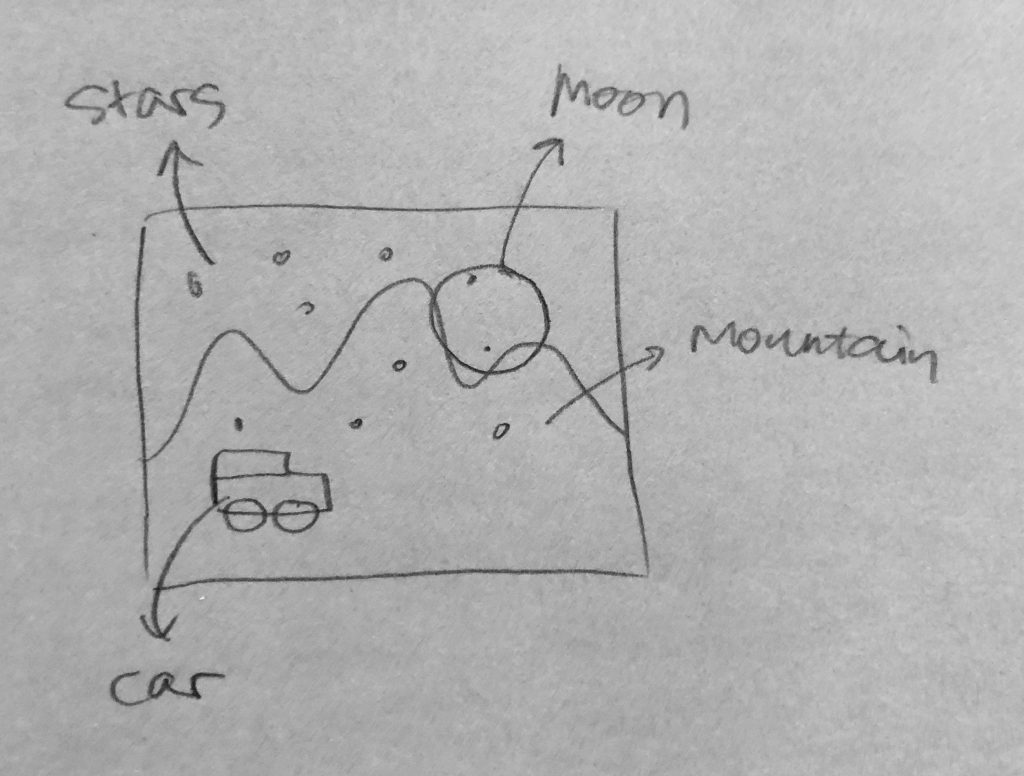
I had fun creating this project. Moving the background (terrain) implies the moving of the main object (car). The process of generating mountain in the back was fascinating, because I learned how to randomize height and width in order to indicate moving scenes. Creating mountains creates a very peaceful and relaxing scene, which is something I desperately want.

I also utilize randomly-positioned stars in the background to make it a starry night. For the car, I used randomized y-coordinates in order to show it is driving on a bumpy road. Overall, I think I achieved my goal of giving the viewer a sense of wonderment.

Sketch on my notebook.

Siwei Xie – Looking Outwards 11

Ayah Bdeir is an entrepreneur, inventor, and interactive artist. She is the founder and CEO of littleBits. Bdeir earned a Masters of Science degree from the MIT Media Lab. littleBits joined the 2016 Disney Accelerator program. It has also partnered with Pearson, one of the leading curriculum companies in the world to co-create curriculum to support their Science and Engineering program.

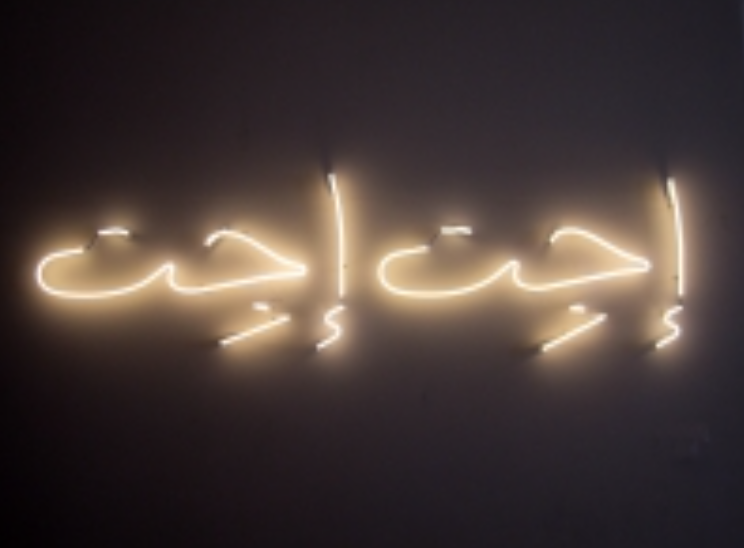
EE is an interactive installation that examines people’s interaction with Lebanese electricity, an infamously broken infrastructure that they have learnt to live without, or in spite of. I admire it because over the past 25 years, electricity shortages in Lebanon have reached 20 hours a day, creating a sinister imaginary persona that commands life across social, financial and political lines, and seems to constantly play hard to get.

Ayah Bdeir, Elusive Electricity, July 2011, Neon, Steel, Motion Sensor, Cables, Custom Electronics

Original source.

Siwei Xie – Project 09 – Computational Portrait

sketch

//Siwei Xie
//Section B
//sxie1@andrew.cmu.edu
//Project-09-Computational Portrait

var photo;

//load my portrait from imgur
function preload() {
    var myImageURL = "https://i.imgur.com/4dPRyTE.png";
    photo = loadImage(myImageURL);
}

function setup() {
    createCanvas(480, 480);
    background(0);
    photo.loadPixels();
    frameRate(999999); //speed of generating image
}

function draw() {
    var px = random(width); //random x location for new rect
    var py = random(height); //random y location for new rect
    var ix = constrain(floor(px), 0, width-1); //contrain rect within canvas width
    var iy = constrain(floor(py), 0, height-1);//contrain rect within canvas height
    var theColorAtLocationXY = photo.get(ix, iy);//match rect colors with original photo

    noStroke();
    fill(theColorAtLocationXY);//retrieve color
    rect(px, py, random(10, 20), random(10, 20));//fill canvas with random-sized rect

}

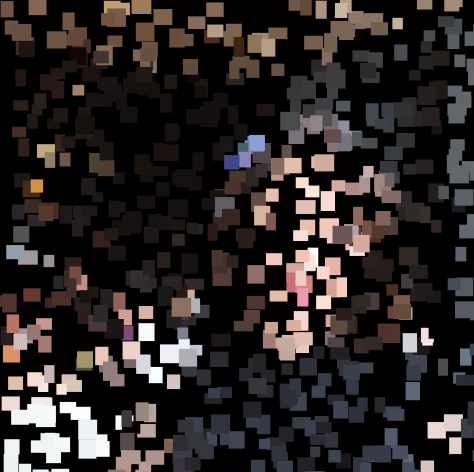
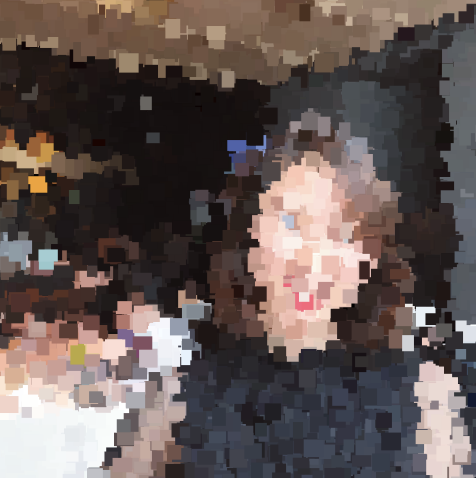
It was fun creating animated portrait using my own photo. The matching process between colors and sizes of random rectangles, and the original image was a fascinating process.

Siwei Xie – Looking Outwards 09

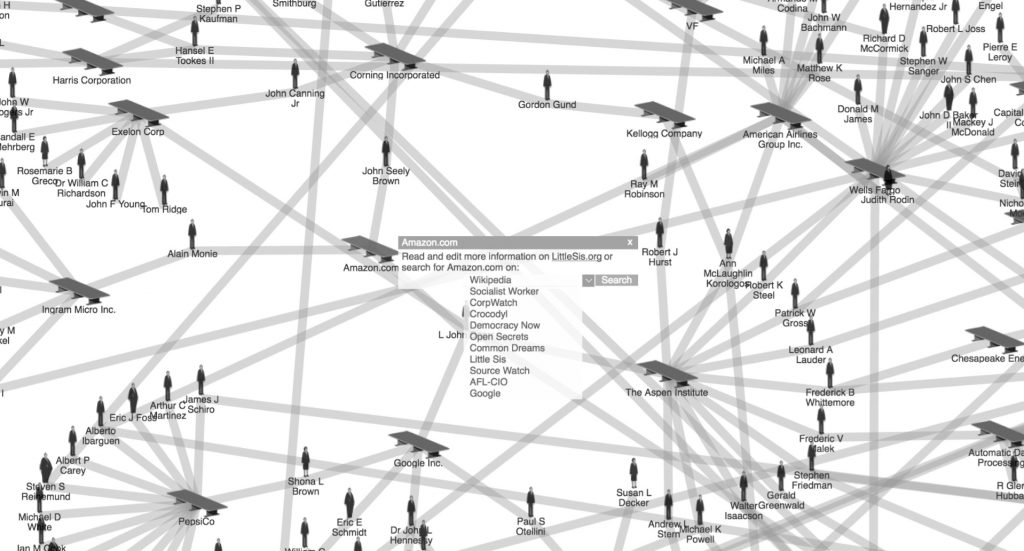
“They Rule” is one of the pioneers in revealing the implications and power of data visualization, as well as the role that data designers play in them in a scenario where data was starting to be abundant. My peer did not add her thoughts in the assessment, she mainly described what the project is, which I agree with the facts. 

I can add more of my original thoughts to her assessment. I think “They Rule” is a starting point for research on these powerful individuals and corporations. Network visualization allows corroborating things that are known but not seen until then as directors of powerful companies repeating themselves in more than one company, concentrating power in a few. 

However, “They Rule” is not a real-time representation of a dataset as the formation of company directories is constantly changing. Currently, we find many representations of power networks of politicians, businessmen, corporations, knowledge networks, etc. What makes “They Rule” is that it was one of the pioneering projects in making visible the relationships between individuals that constitute the power class.

Link to my peer’s assessment. SooA Kim, Looking Outwards 07, 10/11/2019.

Link to the original source. Josh On, “They Rule”, 2001.

Josh On, “They Rule”, 2001.

Siwei Xie – Looking Outwards – 08

Meejin Yoon is an architect, designer, and educator, whose projects and research investigate the intersections between architecture, technology, and the public realm. Prior to joining the faculty at AAP, Yoon was at MIT for 17 years and served as the head of the Department of Architecture from 2014–18. 

I admire her work that includes interactive public space projects bridging issues of technology and play in the public sphere. Her works have great variety and social values. Spanning work over the past decade, topics covered will include responsive technologies, smart materials, renewable energy, media based public art, public engagement and the public process. I admire the interactive technologies she uses in the interactive architectures. 

She uses relevant data and images effectively to help audience understand. I will incorporate this strategy and present images during my working processes.

In her speech, she backed her data with the studio established in 2001, which she pursues creative works at the intersection of architecture, art and technology. The firm is an international interdisciplinary design practice working across the domains of architecture, urban design, public space, immersive experience, and design strategy.

Link to her website.

Meejin Yoon’s speech on Eyeo 2015.