Project 1: Turning biometric data into art by The Mill+

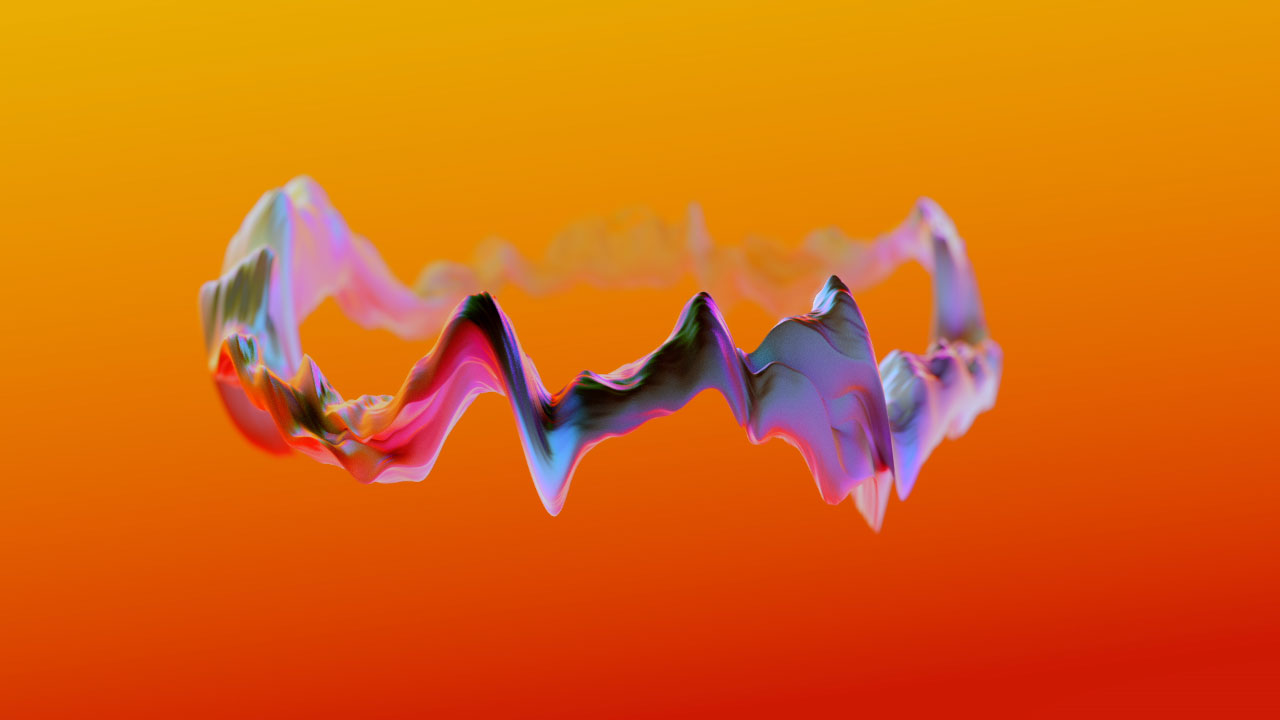
The Mill+ joined forces with Lush to create a 2-minute film created via biometric data visualization – the aim being to visualize the physical response someone has to a Lush spa treatment. Essentially, turning biometric data into art.
Mill+ Creative Director Carl Addy comments, “The data captured was fascinating. It shows a clear correlation between the treatment and the subject’s biometric response. You can actually see the moments when a sound or touch elicited a shift in brain wave which then triggers a reaction in breath and heart rate.”
Find more here(credits) & here(behind the scenes).
PROJECT 2: Visualization Techniques to Calm Your Anxious Mind by Barbara Davidson
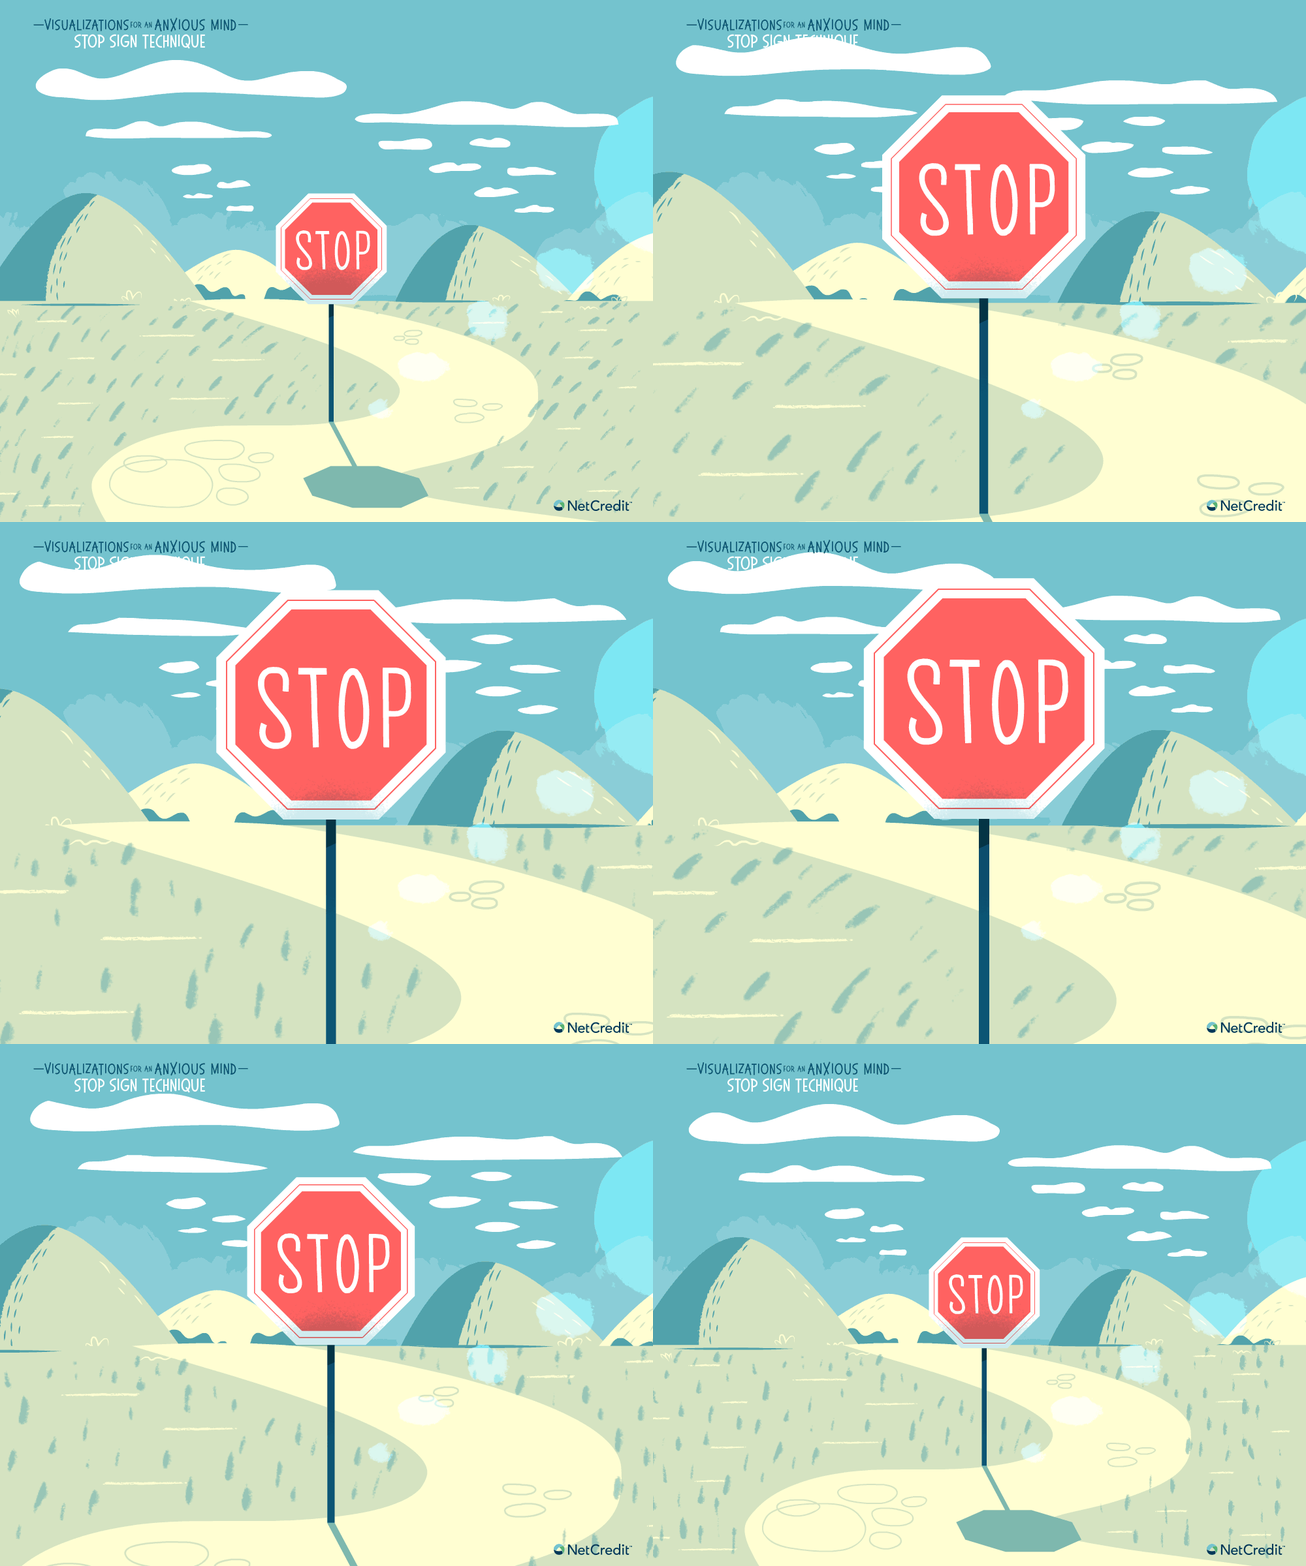
This post shows 7 visualization techniques to help ease your anxiety. For my final project I am looking at how visual queues can trigger emotional calming responses, and I was using this project as a study point. Here are some examples:


I love the how coherent and consistent the graphics are. Something that I wouldn’t necessary do is put people in the visualization, unless they’re vague enough figures, because I worry when something is as personal as your mind, you wouldn’t want someone to feel like they can’t relate to the visualization because “it doesn’t look like them”.
Read more here.
Concolusions..
When comparing the two, I admire both the visual coherency that exists within each project. The first one is interesting because it is a visualization the takes inputs and does not necessarily have a specific output in mind. The second one is the opposite in the sense that it has a highly specific output it is trying to achieve through the visualization. For my final project, I want to find a way to do both and play with the two balances based on what’s needed.
![[OLD FALL 2019] 15-104 • Introduction to Computing for Creative Practice](wp-content/uploads/2020/08/stop-banner.png)