![[OLD FALL 2019] 15-104 • Introduction to Computing for Creative Practice](../../../../wp-content/uploads/2020/08/stop-banner.png)
//Sean Meng
//hmeng@andrew.cmu.edu
//Section C
//Project-07-Curves
function setup() {
createCanvas(480, 480);
}
function draw() {
background(0);
//Rotate the Epicycloid curve at canvas center point
push();
translate(width / 2, height / 2);
//Constrain and remap mouseX and mouseY value
var X = constrain(mouseX, 0, 480);
var Y = constrain(mouseY, 0, 480);
var c1 = map(mouseX, 0, 480, 0, 255);
var c2 = map(mouseX, 0, 480, 0, 255);
//Define the radius of two circles that generate the Epicycloid curve
var R = map(X, 0, width, 0, 200);
var r = map(Y, 0, height, 0, 60);
//Change the stroke color as mouseX moves along the canvas
stroke(c1, 200, c2);
noFill();
beginShape();
rotate(radians(X));
//Draw the first Epicycloid curve
for(var angle = 0; angle < 360; angle += 2.5){
CrvY = (R + r) * sin(angle) - r * sin((R + r) * angle / r);
CrvX = (R + r) * cos(angle) - r * cos((R + r) * angle / r);
curveVertex(CrvX, CrvY);
}
endShape();
pop();
push();
translate(width / 2, height / 2);
stroke(255);
//Constrain and remap mouseX and mouseY value
var X = constrain(mouseX, 0, 480);
var Y = constrain(mouseY, 0, 480);
var c3 = map(mouseX, 0, 480, 0, 255);
var c4 = map(mouseX, 0, 480, 0, 255);
//Define the radius of two circles that generate the Epicycloid curve
var R1 = map(X, 0, width, 0, 300);
var r1 = map(Y, 0, height, 0, 60);
//Change the stroke color as mouseX moves along the canvas
stroke(c3, c4, 200);
noFill();
beginShape();
rotate(radians(- X));
//Draw the second Epicycloid curve
for(var angle = 0; angle < 360; angle += 4){
CrvY1 = (R1 + r1) * sin(angle) - r1 * sin((R1 + r1) * angle / r1);
CrvX1 = (R1 + r1) * cos(angle) - r1 * cos((R1 + r1) * angle / r1);
curveVertex(CrvX1, CrvY1);
}
endShape();
pop();
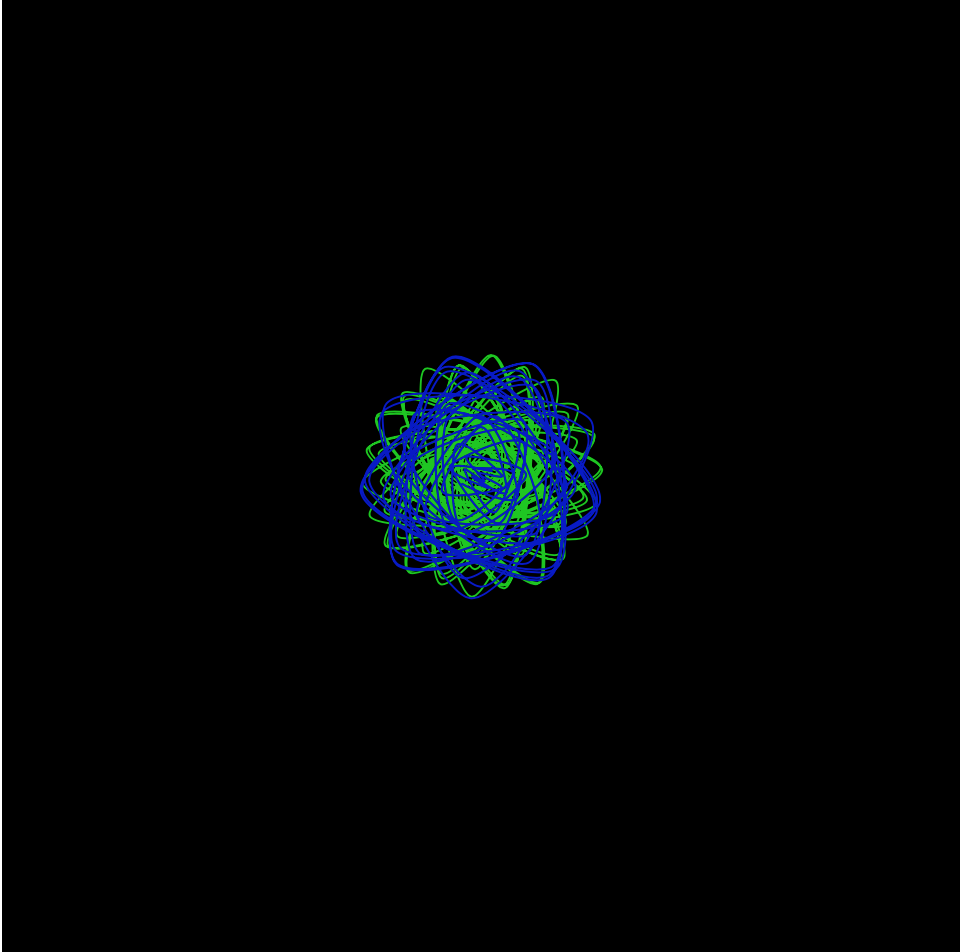
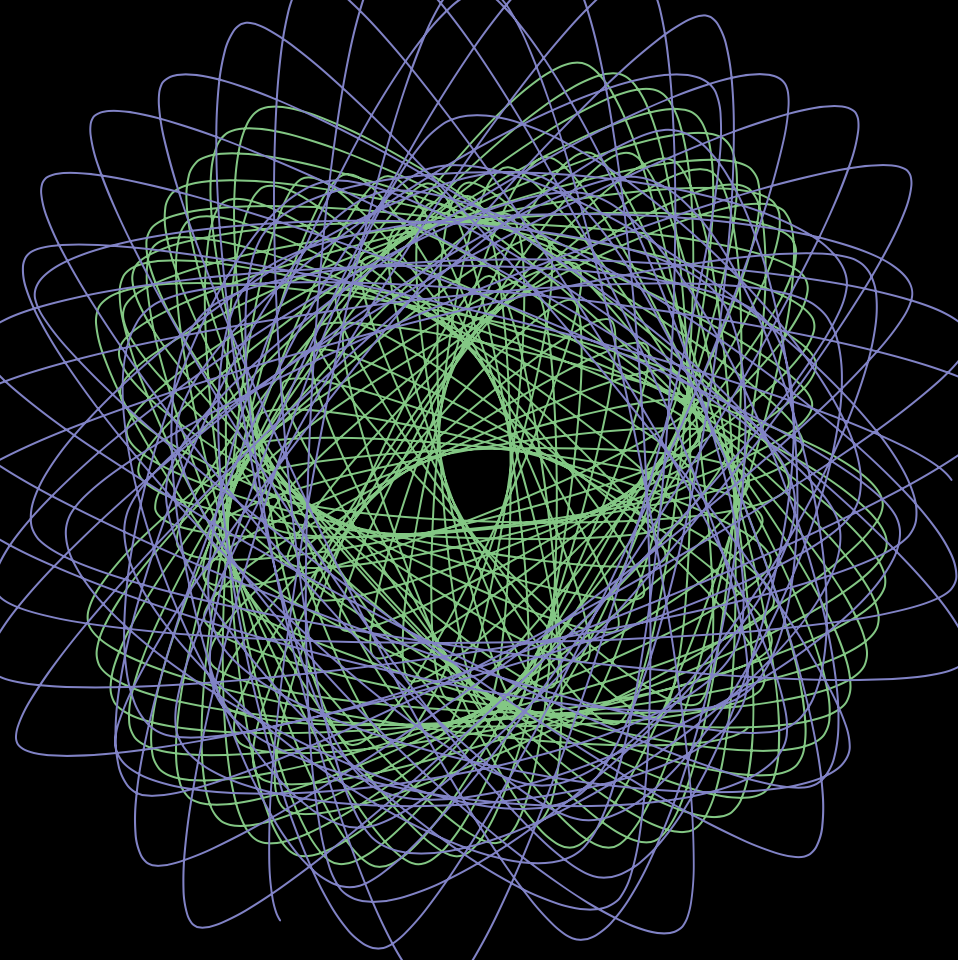
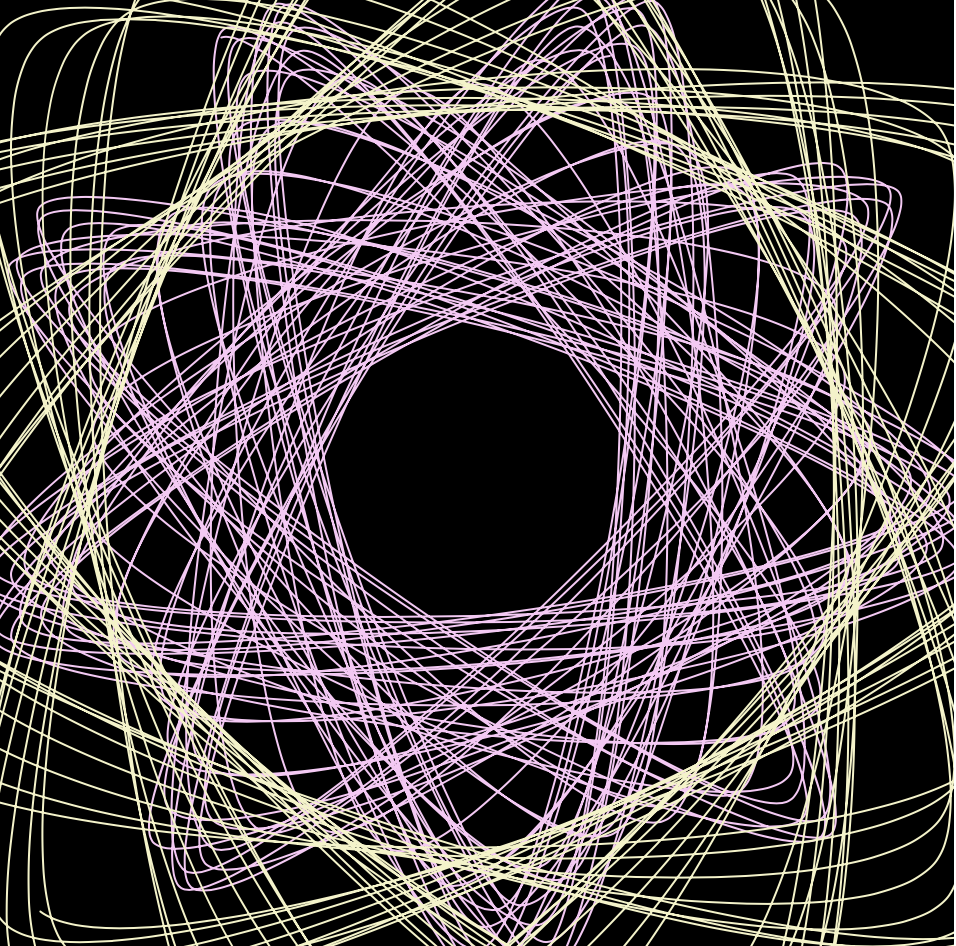
}In this project, I found it interesting to generate dynamic parametric drawing by understanding the mathematical equation of the epicycloid or hypercycloid, which is a plane curve produced by tracing the path of a chosen point on the circumference of a circle, which rolls without slipping around a fixed circle. Also, the variability of epicycloid itself is very flexible. By controlling variables such as the radius of the driving circle and the angle interval between each curve, the output image can be parametric and dynamic.
Epicycloid equation:


nice cvrs!
thx 🙂