Nadia Susanto – Project 07 – Curves

sketch

// Nadia Susanto
// Section B
// nsusanto@andrew.cmu.edu
// Project-07-Curves

var angle = 0;

function setup() {
    createCanvas(480, 480);
    background(220);
    angleMode(radians);
}

function draw() {
    //making the fill to be a combo of random colors
    var r = random(0, 100);
    var g = random(100, 150);
    var b = random(200, 275);
    frameRate(5);
    push();
    fill(r, g, b);
    translate(width/2, height/2); //drawn to be in the middle
    //rotating the asteroid
    angle += 1;
    rotate(angle);
    drawCurve(); //calling function
    pop();

}

function drawCurve() {
    var b = mouseY/2;
    var t = map(mouseY, 0, 200, 40, 120); //constraint

    //creating the astroid
    beginShape();
    for (var i = 0; i < 100; i++) {
      t = map(i, 0, 100, 0, TWO_PI);
      //reference from http://mathworld.wolfram.com/Astroid.html
      var x = 3 * b * cos(t) + b * cos(3 * t);
      var y = 3 * b * sin(t) - b * sin(3 * t);
      vertex(x, y);
    }
    endShape();


}

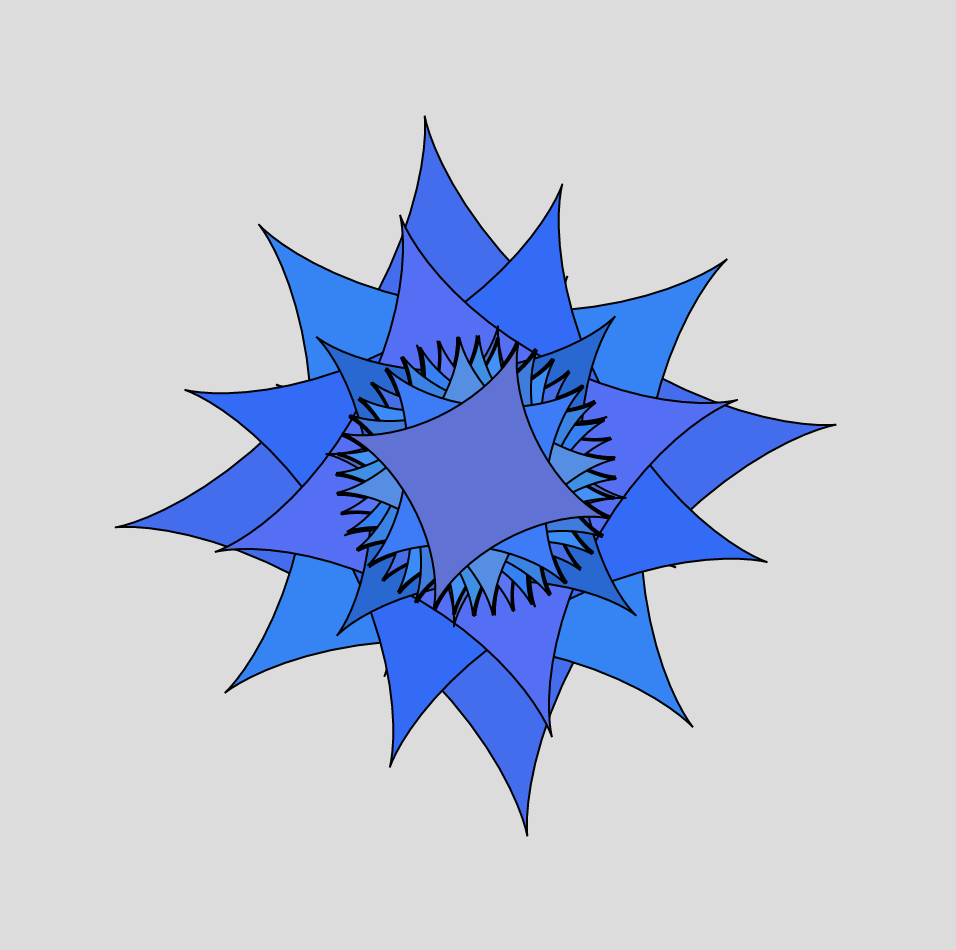
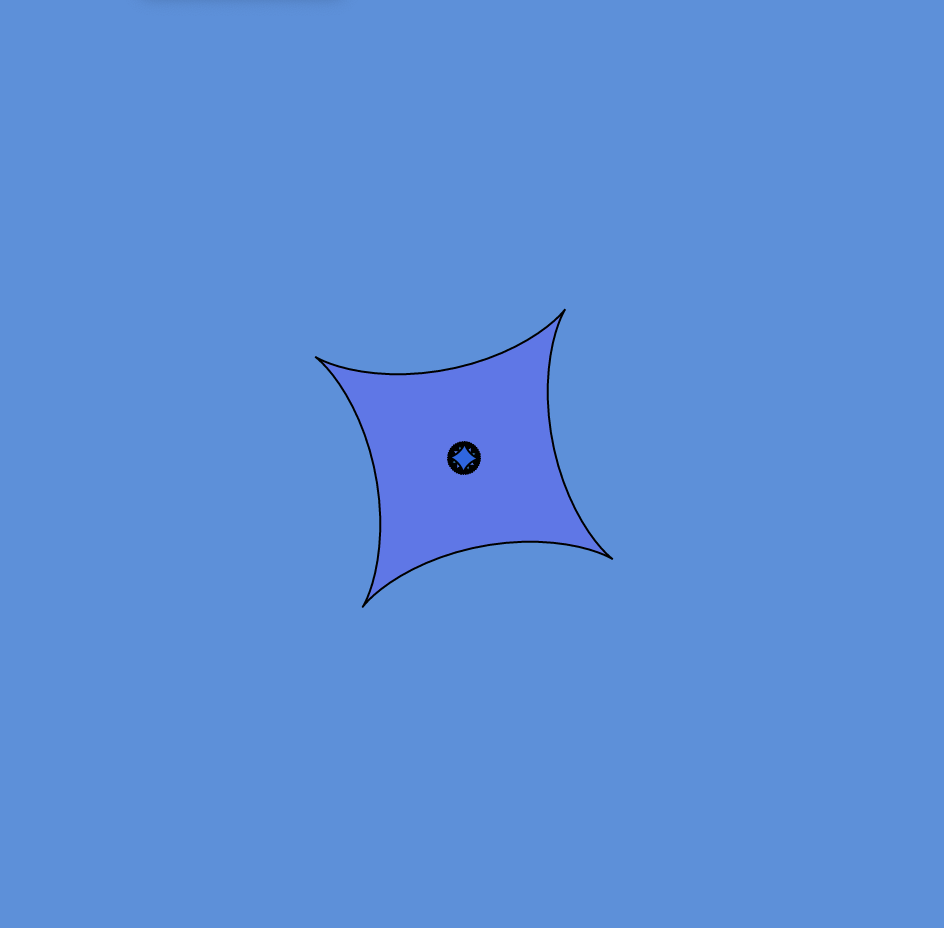
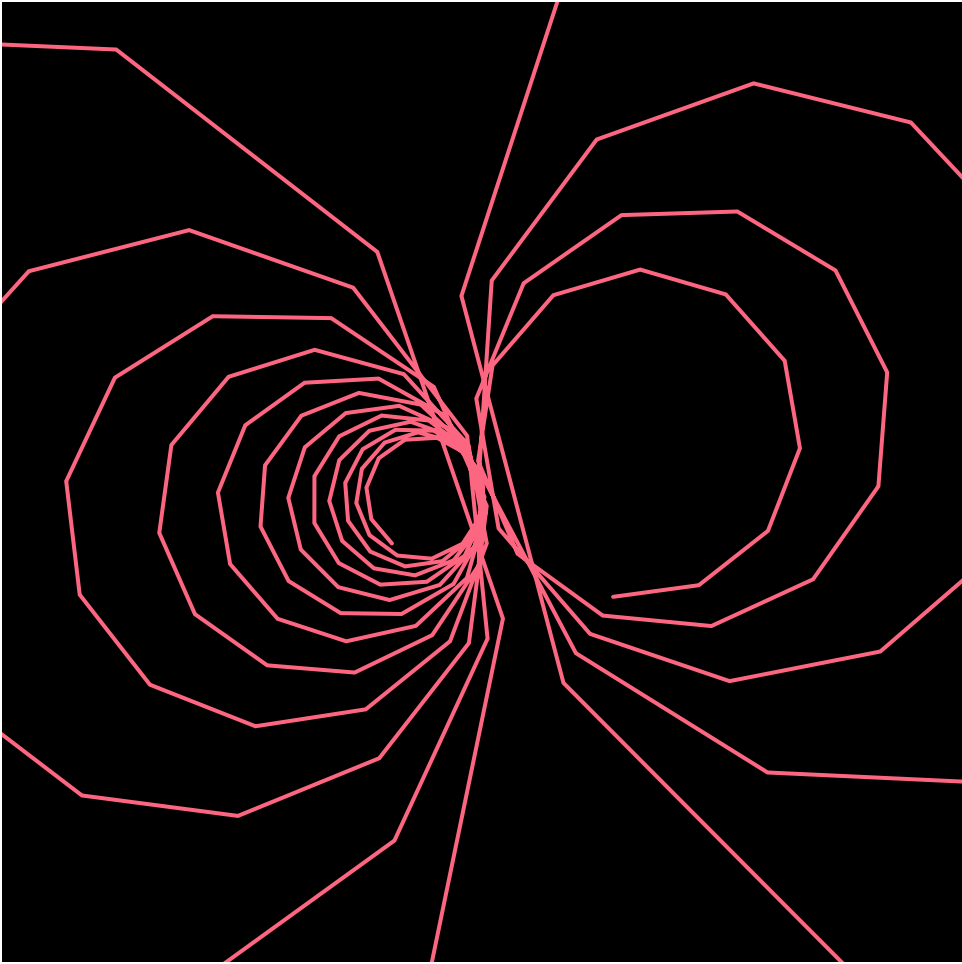
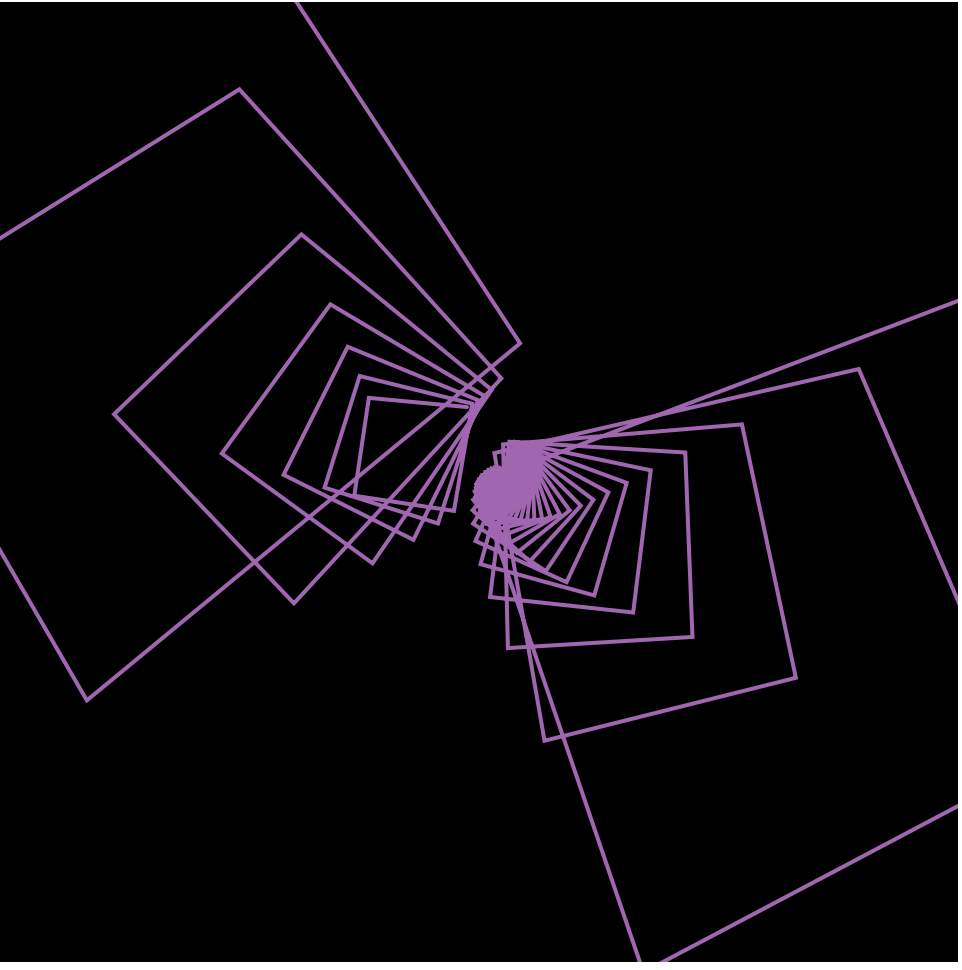
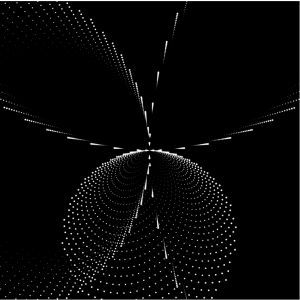
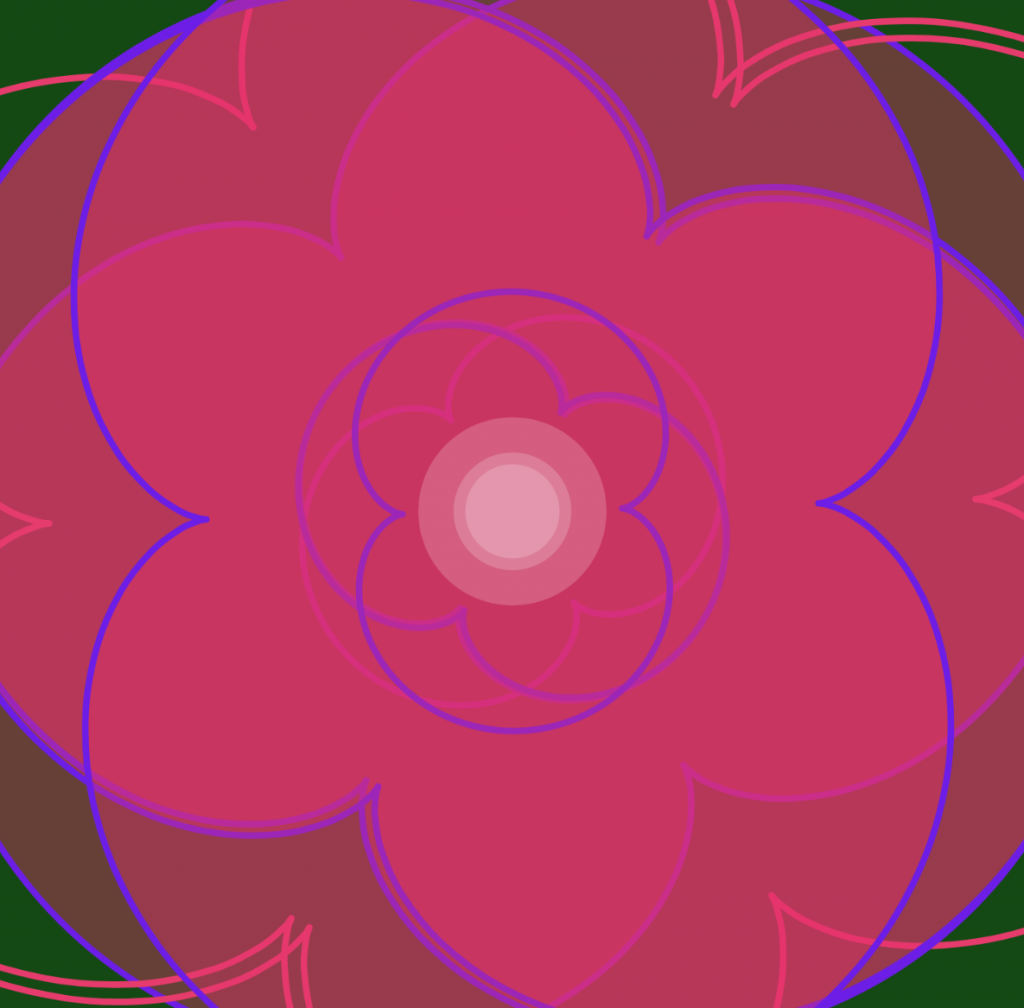
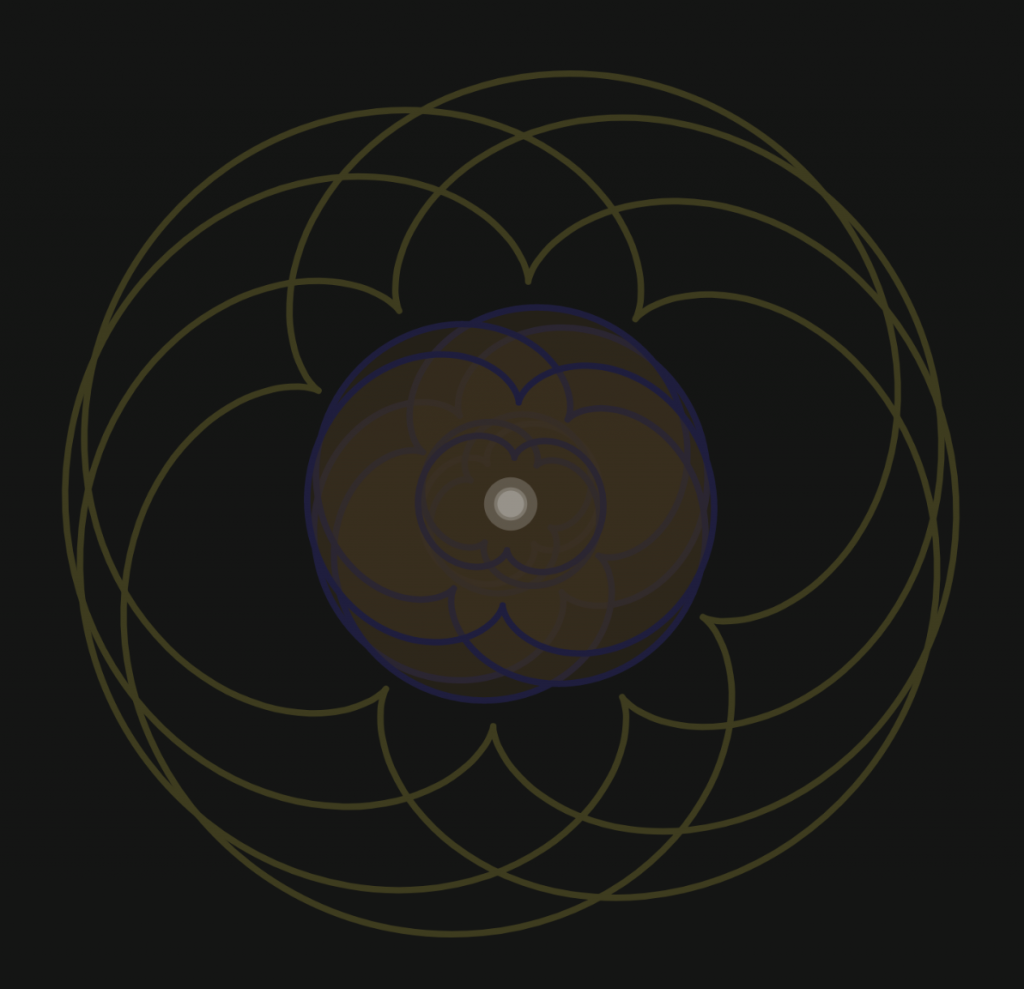
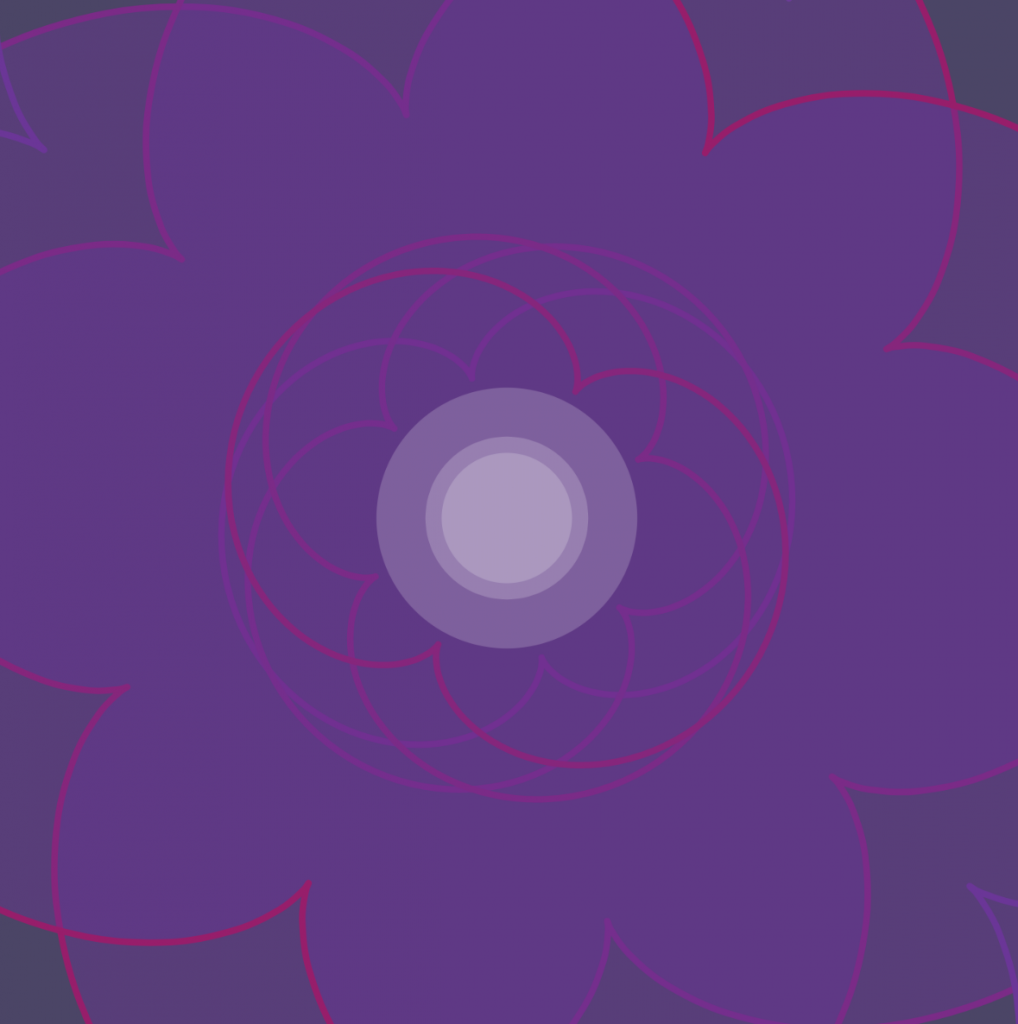
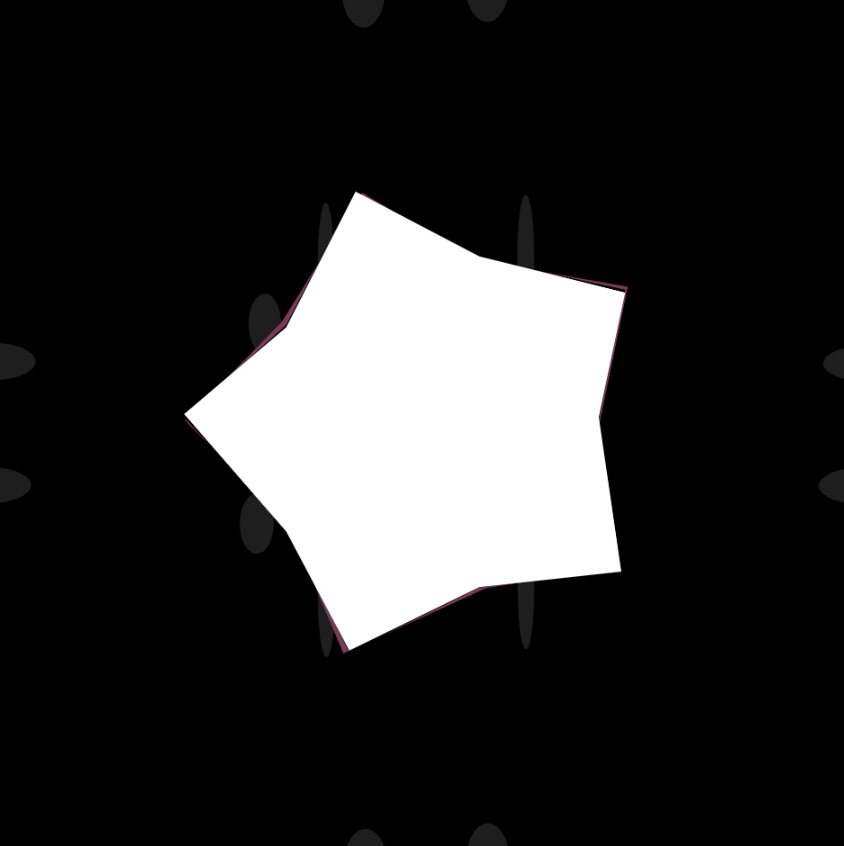
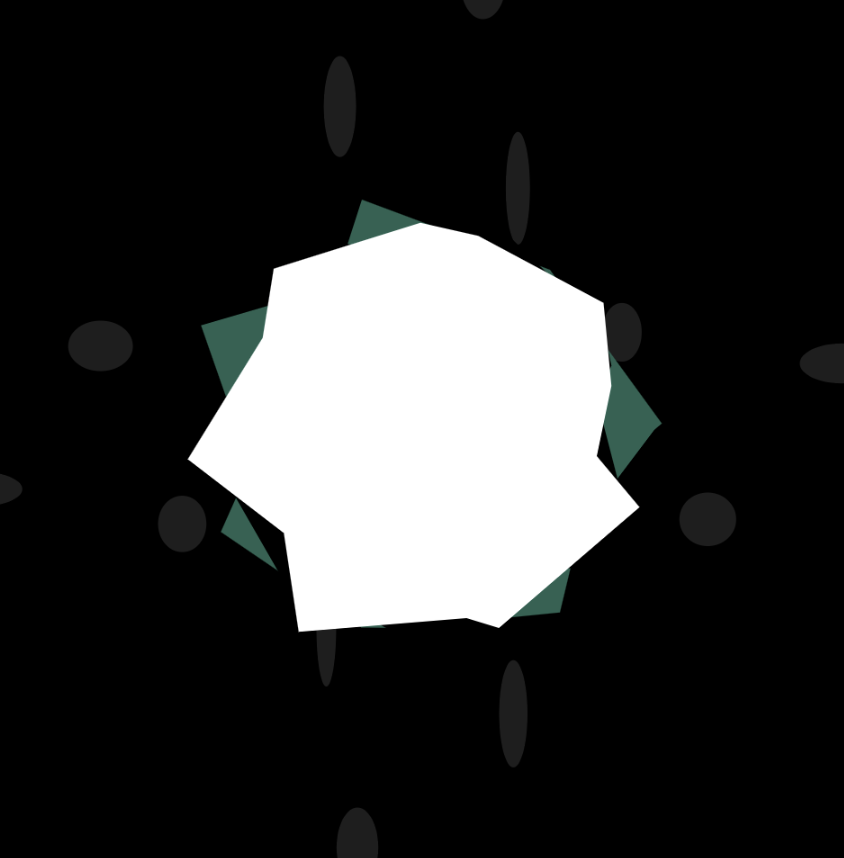
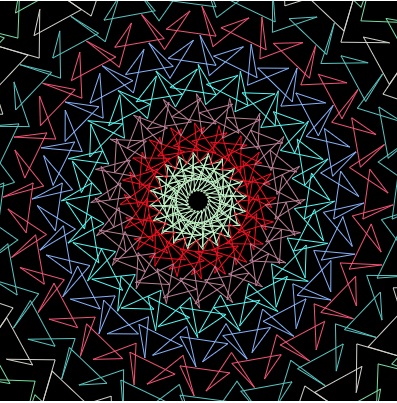
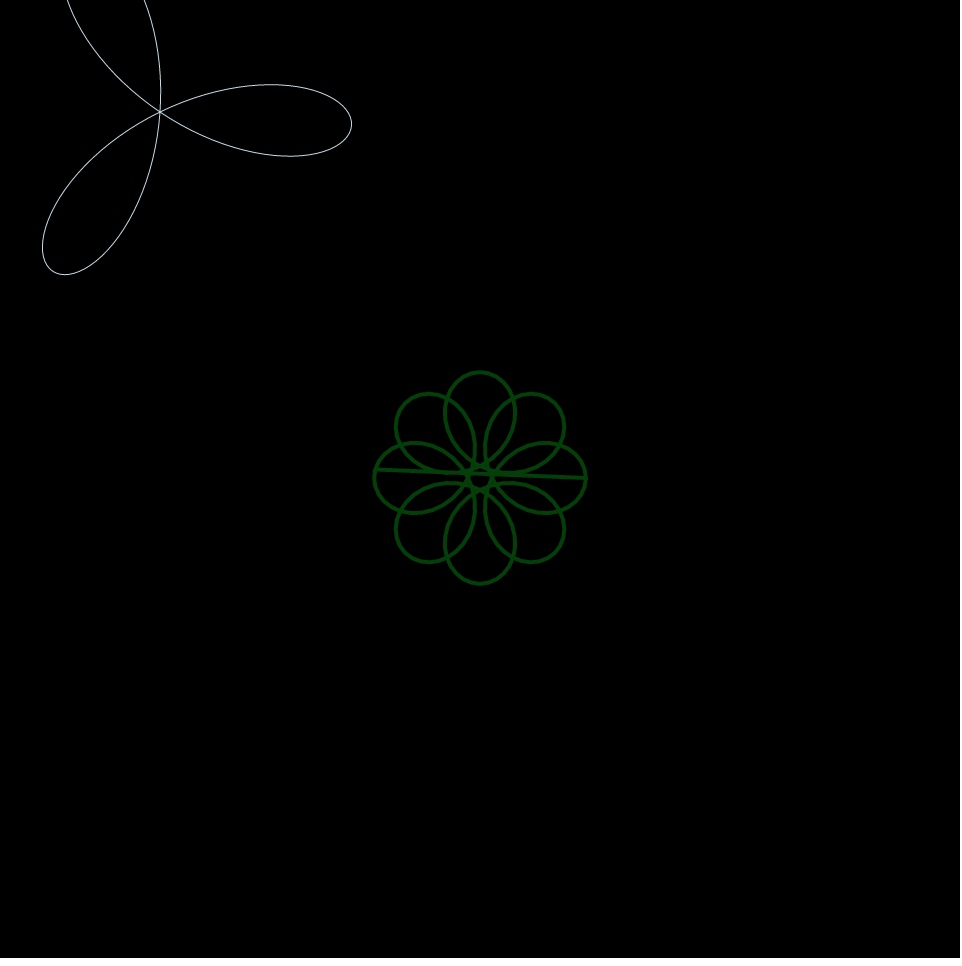
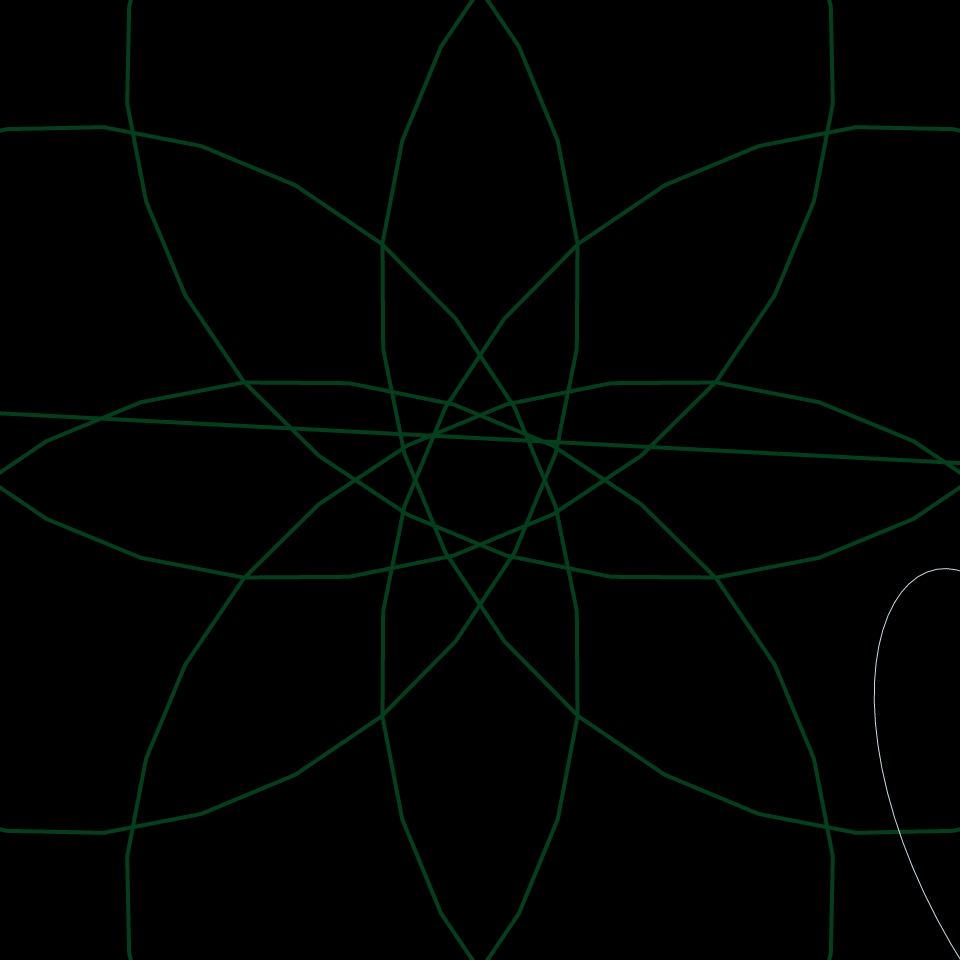
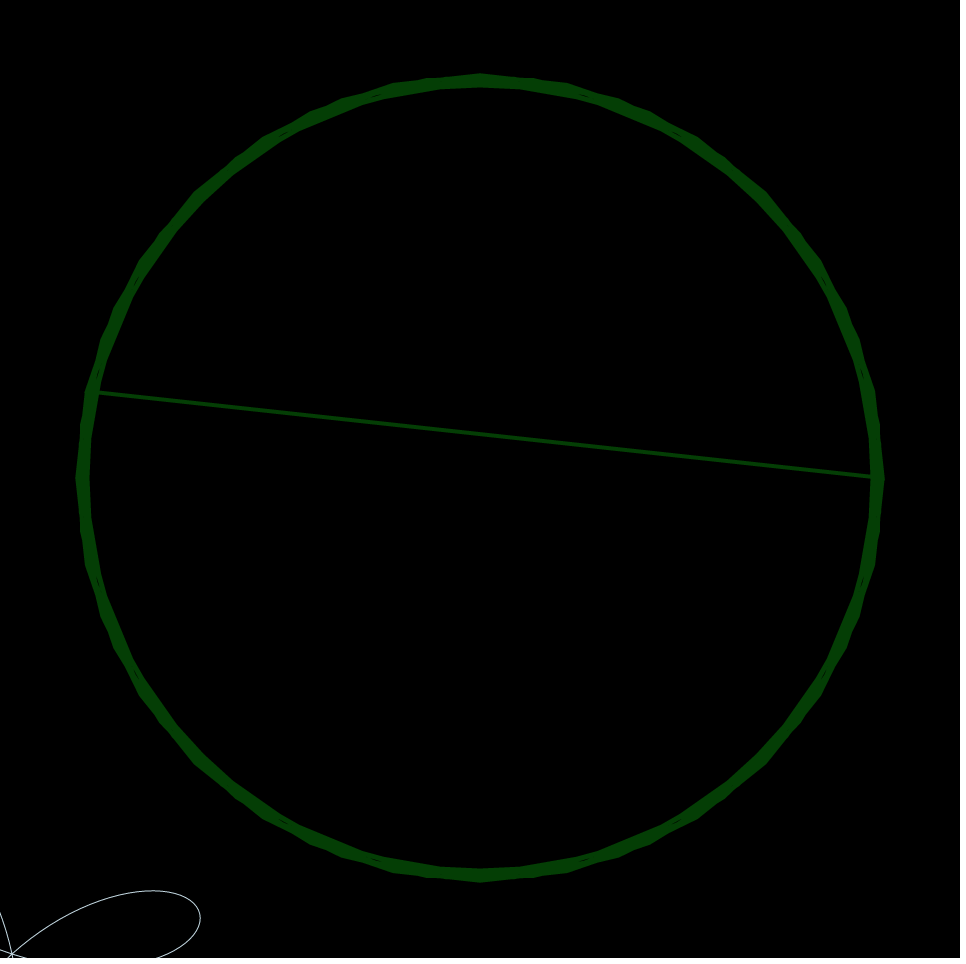
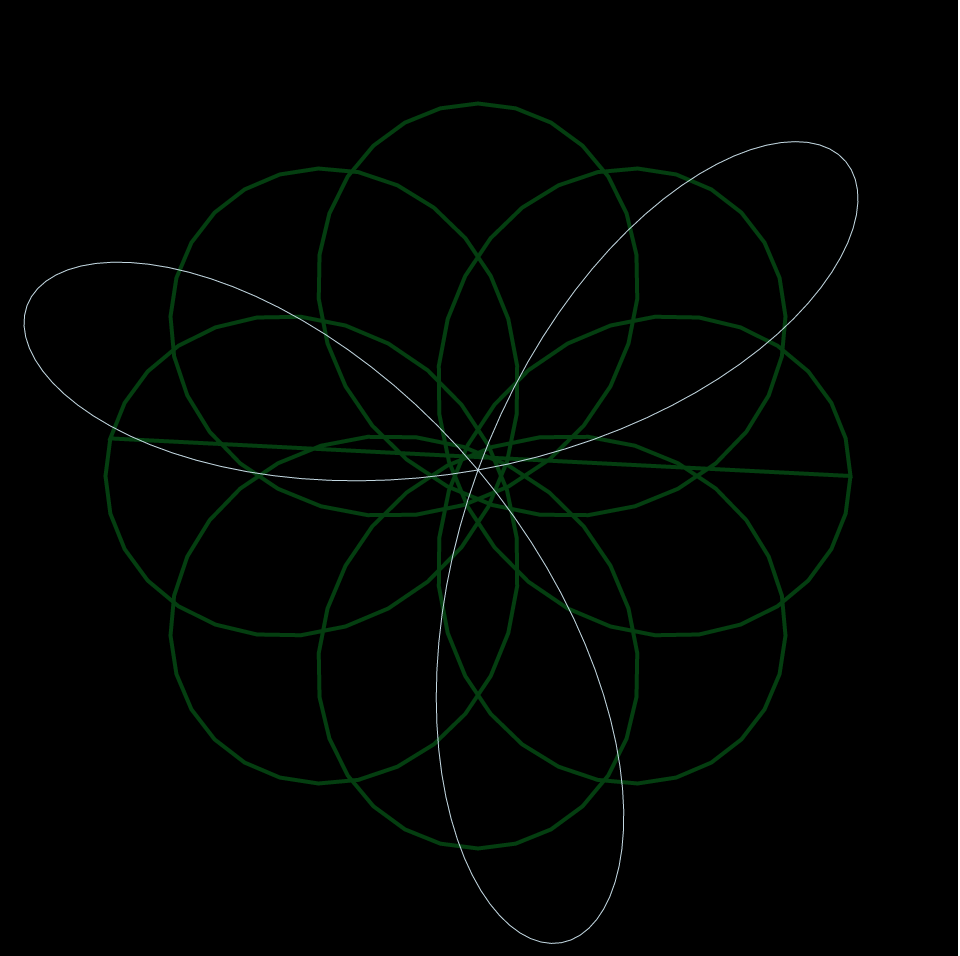
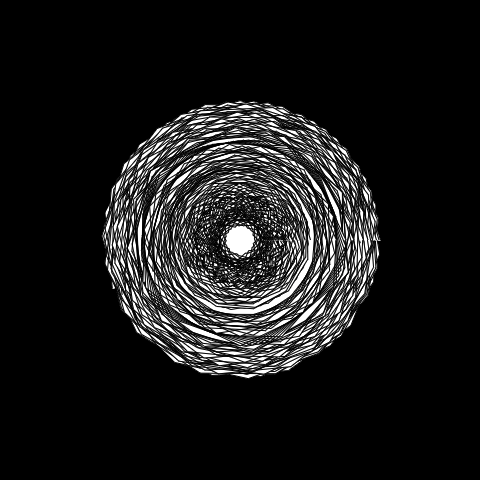
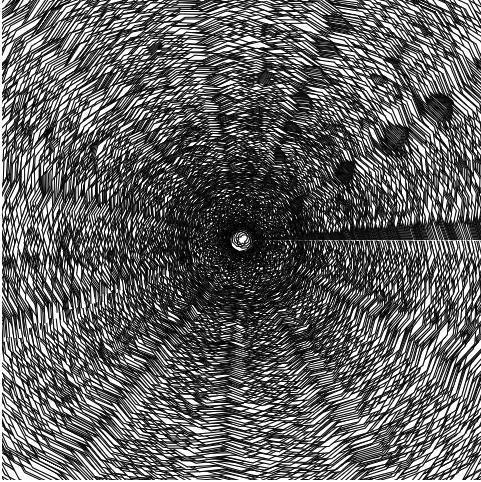
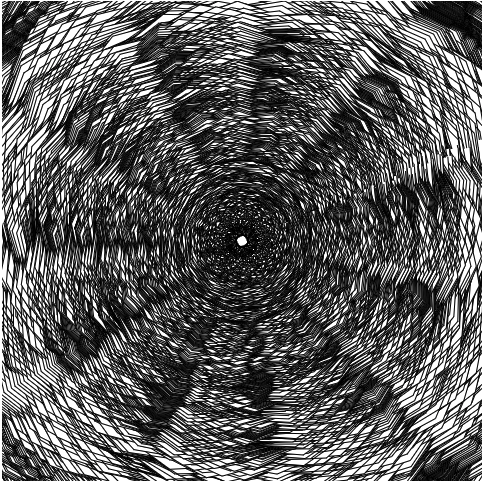
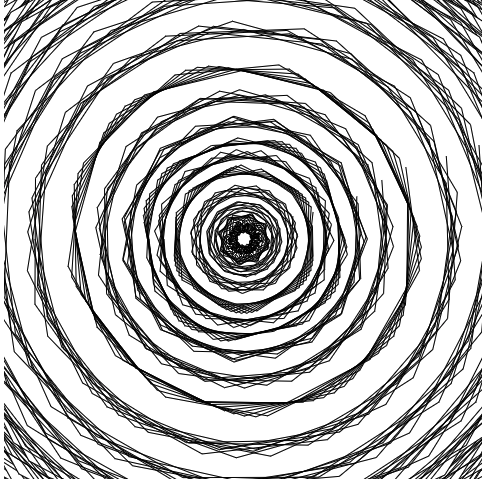
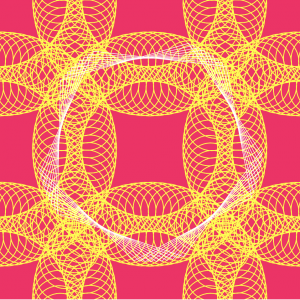
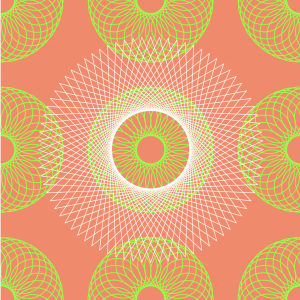
It was hard figuring out which curve to use as there were so many that were pretty, but I ended up choosing to go with the asteroid curve. I figured that a star-shaped curve could be beautiful especially when rotating. With the rotation it looks like a christmas tree star or it even looks flowerly-like. I also played around with the random colors and constrained it to be only blue/purple shades. I then used mouseX and mouse Y in order to determine the size of the asteroid. Overall, I am pretty happy with the result and it looks beautiful.

An example of this “flower-like” asteroid with multiple rotations
Another possible asteroid curve that looks like a ninja star

Shannon Ha – Project 07 – Curves

sketch

//Shannon Ha
//sha2@andrew.cmu.edu
//Section D
//Project 07 Curves
var nPoints = 200
var angle = 0

function setup() {
    createCanvas(480, 480);
}

function draw() {
	background(0);
	push();
	translate(width/2, height/2); // moves around center point
    if(mouseX > width/2){

        rotate(radians(angle)); //rotating curves and stop motion effect
        angle += 2 * mouseY/250;
    }
    drawCoch();
	pop();
}


function drawCoch(){
    //color change in stroke
    colorR = map(mouseX, 0, width, 0, 255);
    colorB = map(mouseY, 0, height, 0, 200);

    //stroke & fill
    strokeWeight(2);
    stroke(colorR, 100, colorB);
    noFill();

    //variable that change the size, shape, num of edges in curve
    a = map(mouseX, 0, 200, 0, width);

    beginShape();
    for (var i = 0; i < 200; i ++) {

        // set angle/t to loop in relation to mouse and positions curve
        var t = map(i, 0, 20, mouseY/20, mouseX/50);

        //paratmetric equation for cardioid
        x = (a * sin(t)*cos(t))/t ;
        y = a * sq(sin(t))/t;
        vertex(x,y);
    }
    endShape();
}

For this project, I spent a lot of time trying to find the right curve to use, and when I came across the Cochleoïd curve, I figured it would be interesting to create some sort of spiral hypnotic effect by mapping the variables and angles to the position of the mouse. As I experimented with this, I realized that I can play around with the mapping values to change the smoothness of the curve. I display this by changing smoothness of the curve according to mouseY. Overall it was a bit of a struggle trying to figure out how to change the variables in order for it to move while adding/detracting to the curve , but it was also an interesting and fun learning experience!

As you can see in these screenshots, the number of edges changes depending on mouse position!!!

Danny Cho – Project 7 – Curvezzzzzz


Sketch

I tried using Vivani spacial curve for this project. I was curious how a 3D function would appear on a 2D surface. It was definitely an interesting exploration, but was also difficult to play with. I wanted to make the visualization look as if the circles are constantly being absorbed into the void, but couldn’t make it happen. Below are some screenshots.

I also have a video too.

Screen Recording 2019-10-11 at 11.59.38 PM

//Danny Cho
//changjuc@andrew.cmu.edu
//Section A
//Composition with Curves


var a = 0;
 
function setup() {
  createCanvas(480, 480);
  frameRate(10);
} 

function draw() {
    background(0)
    translate(width / 2, height / 2)
    fill(255);
    a = mouseX;
    vivani();
    vivani();
    vivani();
    vivani();
}

function vivani() {
    var x = 0;
    var y = 0;
    var move = 1;
    strokeWeight(0);
    rotate(PI / 2);
    for (var i = 0; i < mouseY * 3; i++) {
        x = a * (1 + cos(i * 10));
        y = a * sin(i * 10);
        circle(x, y, i / 500)
        a += 0.1;
    }
}

Jasmine Lee – Project 07 – Curves

curvescomposition

//Jasmine Lee
//jasmine4@andrew.cmu.edu
//Section C
//Project-07 (Composition with Curves)

var points = 100; //helps control length of curves
var turn = 0; //controls speed of rotation

function setup() {
    createCanvas(480, 480);
}

function draw() {
    background(20, mouseX / 3, 20);

    //"normal" speed curves
    push();
    translate(width / 2, height / 2);
    rotate(radians(turn));
    turn ++;
    drawEpi();
    drawEpi2();
    drawEpi3();
    pop();

    //slowest set of curves
    push();
    translate(width / 2, height / 2);
    rotate(radians(turn / 2));
    turn ++;
    drawEpi();
    drawEpi2();
    drawEpi3();
    pop();

    //fastest spinning set of curves
    push();
    translate(width / 2, height / 2);
    rotate(radians(turn * 2));
    turn ++;
    drawEpi();
    drawEpi2();
    drawEpi3();
    pop();

    //faster spinning set of curves
    push();
    translate(width / 2, height / 2);
    rotate(radians(turn * 1.5));
    turn ++;
    drawEpi();
    drawEpi2();
    drawEpi3();
    pop();

    //creates center of flower
    noStroke();
    fill(255, 255, 255, 50);
    ellipse(width / 2, height / 2, mouseX / 2.5, mouseX / 2.5);
    fill(255, 255, 255, 50);
    ellipse(width / 2, height / 2, mouseX / 4, mouseX / 4);
    fill(255, 255, 255, 50);
    ellipse(width / 2, height / 2, mouseX / 5, mouseX / 5);

}

//draws the smaller epicycloid curve
function drawEpi() {
    var a = map(mouseX, 0, width, 10, 100);
    var b = a / 2;

    //curves
    strokeWeight(3);
    stroke(mouseX / 2, 30, mouseY / 2);
    noFill();
    beginShape();
    for (var i = 0; i < points; i ++) {
        var t = map(i, 0, 50, 0, TWO_PI);
        crvX = ((a + b) * cos(t)) - (b * cos(((a + b) / b) * t))
        crvY = ((a + b) * sin(t)) - (b * sin(((a + b) / b) * t))
        curveVertex(crvX, crvY);
    }
    endShape();
}

//draws the medium epicycloid shape (filled-in)
function drawEpi2() {
    var a = map(mouseX, 0, width, 10, 300);
    var b = a / 2;

    //curves
    fill(mouseY / 2, 50, mouseX / 2, 100);
    beginShape();
    for (var i = 0; i < points; i ++) {
        var t = map(i, 0, 50, 0, TWO_PI);
        crvX = ((a + b) * cos(t)) - (b * cos(((a + b) / b) * t))
        crvY = ((a + b) * sin(t)) - (b * sin(((a + b) / b) * t))
        curveVertex(crvX, crvY);
    }
    endShape();
}

//draws the biggest epicycloid curves
function drawEpi3() {
    var a = map(mouseX, 0, width, 60, 400);
    var b = a / 2;

    //curves
    stroke(mouseY / 2, 60, mouseX / 2);
    noFill();
    beginShape();
    for (var i = 0; i < points; i ++) {
        var t = map(i, 0, 50, 0, TWO_PI);
        crvX = ((a + b) * cos(t)) - (b * cos(((a + b) / b) * t))
        crvY = ((a + b) * sin(t)) - (b * sin(((a + b) / b) * t))
        curveVertex(crvX, crvY);
    }
    endShape();
}

The trickiest part of doing this project was figuring how to create the curves using the mathematical formulas. I had to carefully study the formula to understand it. For this project, I was inspired by the Camellia flowers, which has petals that look as if they’re rotating around the center. It was interesting to be able to see the different curves and colors generated by the movement of the mouse.

The flower is bigger when mouseX is greater (towards the right side of the screen).
The colors get darker and more muted as the cursor approaches the top-left corner of the screen.
The flower as it appears when the cursor is near the center of the canvas.

Project 7 Ellan Suder

These are different variations of the epitrochoid function. The number of points increases as mouseX increases, so as the mouse drags across from left to right the shape ‘unfolds’ from a line to a triangle to a polygon with several sides. As mouseY increases, this polygon into a more irregular shape dictated by the epitrochoid function. There are three of these shapes, each filled differently (white, black, random color) and with slight variations so that they don’t overlap perfectly. The background circles increase as theta/t/mouseX increases.

sketch

/*
Ellan Suder
15104 1 D
esuder@andrew.cmu.edu
Project-07
*/

var randomColor;
var noiset = 0;
var nPoints = 10;

function setup() {
  createCanvas(480, 480);
  noStroke();
}

function draw() {
    noiset+=0.01;
    randomColor = color(noise(noiset+ 180)*205,noise(noiset+160)*205,noise(noiset+60)*205);
    background(0);
  
    push();
    translate(width / 2, height / 2);
    var x;
    var y;
    var nPoints = 2 + mouseX / 40;
    var a = width/5;
    var b = a/5;
    var h = constrain(mouseY/20, 0, b);
    var ph = mouseX / 50.0;
    
    fill(30);
    for (var i = 0; i < nPoints; i++) {
        var t = map(i, 0, nPoints, 0, TWO_PI);
        var px = 300 * cos(t);
        var py = 350 * sin(t);
        ellipse(px, py/6, px/5, py/10);
        ellipse(py/6, px, px/10, py/5);
    }
    
    fill(randomColor);
    beginShape();
    for (var i = 0; i < nPoints; i++) {
        var t = map(i, 0, nPoints, 0, TWO_PI);
        
        x = (a + b) * cos(t) - h * cos(2 * ph + t * (a + b) / b);
        y = (a + b) * sin(t) - h * sin(t * (a + b) / b);
        vertex(x, y);
    }
    endShape(CLOSE);
  
    fill(0);
        beginShape();
    for (var i = 0; i < nPoints; i++) {
        var t = map(i, 0, nPoints, 0, TWO_PI);
        
        x = (a + b) * cos(t) - h * cos(t * (a + b) / b);
        y = (a + b) * sin(t) - h * sin(ph + t * (a + b) / b);
        vertex(x, y);
    }
    endShape(CLOSE);

    fill(255);
        beginShape();
    for (var i = 0; i < nPoints; i++) {
        var t = map(i, 0, nPoints, 0, TWO_PI);
        
        x = (a + b) * cos(t) - h * cos(t * (a + b) / b);
        y = (a + b) * sin(t) - h * sin(2 * ph + t * (a + b) / b);
        vertex(x, y);
    }
    endShape(CLOSE);
    pop();
}

Aaron Lee-Project-07

sketch

/*
Aaron Lee
//Section C
//sangwon2@andrew.cmu.edu
Project-07-Composistion with Curves
*/
         
function setup() {
  createCanvas(400,400);
  frameRate(10);
}

function draw() {
  background(0);

  for(var i=0; i<100; i++) {   

    stroke(random(255), random(255), random(255));
    noFill();       
    Hypo(i*30, mouseX);   
  }
}
//hypotrochoid
//http://mathworld.wolfram.com/Hypotrochoid.html
function Hypo(a, mouseY) {
  var x;
  var y; 

  var a;                  
  var b=a/40;            
  var h = constrain(mouseY/10, 0, a);   
  var ph = mouseX/50; 
  push();                
  translate(width/2, height/2);
  beginShape();
  for(var i=0; i<100; i++) {
    var t = map(i, 0, 100, 0, TWO_PI);
    x=(a-b)*cos(t) + h*cos(ph+t*(a-b)/b);
    y=(a-b)*sin(t) - h*sin(ph+t*(a-b)/b);
    vertex(x, y); 
  }
  endShape(CLOSE);
  pop();
}

In this project I was working mainly with Hypotrochoids in loop. I wanted to make series of psychedelic experience as the mouse scrolls.

Project-07-Curves

Trying to get the curve was pretty difficult. The website had a lot of equations on it and I picked through them to get the information I needed. Once I got the curve I wanted, the issue rose of how to implement it in the code. After experimenting for a bit and looking at the code given on the assignment instructions for reference, I eventually figured it out. After getting the curve to work, I changed some values so that it changed along with the mouse, making it interactive. I also added and changed other elements to make the image prettier, such as adding colors and flowers.

sketchsal

var num_points = 100;//number of points being drawn

function setup() {
    createCanvas(480, 480);
    frameRate(25);
}

function draw() {
    var hW = width / 2;//half of width
    var hH = height / 2;//half of height
    background("pink");
    for(var i = 0; i < 3; i++){//draws rows of elements
        for(var g = 0; g < 3; g++){//drawns columns of elements
        ellipse((width / 2) * i,(height / 2) * g, (mouseX / 4) * 1,
            (mouseX / 4) * 1);//circles being drawn
        }

    }
    //circles
    noStroke();
    fill(255, 232, 232);
    ellipse(120,120, 10,10);//upper left
    ellipse(360,120, 10,10);//upper right
    ellipse(120,360, 10,10);//lower left
    ellipse(360,360, 10,10);//lower right
    //flowers
    fill(255, 69, 69);
    ellipse(120,120, 5,15);//upper left
    ellipse(360,120, 5,15);//upper right
    ellipse(120,360, 5,15);//lower left
    ellipse(360,360, 5,15);//lower right

    fill(255, 117, 117);
    ellipse(120,120, 15,5);//upper left
    ellipse(360,120, 15,5);//upper right
    ellipse(120,360, 15,5);//lower left
    ellipse(360,360, 15,5);//lower right
    fill('red');//makes circles red
    stroke(0);//makes everything outlined

    //draw curve (Astroid) 
    push();
    translate(width / 2, height / 2);//(240,240)
    drawAstroid();
    pop();
}
function drawAstroid() {//function that draws curve
    var x;//calls x
    var y;//calls y
    var vx = mouseX / 5.0;//value of mouseX divided by 5 
    fill(255, 200, 200);//pink
    beginShape();//makes it so that the lines don't stay after being drawn
    //(there isn't a bunch of overlapping blackness)
    for (var i = 0; i < num_points; i++) {//increments elements from 0 to 100
        var t = map(i, 0, num_points, 0, TWO_PI);//runs curve from 0 to 2 pi
        
        x = vx * pow(cos(t * vx),3);//formula for x values
        y = vx * pow(sin(t * vx),3);//formula for y values
        vertex(x, y);
    }
    endShape(CLOSE);//ends shape
}

Before adding curve and circles
Finished product

Rachel Shin – Project 07- Curves

reshin-project07

/*Rachel Shin
reshin@andrew.cmu.edu
15-104 Section B
Project 07- Composition with Curves
*/

var numPoints = 300;
var angle = 0;


function setup() {
    createCanvas(480, 480)
    r = random(255);
    g = random(255);
    b = random(255);
}    


function draw() {
    background(0);

    push();
    translate(width / 2, height / 2); //center on canvas
    drawHypotrochoid();
    pop();

    push();
    translate(mouseX, mouseY); //center of curve based on mouse position
    rotate(radians(angle)); //rotates on center point
    drawTrifolium();
    pop();

    angle = angle + 4; // speed of rotation
}  
  
function drawHypotrochoid() { //http://mathworld.wolfram.com/Hypotrochoid.html
    var x;
    var y;
    
    //map boundaries
    var h = map(mouseY, 0, height, 0, 200); //size changes based on mouseY
    var a = map(mouseX, 0, width, 0, 200); //size changes based on mouseX
    var b = a / 8;

    //Hypotrochoid curve
    beginShape();
    for (var i = 0; i < numPoints; i ++) {
        stroke(r, g, b);
        strokeWeight(2);
        noFill();
        var t = map(i, 0, 200, 0, TWO_PI)
        x = (a - b) * cos(t) + h * cos(((a - b) / b) * t)
        y = (a - b) * sin(t) - h * sin(((a - b) / b) * t)
        vertex (x, y)
    }
    endShape(CLOSE);
}


function drawTrifolium() { //http://mathworld.wolfram.com/ConicalSpiral.html    
    var x;
    var y;
    var r;

    //constrain    
    var a = constrain(mouseX, width / 5, width / 2);
    
    //outline of light blue spinning trifolium
    noFill();
    stroke(195, 217, 227);
    strokeWeight(0.5);

    //Trifolium curve
    beginShape();
    for (var i = 0; i < numPoints; i++) {
        var t = map(i, 0, numPoints, 0, TWO_PI);
        r = - a * cos(3 * t);
        x = r * cos(t);
        y = r * sin(t);
        vertex(x, y);
    }
    endShape(CLOSE);
}

This project took me a while because it took me a while to figure out how to compute each curves. Maneuvering it around the canvas was more interesting for me because it allowed me observe how the code I wrote computed it to animate a certain way.

Minjae Jeong-Project-07

sketch

//Minjae Jeong
//Section B
//minjaej@andrew.cmu.edu
//Project-07


function setup() {
    createCanvas(480, 480);
    background('black');
}

function draw() {
    push();// draw in the middle
    translate(width / 2, height / 2);
    drawHypotrochoid();
    pop();
}

//Equations from http://mathworld.wolfram.com/Hypotrochoid.html
 function drawHypotrochoid() {
    var x;
    var y;
    var a1 = mouseX; //move mouse to control hypotrochoids drawing
    var a2 = mouseY;
    var h = 5;

    beginShape(); //draw hypotrochoid
    for (i = 0; i < 480; i += 5){
        var t = map(i, 0, 200, 0, width);
        x = (a1- a2) * cos(t) + h * cos(t * (a1 - a2) / a2);
        y = (a1- a2) * sin(t) - h * sin(t * (a1 - a2) / a2);
        vertex(x, y);
    }
    endShape();


}

This simple looking black and white drawing with hypotrochoids attracted me more than other colorful tries in many reasons. First of all, the first impression is very wild, and simple. With the mouse cursor starting at the middle of the canvas (240, 240), the canvas starts black, and creates white spaces as the mouse moves. The fun part is, the background will never be pitch black once you move your mouse.

The mouse movement is sensitive, the drawing can change in many ways according to the user control. Although it can’t go full black unless refreshing the page, the drawing can go all-white which can reset the drawing.

SooA Kim: Project-07-Curves


sketch

For this project, I tried to understand how curves work using cos() and sin(). So I spent time figuring out how to draw hypotrochoid after numerous attempt failed to get other curve forms.

Other forms that appear when you move your mouse:

/*SooA Kim
Section C
sookim@andrew.cmu.edu
Project 7: Composition with Curves
*/

var nPoints = 360;
var nPoints1 = nPoints * 10;
var angle = 1;

function setup() {
    createCanvas(480, 480);
    angleMode(RADIANS);
  }
  
function draw() {
    frameRate(24);
    var g = map(mouseX, 0, 480, 255, 0); //changing green color 
    background(255, g, 100);
    angle += 10

    //replicate hypotrochoid using for loop

      for (var px = 0; px < 1000 ; px += 240) {
          for (var py = 0; py < 1000; py += 240) {
            push();
            translate(px, py); 
            rotate(angle);
            Hypotrochoid();
            pop();
          } 
      }
    drawCurveOne();
}
    
function Hypotrochoid() {
    var r = map(mouseX, 0, 480, 0, 255); //for red color changes 
    var b = map(mouseY, 0, 480, 0, 255); //for blue

    strokeWeight(1.5);
    stroke(r, 255, b);
    noFill();
    beginShape();    

    var a = map(mouseX, 0, 480, 10, 120);
    var b = map(mouseY, 0, 480, 2, 10);
    var h = map(mouseY, 0, 480, 40, 120);

        for (var i = 0; i < nPoints1; i++) {
            t = map(i, 0, nPoints1, 0, TWO_PI);
//Reference from <mathworld.wolfram.com/Hypocycloid>
            var x = (a - b) * cos(t) + h * cos((a - b) / b * t);
            var y = (a - b) * sin(t) + h * sin((a - b) / b * t);
        
            vertex(x,y);
        }  

    endShape();
}

    function drawCurveOne() {
      stroke(255);
      strokeWeight(1);
      noFill();
      beginShape();
    
      //increase number of vertices of the curve 
      var nuV = map(mouseX, 0, width, HALF_PI, TWO_PI);
      
      for (var i = 0; i < nPoints; i+= nuV) {
          //applied i to cos() and sin() to see what happens  
          var x = 180 * cos(i) + width/2;
          var y = 180 * sin(i) + height/2;
          
          vertex(x,y);
      }
      endShape();
    }