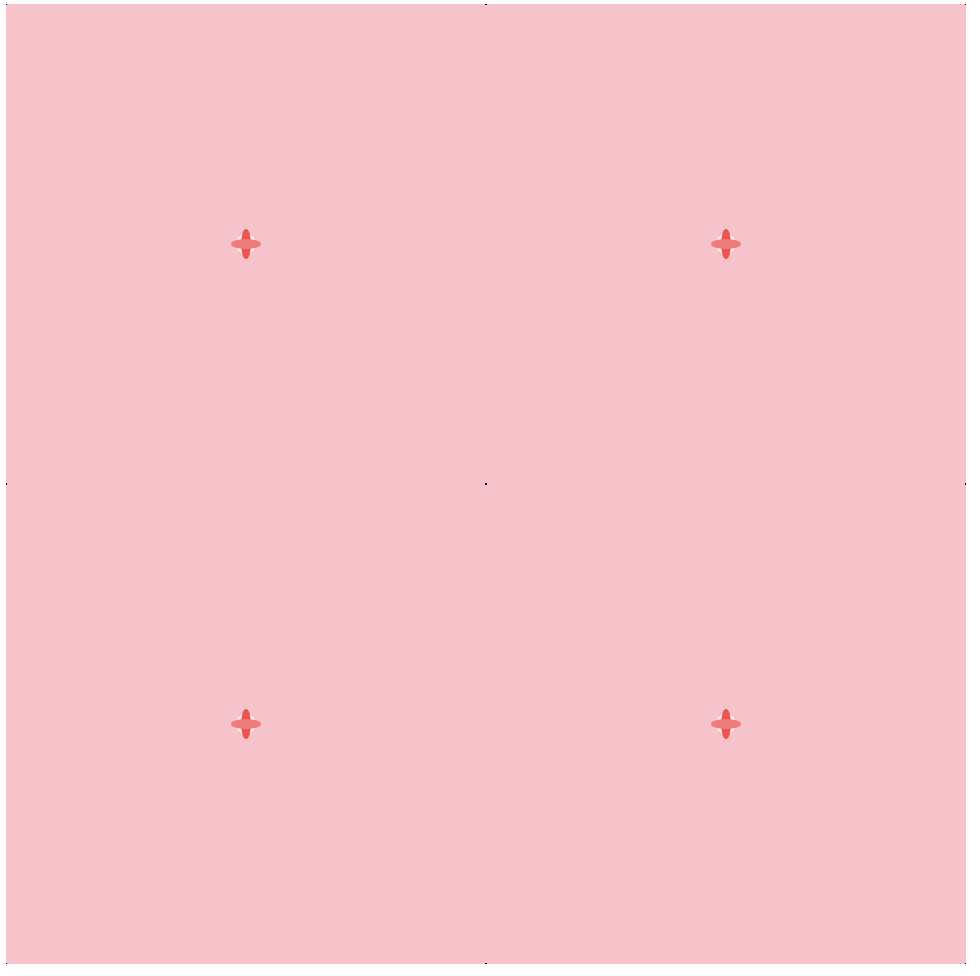
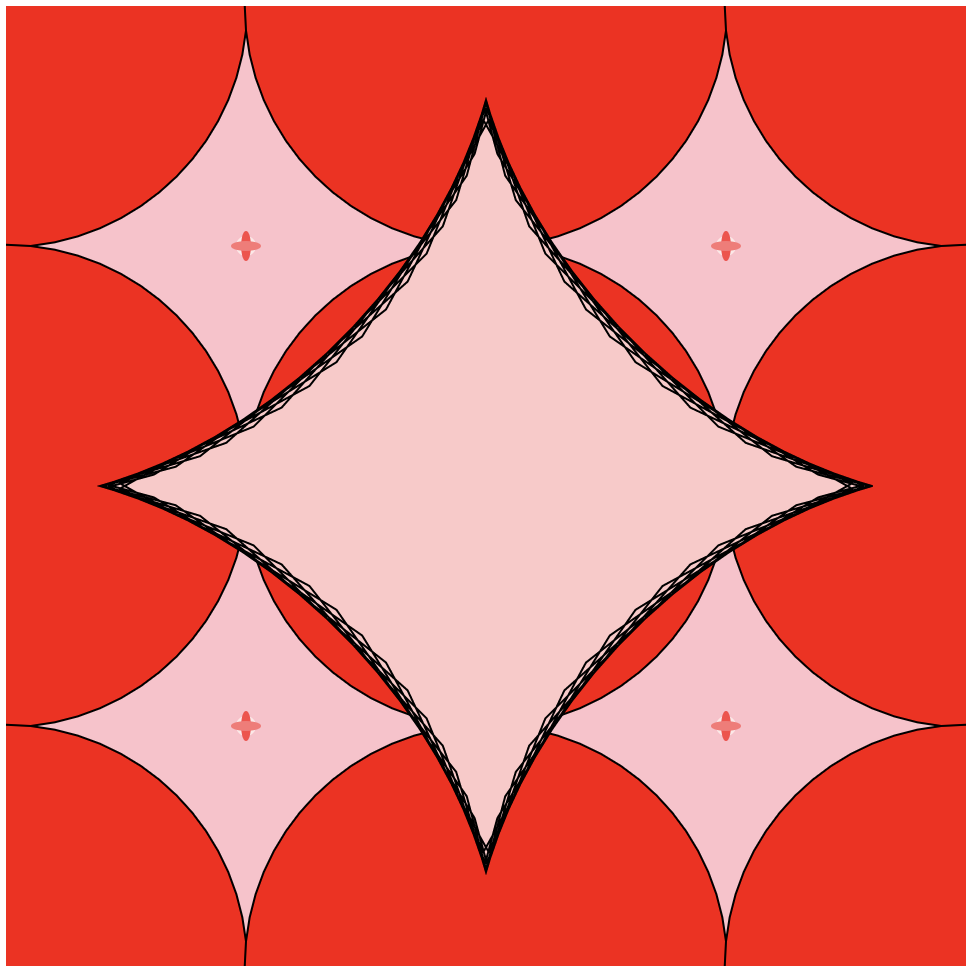
Trying to get the curve was pretty difficult. The website had a lot of equations on it and I picked through them to get the information I needed. Once I got the curve I wanted, the issue rose of how to implement it in the code. After experimenting for a bit and looking at the code given on the assignment instructions for reference, I eventually figured it out. After getting the curve to work, I changed some values so that it changed along with the mouse, making it interactive. I also added and changed other elements to make the image prettier, such as adding colors and flowers.
var num_points = 100;//number of points being drawn

function setup() {
    createCanvas(480, 480);
    frameRate(25);
}

function draw() {
    var hW = width / 2;//half of width
    var hH = height / 2;//half of height
    background("pink");
    for(var i = 0; i < 3; i++){//draws rows of elements
        for(var g = 0; g < 3; g++){//drawns columns of elements
        ellipse((width / 2) * i,(height / 2) * g, (mouseX / 4) * 1,
            (mouseX / 4) * 1);//circles being drawn
        }

    }
    //circles
    noStroke();
    fill(255, 232, 232);
    ellipse(120,120, 10,10);//upper left
    ellipse(360,120, 10,10);//upper right
    ellipse(120,360, 10,10);//lower left
    ellipse(360,360, 10,10);//lower right
    //flowers
    fill(255, 69, 69);
    ellipse(120,120, 5,15);//upper left
    ellipse(360,120, 5,15);//upper right
    ellipse(120,360, 5,15);//lower left
    ellipse(360,360, 5,15);//lower right

    fill(255, 117, 117);
    ellipse(120,120, 15,5);//upper left
    ellipse(360,120, 15,5);//upper right
    ellipse(120,360, 15,5);//lower left
    ellipse(360,360, 15,5);//lower right
    fill('red');//makes circles red
    stroke(0);//makes everything outlined

    //draw curve (Astroid)
    push();
    translate(width / 2, height / 2);//(240,240)
    drawAstroid();
    pop();
}
function drawAstroid() {//function that draws curve
    var x;//calls x
    var y;//calls y
    var vx = mouseX / 5.0;//value of mouseX divided by 5
    fill(255, 200, 200);//pink
    beginShape();//makes it so that the lines don't stay after being drawn
    //(there isn't a bunch of overlapping blackness)
    for (var i = 0; i < num_points; i++) {//increments elements from 0 to 100
        var t = map(i, 0, num_points, 0, TWO_PI);//runs curve from 0 to 2 pi

        x = vx * pow(cos(t * vx),3);//formula for x values
        y = vx * pow(sin(t * vx),3);//formula for y values
        vertex(x, y);
    }
    endShape(CLOSE);//ends shape
}

![[OLD FALL 2019] 15-104 • Introduction to Computing for Creative Practice](wp-content/uploads/2020/08/stop-banner.png)