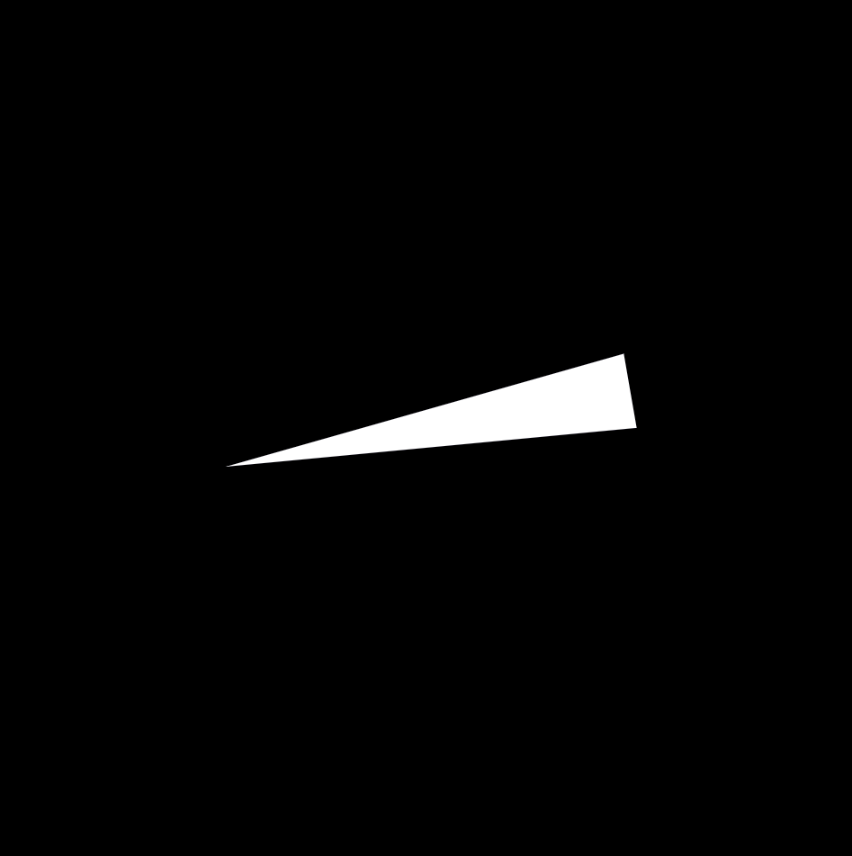
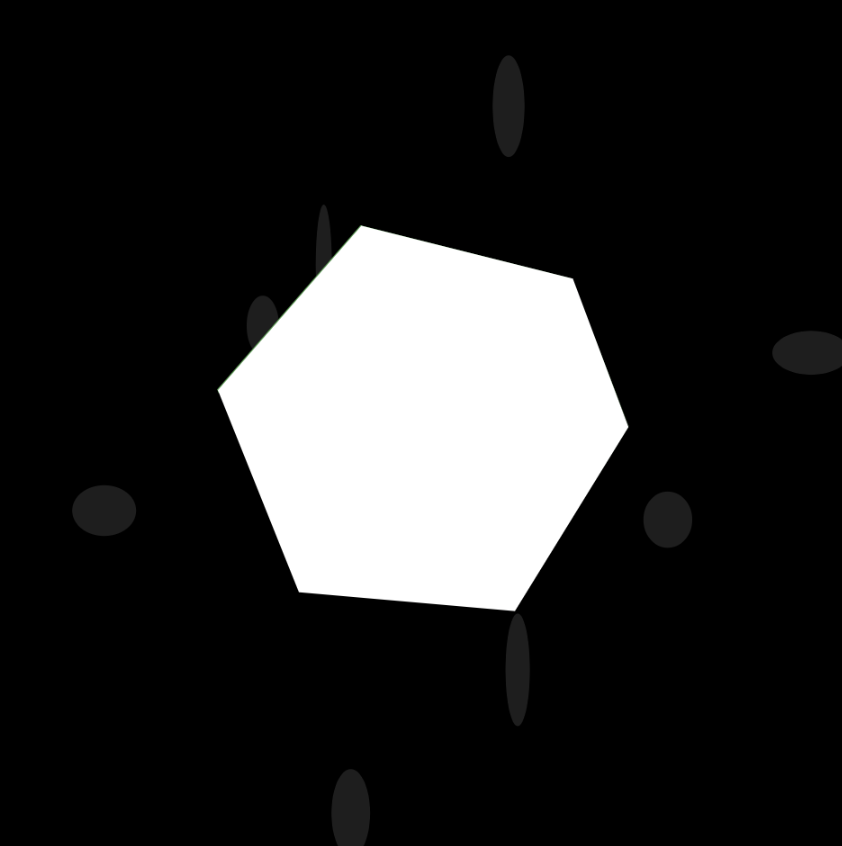
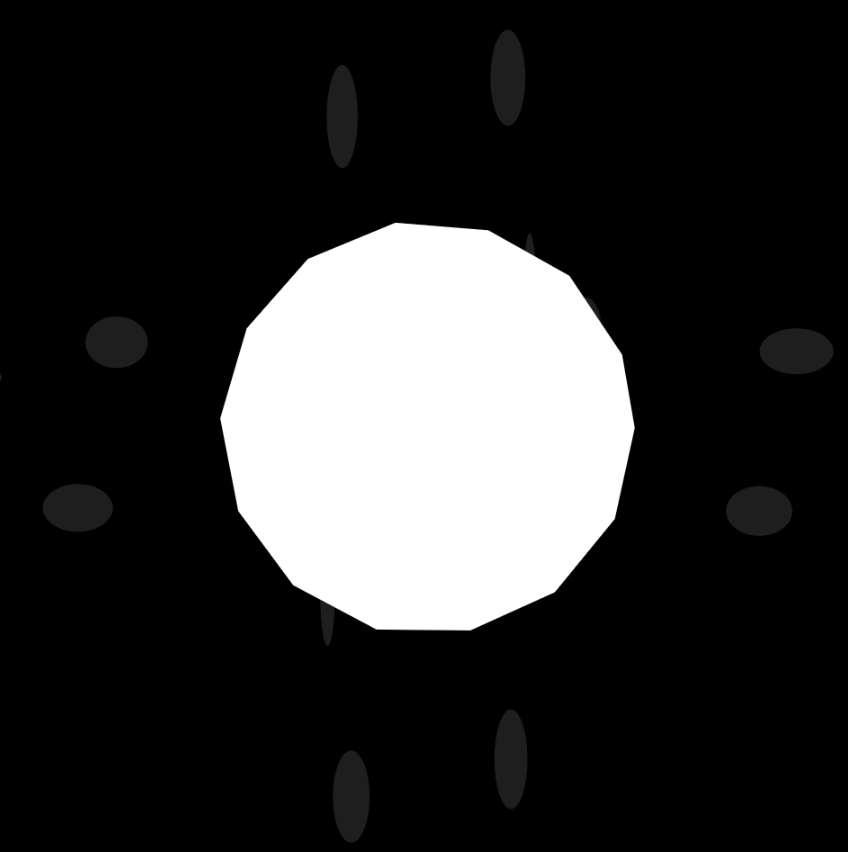
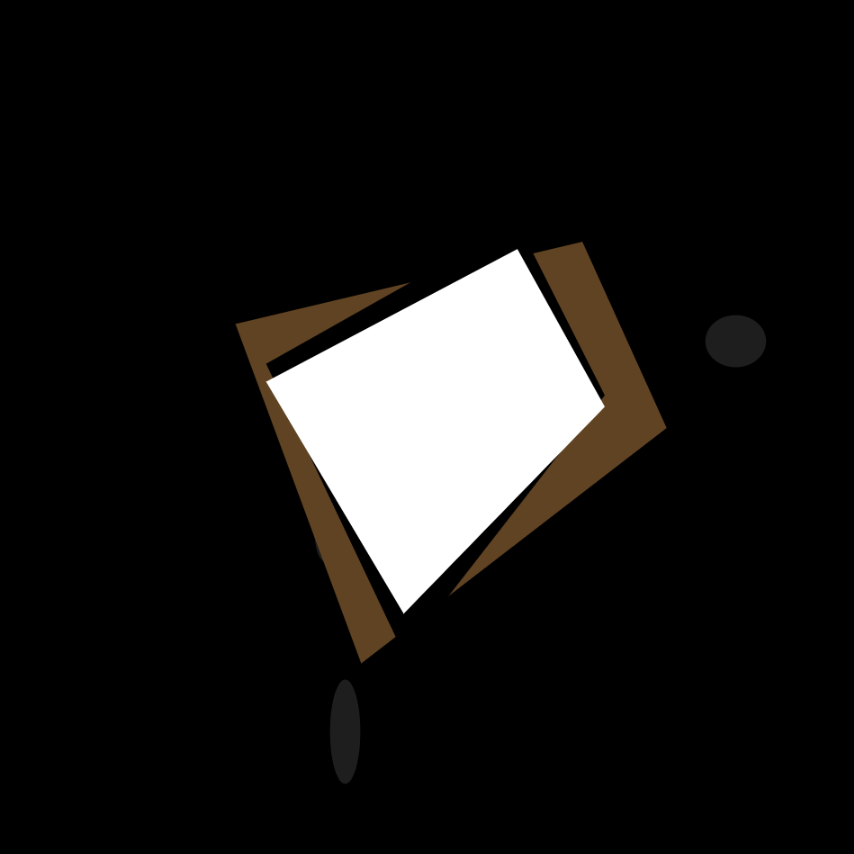
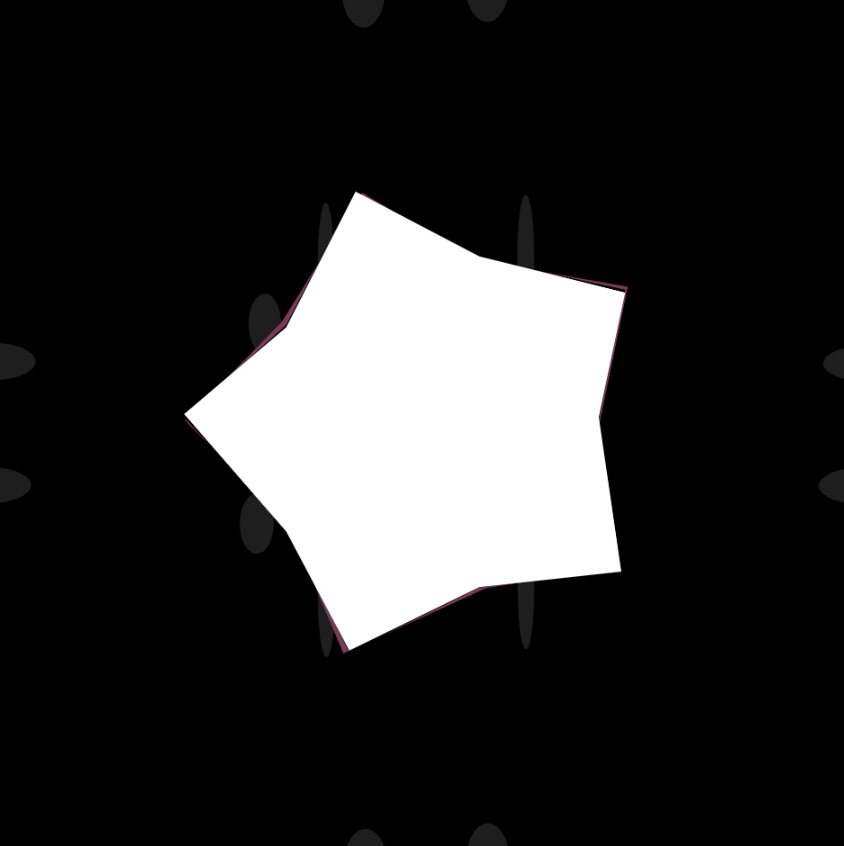
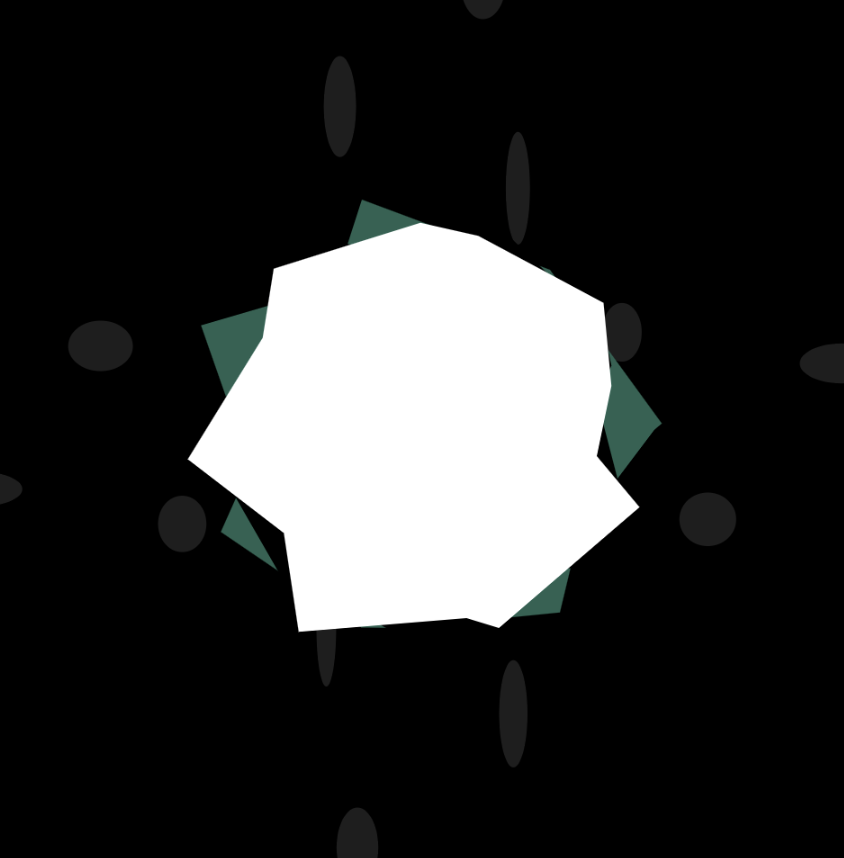
These are different variations of the epitrochoid function. The number of points increases as mouseX increases, so as the mouse drags across from left to right the shape ‘unfolds’ from a line to a triangle to a polygon with several sides. As mouseY increases, this polygon into a more irregular shape dictated by the epitrochoid function. There are three of these shapes, each filled differently (white, black, random color) and with slight variations so that they don’t overlap perfectly. The background circles increase as theta/t/mouseX increases.
/*
Ellan Suder
15104 1 D
esuder@andrew.cmu.edu
Project-07
*/

var randomColor;
var noiset = 0;
var nPoints = 10;

function setup() {
  createCanvas(480, 480);
  noStroke();
}

function draw() {
    noiset+=0.01;
    randomColor = color(noise(noiset+ 180)*205,noise(noiset+160)*205,noise(noiset+60)*205);
    background(0);

    push();
    translate(width / 2, height / 2);
    var x;
    var y;
    var nPoints = 2 + mouseX / 40;
    var a = width/5;
    var b = a/5;
    var h = constrain(mouseY/20, 0, b);
    var ph = mouseX / 50.0;

    fill(30);
    for (var i = 0; i < nPoints; i++) {
        var t = map(i, 0, nPoints, 0, TWO_PI);
        var px = 300 * cos(t);
        var py = 350 * sin(t);
        ellipse(px, py/6, px/5, py/10);
        ellipse(py/6, px, px/10, py/5);
    }

    fill(randomColor);
    beginShape();
    for (var i = 0; i < nPoints; i++) {
        var t = map(i, 0, nPoints, 0, TWO_PI);

        x = (a + b) * cos(t) - h * cos(2 * ph + t * (a + b) / b);
        y = (a + b) * sin(t) - h * sin(t * (a + b) / b);
        vertex(x, y);
    }
    endShape(CLOSE);

    fill(0);
        beginShape();
    for (var i = 0; i < nPoints; i++) {
        var t = map(i, 0, nPoints, 0, TWO_PI);

        x = (a + b) * cos(t) - h * cos(t * (a + b) / b);
        y = (a + b) * sin(t) - h * sin(ph + t * (a + b) / b);
        vertex(x, y);
    }
    endShape(CLOSE);

    fill(255);
        beginShape();
    for (var i = 0; i < nPoints; i++) {
        var t = map(i, 0, nPoints, 0, TWO_PI);

        x = (a + b) * cos(t) - h * cos(t * (a + b) / b);
        y = (a + b) * sin(t) - h * sin(2 * ph + t * (a + b) / b);
        vertex(x, y);
    }
    endShape(CLOSE);
    pop();
}![[OLD FALL 2019] 15-104 • Introduction to Computing for Creative Practice](wp-content/uploads/2020/08/stop-banner.png)
