//Shannon Ha
//sha2@andrew.cmu.edu
//Section D
//Project 07 Curves
var nPoints = 200
var angle = 0

function setup() {
    createCanvas(480, 480);
}

function draw() {
	background(0);
	push();
	translate(width/2, height/2); // moves around center point
    if(mouseX > width/2){

        rotate(radians(angle)); //rotating curves and stop motion effect
        angle += 2 * mouseY/250;
    }
    drawCoch();
	pop();
}


function drawCoch(){
    //color change in stroke
    colorR = map(mouseX, 0, width, 0, 255);
    colorB = map(mouseY, 0, height, 0, 200);

    //stroke & fill
    strokeWeight(2);
    stroke(colorR, 100, colorB);
    noFill();

    //variable that change the size, shape, num of edges in curve
    a = map(mouseX, 0, 200, 0, width);

    beginShape();
    for (var i = 0; i < 200; i ++) {

        // set angle/t to loop in relation to mouse and positions curve
        var t = map(i, 0, 20, mouseY/20, mouseX/50);

        //paratmetric equation for cardioid
        x = (a * sin(t)*cos(t))/t ;
        y = a * sq(sin(t))/t;
        vertex(x,y);
    }
    endShape();
}
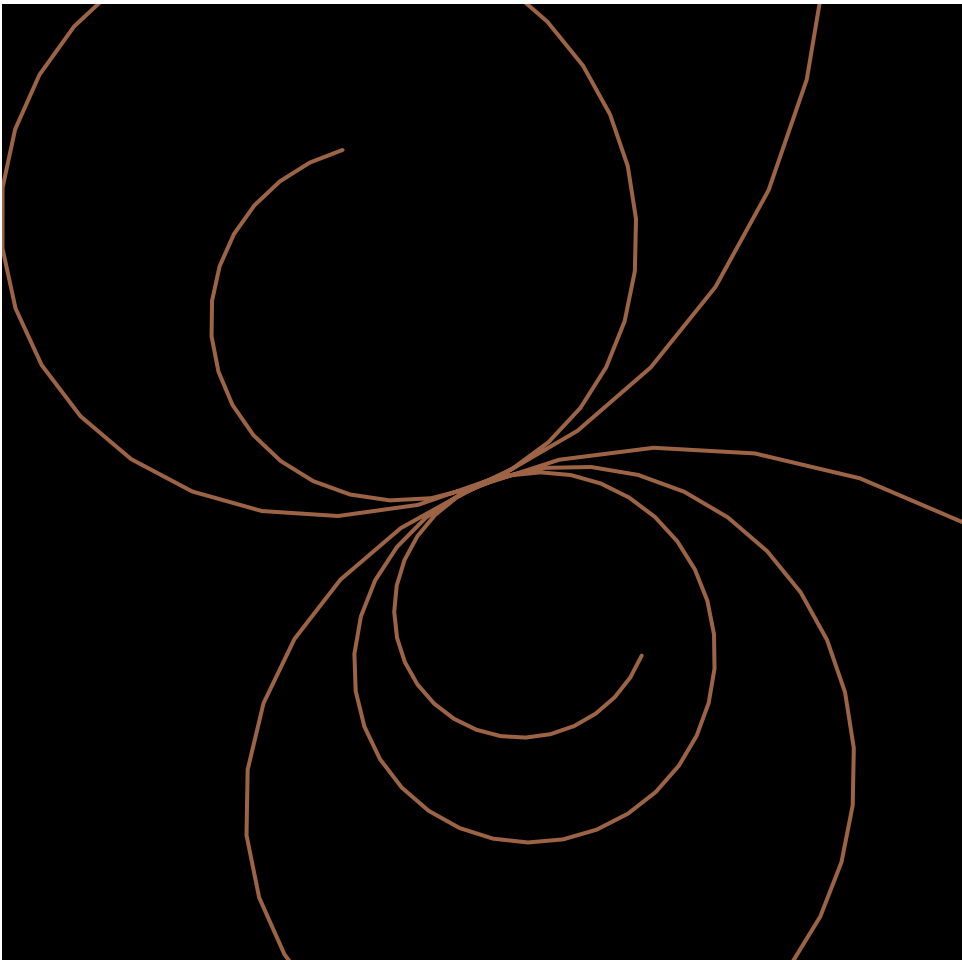
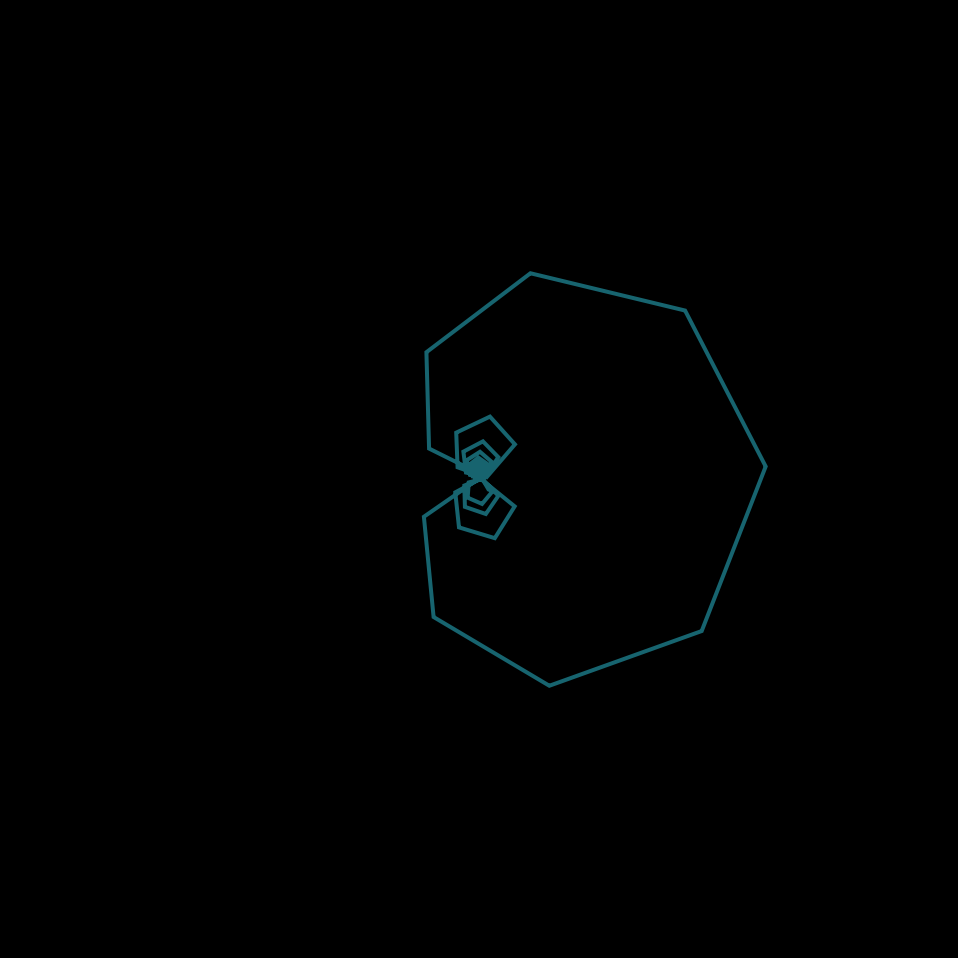
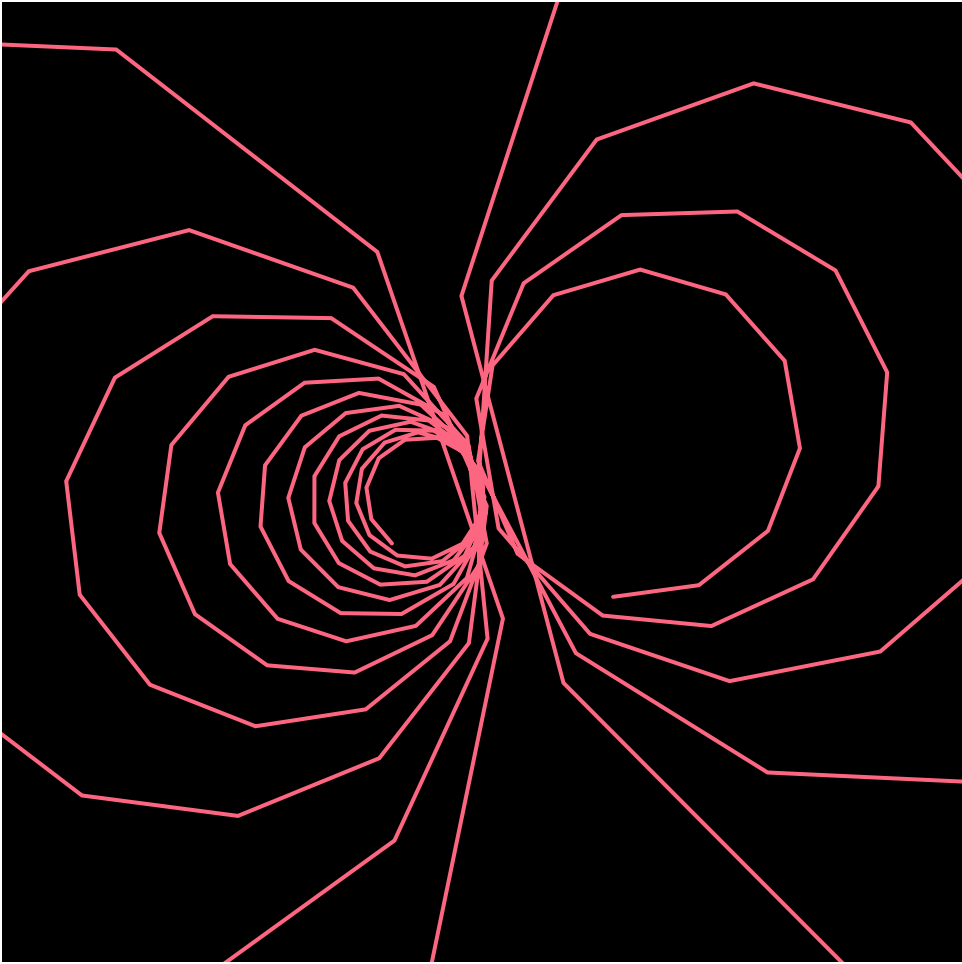
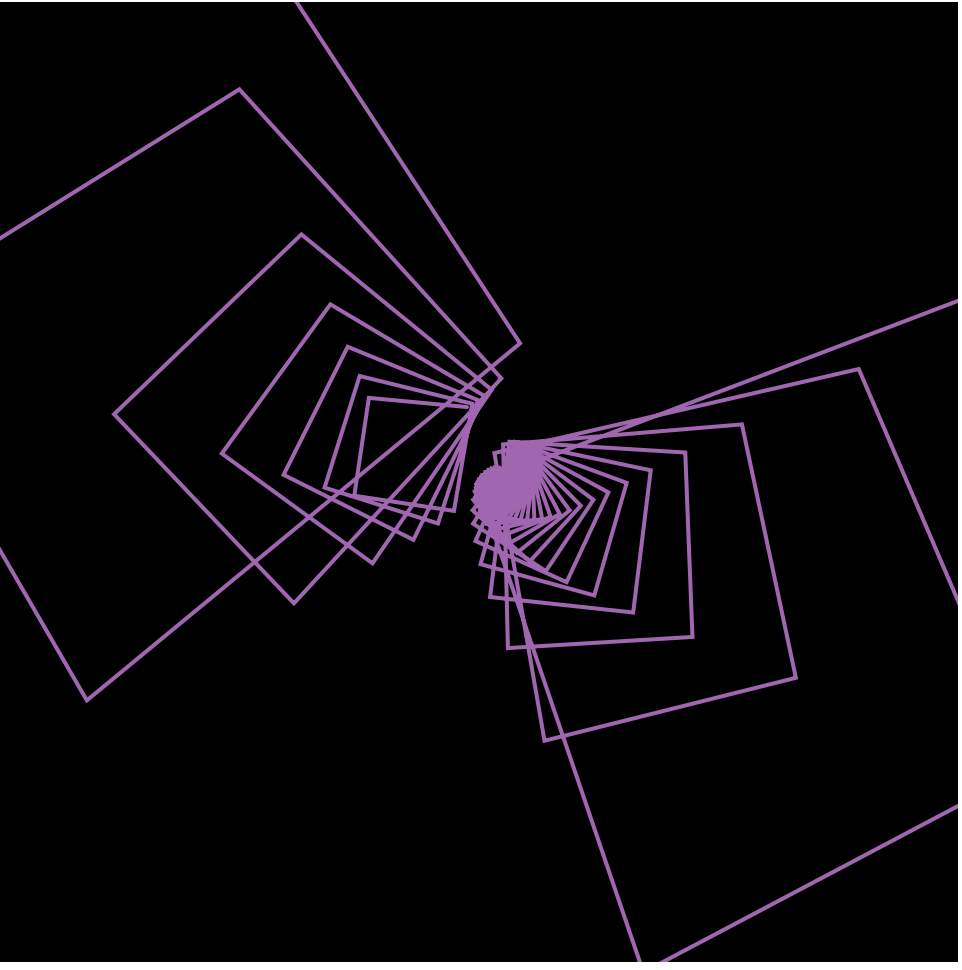
For this project, I spent a lot of time trying to find the right curve to use, and when I came across the Cochleoïd curve, I figured it would be interesting to create some sort of spiral hypnotic effect by mapping the variables and angles to the position of the mouse. As I experimented with this, I realized that I can play around with the mapping values to change the smoothness of the curve. I display this by changing smoothness of the curve according to mouseY. Overall it was a bit of a struggle trying to figure out how to change the variables in order for it to move while adding/detracting to the curve , but it was also an interesting and fun learning experience!


![[OLD FALL 2019] 15-104 • Introduction to Computing for Creative Practice](wp-content/uploads/2020/08/stop-banner.png)