/*SooA Kim
Section C
sookim@andrew.cmu.edu
Project 7: Composition with Curves
*/

var nPoints = 360;
var nPoints1 = nPoints * 10;
var angle = 1;

function setup() {
    createCanvas(480, 480);
    angleMode(RADIANS);
  }

function draw() {
    frameRate(24);
    var g = map(mouseX, 0, 480, 255, 0); //changing green color
    background(255, g, 100);
    angle += 10

    //replicate hypotrochoid using for loop

      for (var px = 0; px < 1000 ; px += 240) {
          for (var py = 0; py < 1000; py += 240) {
            push();
            translate(px, py);
            rotate(angle);
            Hypotrochoid();
            pop();
          }
      }
    drawCurveOne();
}

function Hypotrochoid() {
    var r = map(mouseX, 0, 480, 0, 255); //for red color changes
    var b = map(mouseY, 0, 480, 0, 255); //for blue

    strokeWeight(1.5);
    stroke(r, 255, b);
    noFill();
    beginShape();

    var a = map(mouseX, 0, 480, 10, 120);
    var b = map(mouseY, 0, 480, 2, 10);
    var h = map(mouseY, 0, 480, 40, 120);

        for (var i = 0; i < nPoints1; i++) {
            t = map(i, 0, nPoints1, 0, TWO_PI);
//Reference from <mathworld.wolfram.com/Hypocycloid>
            var x = (a - b) * cos(t) + h * cos((a - b) / b * t);
            var y = (a - b) * sin(t) + h * sin((a - b) / b * t);

            vertex(x,y);
        }

    endShape();
}

    function drawCurveOne() {
      stroke(255);
      strokeWeight(1);
      noFill();
      beginShape();

      //increase number of vertices of the curve
      var nuV = map(mouseX, 0, width, HALF_PI, TWO_PI);

      for (var i = 0; i < nPoints; i+= nuV) {
          //applied i to cos() and sin() to see what happens
          var x = 180 * cos(i) + width/2;
          var y = 180 * sin(i) + height/2;

          vertex(x,y);
      }
      endShape();
    }
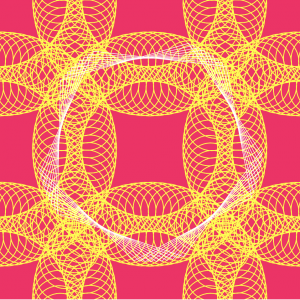
For this project, I tried to understand how curves work using cos() and sin(). So I spent time figuring out how to draw hypotrochoid after numerous attempt failed to get other curve forms.
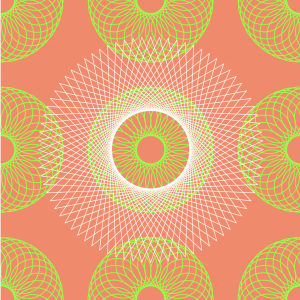
Other forms that appear when you move your mouse:


![[OLD FALL 2019] 15-104 • Introduction to Computing for Creative Practice](wp-content/uploads/2020/08/stop-banner.png)