Hyejo Seo – Project 07 – Curves

sketch

/*
Hyejo Seo
Section A
hyejos@andrew.cmu.edu
Project 7 - Curves 
*/
var nPoints = 200;
var angle = 0;

function setup() {
    createCanvas(480,480);
    frameRate(20);
}

function draw() {
    background(56, 63, 81);
// placing Hypocycloid to be centered in the cavas 
    push();
    translate(width/2, height/2);
    drawHypocycloid();
    pop();
// Making two ranunculoids rotate depending on mouseX position 
    push();
    translate(width/2, height/2);
    rotate(radians(angle));
    angle += mouseX;
    drawRanunculoid();
    drawRanunculoid2();
    pop();
}

function drawHypocycloid(){
    var xh;
    var yh;
    var ah = map(mouseY, 0, 480, 150, 200); 
    var bh = 15;
    var hh = mouseX / 25;

    stroke(255, 200, 200);
    strokeWeight(5);
    noFill();
    beginShape();
// drawing hypocycloid 
    for (var i = 0; i < nPoints; i++) {
        var tH = map(i, 0, nPoints, 0, TWO_PI);     
        xh = (ah - bh) * cos(tH) + hh * cos((ah - bh) / bh * tH);
        yh = (ah - bh) * sin (tH) - hh * sin((ah - bh) / bh * tH);
        vertex(xh, yh);
    }
    endShape(CLOSE); 
}

function drawRanunculoid(){
    var ar = 20;
    stroke(255, 159, 28);
    strokeWeight(5);
    noFill();
    beginShape();
// drawing ranunculoid, for this one, I didn't need small increments with mapping 
    for (var i = 0; i < nPoints; i += 0.3){
      var xr = ar * (8 * cos (i) - cos (8 * i));
      var yr = ar * (8 * sin (i) - sin (8 * i));
      vertex(xr, yr);
}
endShape();
}

function drawRanunculoid2(){  
    var ar2 = 15;

    fill(215, 252, 212);
    noStroke();
    beginShape();
// drawing second ranunculoid 
    for (var i = 0; i < nPoints; i += 0.3){
      var xr2 = ar2 * (6 * cos (i) - cos (6 * i));
      var yr2 = ar2 * (6 * sin (i) - sin (6 * i));
      vertex(xr2, yr2);
}
endShape();
}


I spent fair amount of time browsing the Mathworld Curves website. How I approached this project was, instead of trying to plan the big picture (unlike the other projects), I chose one curve shape I liked and started there. Then, I slowly added other shapes. Unintentionally, my final work looks like a flower, which I am happy with. As the rotation gets faster and the hypercycloid expands, it almost looks like a blooming flower. Overall, it was interesting to play around with different  math equations. 

When mouseX is on the left edge of the canvas. Rotation is the slowest, and hypocycloid forms a circle.
When mouseX is on the far right of the canvas. Rotation is at its fastest and the hypocycloid forms curls.

Hyejo Seo – Looking Outwards 07

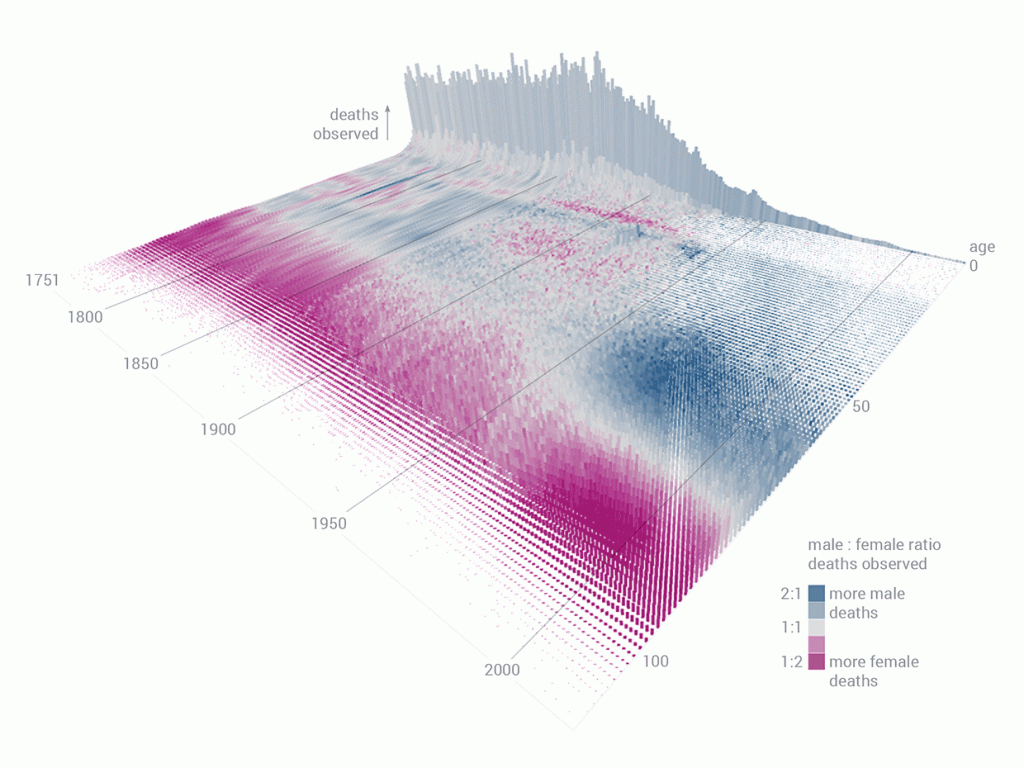
Data Visualization of Mortality Rates in Sweden across 264 years.

A data explorer, Wesley Bernegger, created the above data visualization for the Swedish Human Mortality Database. First, he had to decode the database that consisted of 264 years worth of data. He focused on basic trends in mortality such as deaths increasing with older age, highest observed mortality during war times. Then, slowly, he moved onto more specific patterns such as infant mortality spikes, higher mortality events, and he studied more of the Swedish history in order to get a better understanding of these trends. Finally, he included additional variables: male to female mortality ratio by age across all years and cumulative deaths observed during a year for each age group.

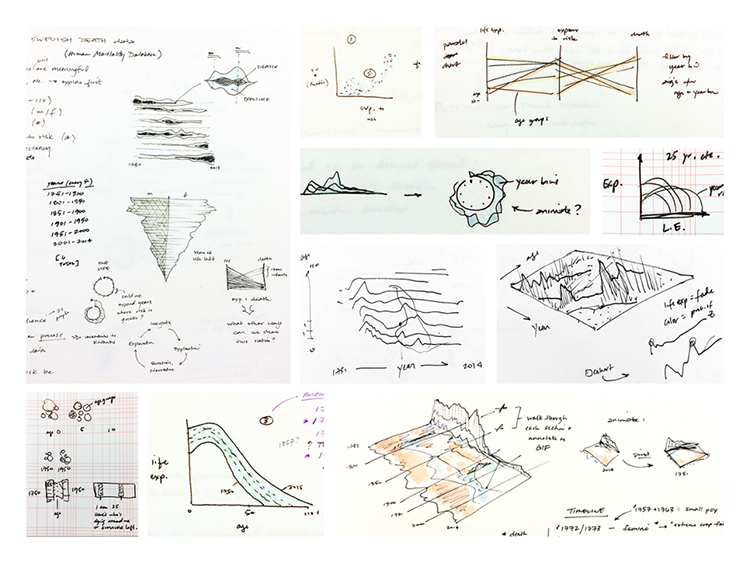
First sketch, exploring different types of data visualization such as tornado charts, parallel diagrams, and etc.

Then, further in the process of data visualization, he included the z axis, making the graph more 3D, in the hopes of better understanding the plots within the context of total mortality. Finally, they added gradient of colors to distinguish mortality rate of female and male. 

This particular project was interesting to me because I have never seen one like it. It is very interesting because each data point might seem obscure, but it is effective in giving the big picture of mortality rates in Sweden across the years with additional variables such as gender, different historical events and age groups. 

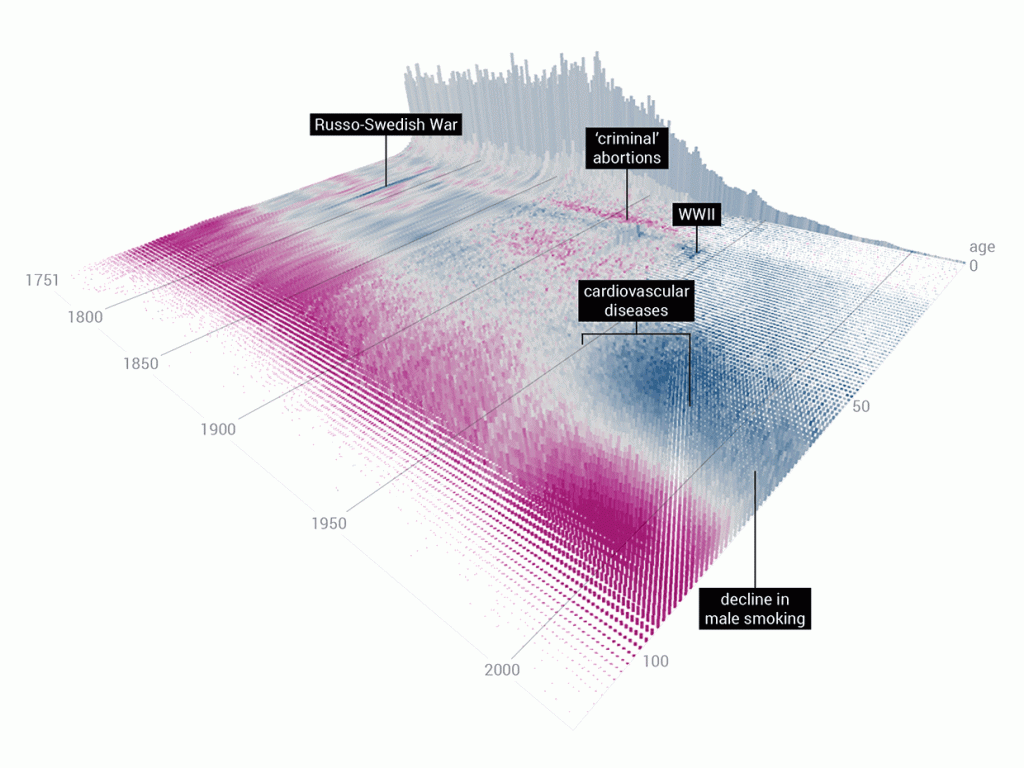
The same data visualization, but with different causes showing

Hyejo Seo- Project 06: Abstract Clock

sketch

/*
Hyejo Seo
SectionA
hyejos@andrew.cmu.edu
Project-06-Abstract Clock
*/
var balloonW;

function setup() {
  createCanvas(400, 400);
}

function draw() {
    var secs = second();
    var mins = minute();
    var hr = hour();  
    var balloonY = 250;
// mapping 
    var secsM = map(secs, 0, 59, 0, 150);
    var minsM = map(mins, 0, 59, 0, 220); 
    var hrM = map(hr, 0, 23, 10, 100);
    background(234, 239, 211);

// balloon pump 
    fill(0);
    rect(345, 170, 10, 70);
    quad(330, 240, 370, 240, 360, 300, 340, 300);
    quad(343, 300, 358, 300, 354, 350, 347, 350);
    fill(47, 41, 99);
    noStroke();
    rect(320, 20 + secs, 60, 150);

// pipe 
    fill(147, 181, 198);
    rect(347, 350, 7, 30);
    rect(100, 373, 250, 7);
    rect(93, 350, 7, 30);
    ellipse(335 - minsM, 376, 40, 20); // circle representing the air movement

//Balloon  
    balloonW = 90;
    fill('#CEEC97');
    stroke(0);
    strokeWeight(2);    
    rect(92, balloonY + 70, 10, 28);  
    ellipse(97, balloonY + 98, 10, 5); 
    ellipse(95, balloonY, balloonW + hrM/2, 150); // increases size by the hour 
    // showing the hour on the balloon  
    fill(0);
    noStroke();
    textSize(50);
    textFont('Avenir');
    text(int(hr), 68, balloonY + 15);
}

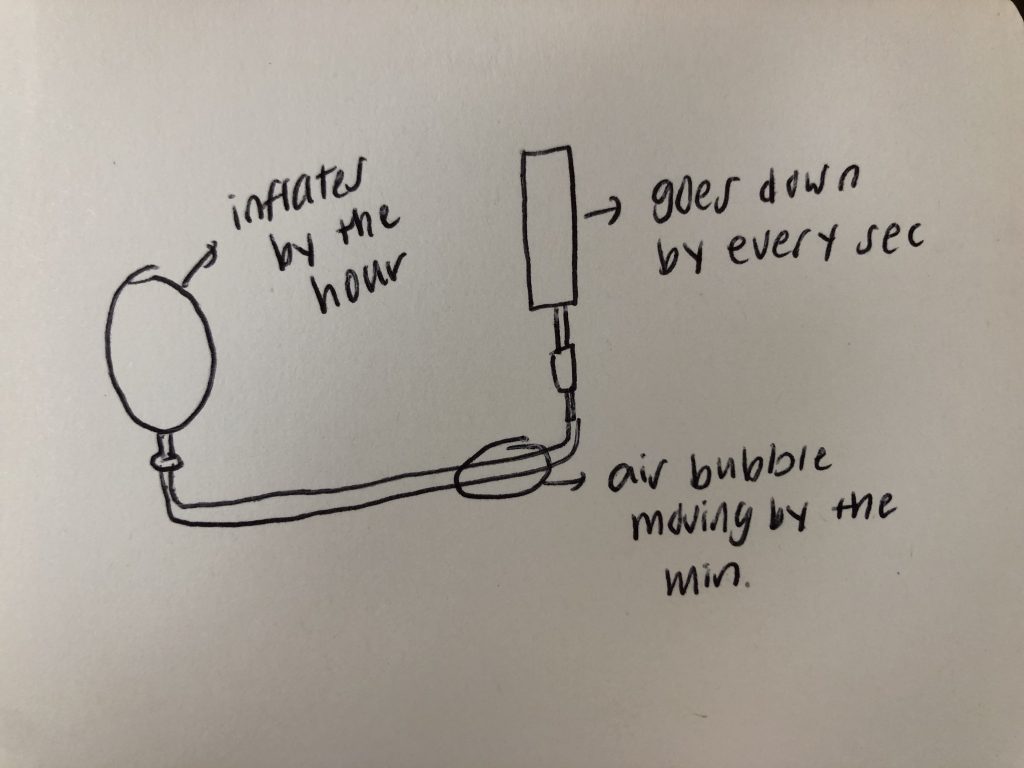
sketching my idea for this project

It took me awhile to think of something fun to represent time. I focused on the increasing factor of time, which led me to think of a balloon inflating. I decided to control the movement of the balloon pumper with seconds, and the air bubble moving through the wire with minutes. Then, the balloon inflates every hour. 

Hyejo Seo – Looking Outwards – 06

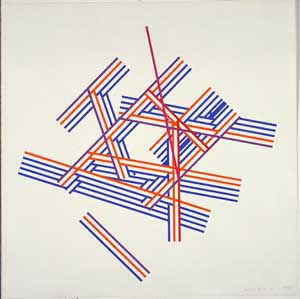
Kenneth Martin’s Chance and Order

Kenneth Martin was an English painter and sculptor – most importantly, he was an abstract artist. Kenneth focused on geometric abstraction, therefore, for his Chance and Order series, he utilized randomness to create geometric abstraction. “Chance” in this series refers to the combination of chance events, and the “Order” refers to the order of his procedures to create this series of paintings. His process was: (1) mark the canvas with points, moving clockwise around a rectangle (2) he had a bag full of pieces of paper with different numbers written. So, he would pick one pair of numbers (2 pieces of paper) and generated lines, following those two coordinates. (3) after doing this process once, he rotated the canvas clockwise, and repeated the process. This was a way of him attempting to be as random as he possibly could. One might say that this was not purely random since he was the one who wrote the numbers down on each piece of paper, but, in my opinion, combinations were what made each painting different, so it was the most random one could have been. 

Even famous paintings that are prominent in abstract art period weren’t created truly by “random”. Each shape was usually placed by the artists, which is not random at all. This is why Kenneth’s works stood out. Although his process of creating geometrically random art was more “random” per se, but, somehow, these random lines create visual harmonies. It is nothing unsettling on the eyes to look at. I think part of the reason why this is possible is because he limited the number of colors to only two. Overall, Kenneth’s process of creating these “random” art was interesting to learn about, and his paintings are so simple, yet eye-catching. 

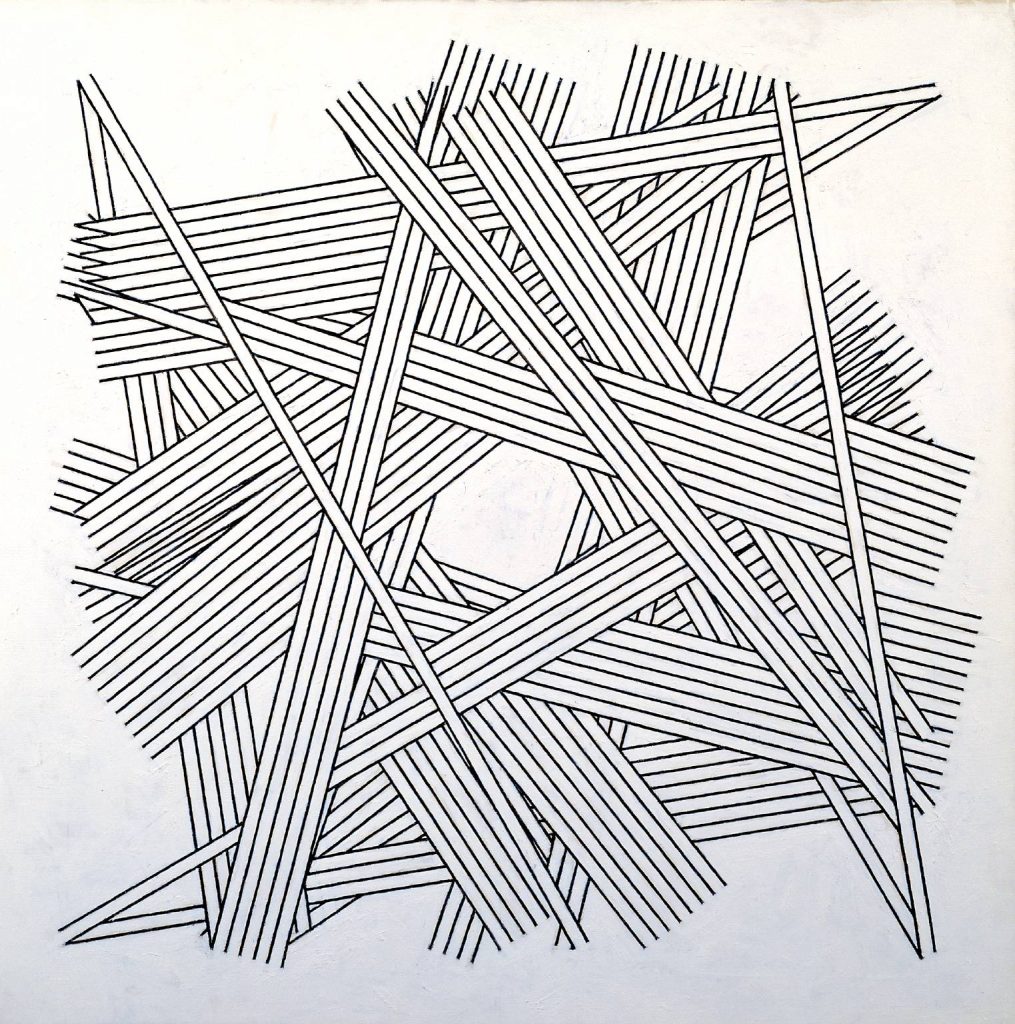
Chance, Order, Change 6 (Black) 1978-9 Kenneth Martin 1905-1984

Hyejo Seo – Project 05 – Wallpaper

sketch

/*
Hyejo Seo
Section A
hyejos@andrew.cmu.edu
Project 5 - Wallpaper
*/
function setup() {
    createCanvas(600,600);
    background(255, 203, 215);
    var w = 150;
    var h = 120;
    var oy = 60;
    var ox = 75;
// background orange lines
    noFill();
    stroke(255, 178, 15);
    strokeWeight(2);
    for (var l = 0; l <= width; l+=5){
      line(l, 0, l, height);      
  }
//smiley FACES
    fill(255, 255, 27);
    stroke(0);
    strokeWeight(5);
    for (var y = 0; y < 7; y++) {
      for (var x = 0; x < 5; x++) {
        if(y % 2 == 0 & x % 2 == 0){
          var yy = oy + y * h;
          var xx = ox + x * w;
          ellipse(xx, yy, 80, 80);
        } 
      }      
    }
    for (var y = 0; y < 7; y++){
      for(var x = 0; x < 5; x++) {
        if(y % 2 == 1 & x % 2 == 1){
        var yy = oy + y * h;
        var xx = ox + x * w;
        ellipse(xx, yy, 80, 80);

        }
      }
    }   
// eyes
    fill(0);
    noStroke();
    for (var y = 0; y < 7; y++) {
      for (var x = 0; x < 5; x++) {
        if(y % 2 == 0 & x % 2 == 0){
          var yy = oy + y * h;
          var xx = ox + x * w;
          ellipse(xx - 13, yy - 10, 10, 20);
          ellipse(xx + 13, yy - 10, 10, 20);
          
        } 
      }      
    }
    for (var y = 0; y < 7; y++){
      for(var x = 0; x < 5; x++) {
        if(y % 2 == 1 & x % 2 == 1){
        var yy = oy + y * h;
        var xx = ox + x * w;
        ellipse(xx - 13, yy - 10, 10, 20);
        ellipse(xx + 13, yy - 10, 10, 20);
        }
      }
    }    
//mouth
    noFill();
    stroke(0);
    strokeWeight(5);
    for (var y = 0; y < 7; y++) {
      for (var x = 0; x < 5; x++) {
        if(y % 2 == 0 & x % 2 == 0){
          var yy = oy + y * h;
          var xx = ox + x * w;
          arc(xx, yy + 8, 50, 35, 0, PI);
        } 
      }      
    }
    for (var y = 0; y < 7; y++){
      for(var x = 0; x < 5; x++) {
        if(y % 2 == 1 & x % 2 == 1){
        var yy = oy + y * h;
        var xx = ox + x * w;
        arc(xx, yy + 8, 50, 35, 0, PI);      
        }
      }
    }  
//diamonds
    fill(0);
    noStroke(0); 
    for (var x = 225; x < width; x += 300) {
      for(var y = 30; y < height; y += 240){
        quad(x, y, x + 15, y + 25, x, y + 50, x - 15, y +25);        
      }
    } 
    for (var x = 75; x < width; x += 300) {
      for(var y = 155; y < height; y += 240){
        quad(x, y, x + 15, y + 25, x, y + 50, x - 15, y +25);        
      }
    } 
    noLoop();
}
function draw() {    
}

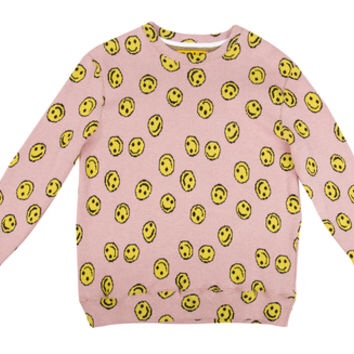
Initially, I was inspired by the Golf Wang Smiley Face Sweater. I added more elements such as the orange lines and diamonds to make it more interesting as a wallpaper. I have always wanted to create something with smiley faces even for my previous projects, and, this time, I was able to do it. I had fun creating this wallpaper. 

Smiley face sweater by a brand called “Golf Wang”

Hyejo Seo – Looking Outwards 05

All You Need Is Ecuador campaign

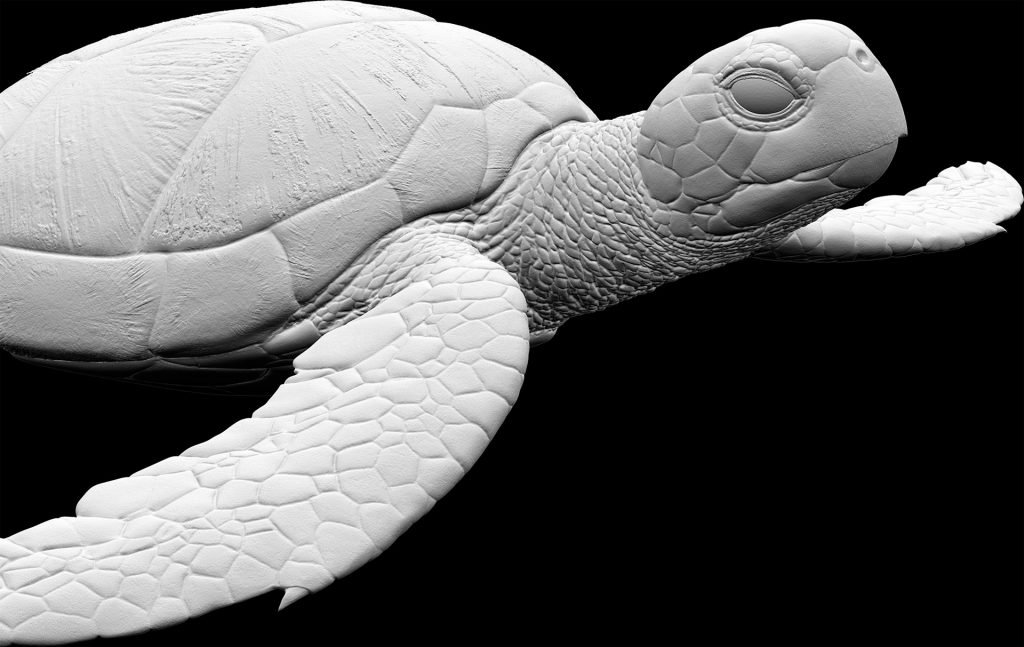
This CGI award winning “All You Need Is Ecuador” campaign was created in order to attract more tourism to Ecuador. It was created by a Brazilian agency Studio, Manipula, using CGI. The campaign accurately promotes the bio-diversity in Ecuador – from its animals and nature. This 3D campaign was eye-catching since it was a creative way of illustrating the attractions of Ecuador – something a simple 2D graphics could not achieve. Ecuador campaign was a good example of the use of art to make campaigns more interesting, which is what I aspire to do in the future. 

Image of a Sea turtle rendered in 3D

Hyejo Seo – Project -04: String Art


For this project, I wanted to explore different shapes that could be created by overlapping lines. I thought of playing cards, so I decided to use “Diamond” as my theme. 

sketch

/* 
Hyejo Seo
Section A
hyejos
Project - 04 - String Art
*/

function setup() {
    createCanvas(300,400);
}

function draw() {
    background(47, 47, 47);
    
    for(var q = 0; q < 50; q += 3){
        stroke(106, 127, 219); // blue line 
        line(q - 30, -q, q + 300, height - q + 30);
        stroke(224, 141, 172); // pink line
        line(q - 60, height + q, width + q, q - 60);
    }
    //white lines 
    for(var q = 0; q < 50; q += 5){
        stroke(255); 
        strokeWeight(0.7);
        line(q + 150, height + q, width + q + 160, q);
        line(q - 250, height + q, width + q, q - 260);
    }
    //Joker 
    fill(87, 226, 229);
    noStroke();
    textSize(15);
    textFont('Serif');
    text("J", 283, 315);
    text("O", 280, 335);
    text("K", 280, 355);
    text("E", 280, 375);
    text("R", 280, 395);

    //other letters
    textFont('Serif');
    textSize(25);
    //k + diamond
    text("K", 10, 25);
    quad(19, 35, 30, 50, 19, 65, 8, 50);
    //Q + Diamond 
    text("Q", 10, height - 40);
    quad(19, 369, 30, 384, 19, 399, 8, 384);
    text("J", width - 23, 25);
    quad(width - 19, 35, width - 30, 50, width - 19, 65, width - 8, 50);   
}

Hyejo Seo – Looking Outwards-04


Video that demonstrates how Uncertainty Principle of the Invisible works. 

“There is no such thing as emptiness; it is full of randomness”

This interactive art project, Uncertainty Principle of the Invisible, created by Hyesoo Chang was inspired by the connection between human’s voice and the random movement of dust. Every individual has unique vocal tone and rhythm that, consequently, differentiates the movement of the dust in the air. In this case, human’s voice and dust particles work as “the Invisible”, and the random interaction between the two is the “Uncertainty Principle”. How this installation works is that, when a person speaks into the microphone (physical interaction), their voices get transformed into digital files, which, then, affects how the dust bounces. This art installation was created using Maxmsp. 

I think it’s a very intriguing and creative piece that shows how our voices – something that is invisible to us – affects the physical world around us. This project shines light on the interaction between us and our surroundings that is rather overlooked everyday. So cool! 

Hyejo Seo – Project-03: Dynamic Art


sketch

/* 
Hyejo Seo
Section A
hyejos@andrew.cmu.edu
Project-03- Dynamic Art
*/ 

var circleY = 250;  
var cSpeed = 1; 
var sunDia = 350;

function setup() {
  createCanvas(450,500);
}

function draw() {
    background(180, mouseY + 70, mouseY + 100);
//sun
fill(255, 100, 147);
noStroke();

if(mouseY >= 150){
  sunDia = 350; 
} else {
  sunDia = mouseY /2;
}
circle(225, 290, sunDia); 
  
//smoke 
    circleY = circleY - cSpeed; 
    fill(198, 207, 220);
    noStroke();
    circle(220, circleY, 100);
    if(circleY >= height){
      circleY = -cSpeed;
     } 
    circle(250, circleY, 90);
    if(circleY > height){  
      cSpeed = cSpeed;
     }
    circle(200, circleY + 70, 80);
    if(circleY + 70 > height){    
      cSpeed = cSpeed;
    }
    circle(250, circleY + 60, 100);
    if(circleY + 50 > height){    
      cSpeed = cSpeed;
    }
    circle(210, circleY - 50, 90);
    circle(260, circleY - 50, 100);
    if(circleY - 50 > height){
      cSpeed = cSpeed;
    } 
    circle(210, circleY - 100, 80);
    circle(250, circleY - 100, 90);
    if(circleY - 100 > height){
      cSpeed = cSpeed;
    } 
    circle(210, circleY - 80, 100);
    if(circleY - 50 > height){
      cSpeed = cSpeed;
    } 

    if(circleY <= -100){
      circleY = height;
    }
//Volcano
fill(234, 51, 28);
if(mouseY <= 150){
  beginShape();
  curveVertex(170, 500);
  curveVertex(170, 500);
  curveVertex(170, 280);
  curveVertex(90, 150);
  curveVertex(130, 150);
  curveVertex(150, 120);
  curveVertex(180, 145);
  curveVertex(220, 80);
  curveVertex(250, 150);
  curveVertex(280, 130);
  curveVertex(280, 170);
  curveVertex(290, 165);
  curveVertex(320, 150);
  curveVertex(380, 145);
  curveVertex(310, 250);
  curveVertex(330, 500);
  curveVertex(330, 500);
  endShape();
} else {
  endShape();
    beginShape();
    curveVertex(170, 500);
    curveVertex(170, 500);
    curveVertex(170, 280);
    curveVertex(310, 280);
    curveVertex(200, 500);
    curveVertex(200, 500);
    endShape();
}
// mountain
    fill (170, 140, 99);
    noStroke();
    quad(0, 500, 450, 500, 350, 350, 100, 350); 
    
// mountain peak
    fill(170, 140, 99);
    beginShape();
    curveVertex(100, 350);
    curveVertex(100, 350);
    curveVertex(140, 280);
    curveVertex(170, 250);
    curveVertex(210, 270);
    curveVertex(240, 260);
    curveVertex(270, 290);
    curveVertex(310, 250);
    curveVertex(350, 350);
    curveVertex(350, 350);
    endShape();

// mountain body detail 
    stroke(67,42, 29);
    strokeWeight(3);
    line(50, 500, 150, 300);
    line(140, 450, 190, 310);
    line(200, 490, 230, 300);
    line(250, 450, 245, 300);
    line(300, 500, 280, 320);
    line(350, 500, 300, 300);
}

For this project, I have created an interactive piece of a volcano explosion – from the moment of the lava boiling, which was depicted by the smoke to the explosion. I had fun and learned a lot experimenting with interactive/conditional functions. 

Hyejo Seo-Looking Outward-03

Frequencies created by Convivial Studio

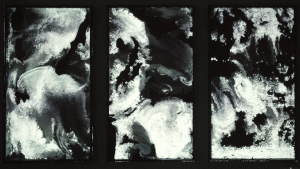
This art work, Frequencies (2017), caught my eye at first because I thought it was simply a model of different area’s geography because of the rocky surface, and liquid-like flow was the cloud movements in that area. I soon found that the rocky surfaces were randomly generated from different frequencies of Perlin Noise Algorithm. These generative 3D models have been created by Convivial Studio for Autodesk Pier 9. 

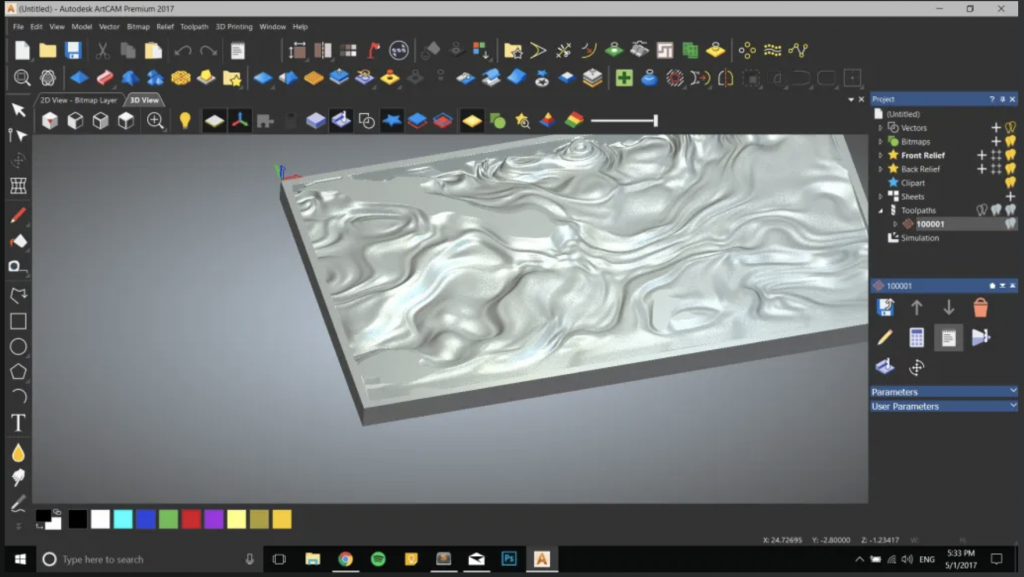
Look of a model generated from codes on ArtCam

For this shape and color study, Convivial Studio used artCam to generate GCodes of the frequencies of Perlin Noise Algorithm for the CNC (Computer Numerical Control) machines, which, then, generated infinite 3D models of the rocky surface. Then, these models were carved into condensed polyurethane foam board, added with the projection layer of different patterns changing over this board. This was a way of the team trying to challenge the viewer’s perception and get them engaged. This projection was created with several softwares such as openFramewors, ofxMtlMapping2D, ofxFlowTools and etc. 

It was very intriguing and eye-opening to see how lines of codes of noise frequencies could be translated into such beautiful art piece.