A visualization of the Global Exchange of Information (IP traffic)
The New York Talk Exchange, a project worked on by Aaron Koblin, illustrates the global exchange of information. It does this in real time by using data collected from long distance telephone and IP data flowing between New York and the rest of the world. The project is on display at the Museum of Modern Art.
In the above image, the weight of the glow corresponds to the amount of IP traffic flowing between a particular city and New York. A greater glow means a greater IP flow. Other pieces in this project show a similar connectivity using data collected from New York’s telephone network.
The purpose of this project was to show how connected New York is to the rest of the world, especially in the information age with the wide accessibility of telecommunication and internet connectivity. The project shows which cities New York has the strongest connections to. I admire that the project aims to show how connected the world is, despite the constraint of distance.
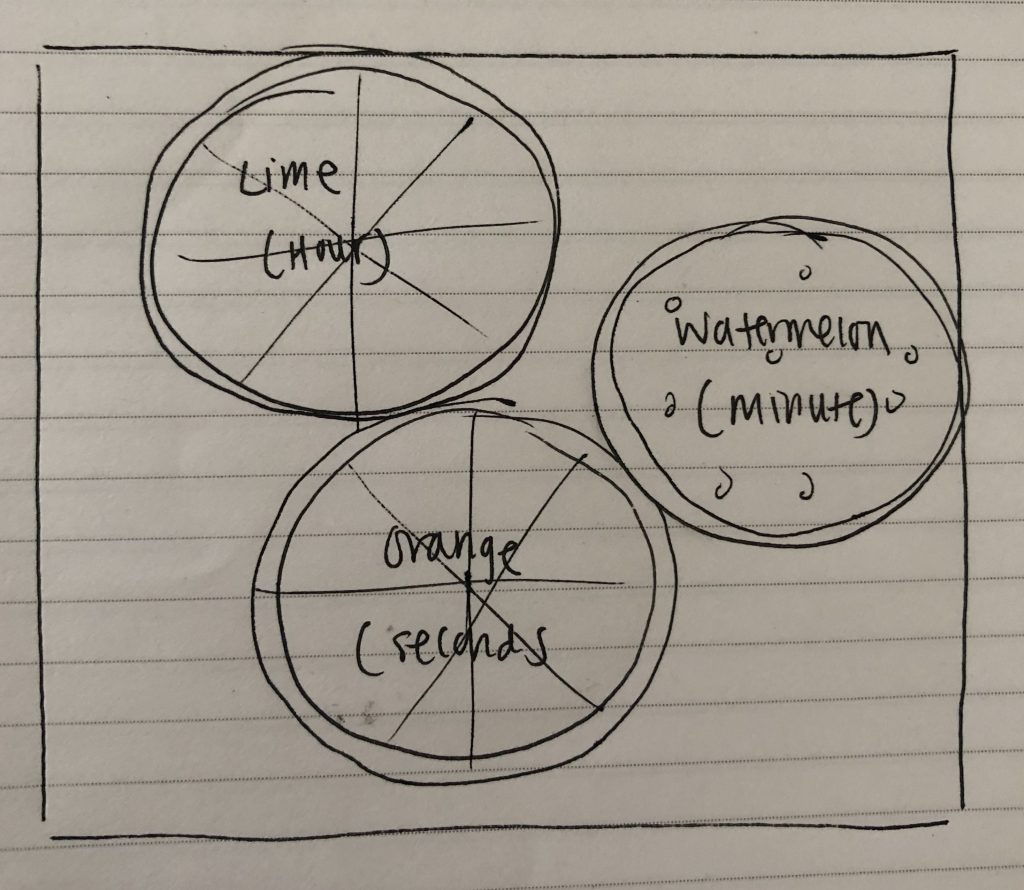
The lime represents the hour, and a slice is eaten every hour. The watermelon represents the minute, and a slice is taken every minute. Similarly, the orange represents the seconds and a slice is taken every second. The fruit resets every minute/hour/day.
This was a very fun project to do, both in drawing the actual fruits and figuring out how to take a slice from each every second/minute/hour. It was interesting to learn about the time functions and how to creatively implement them into the project. Finally, I was really happy with the way it turned out.
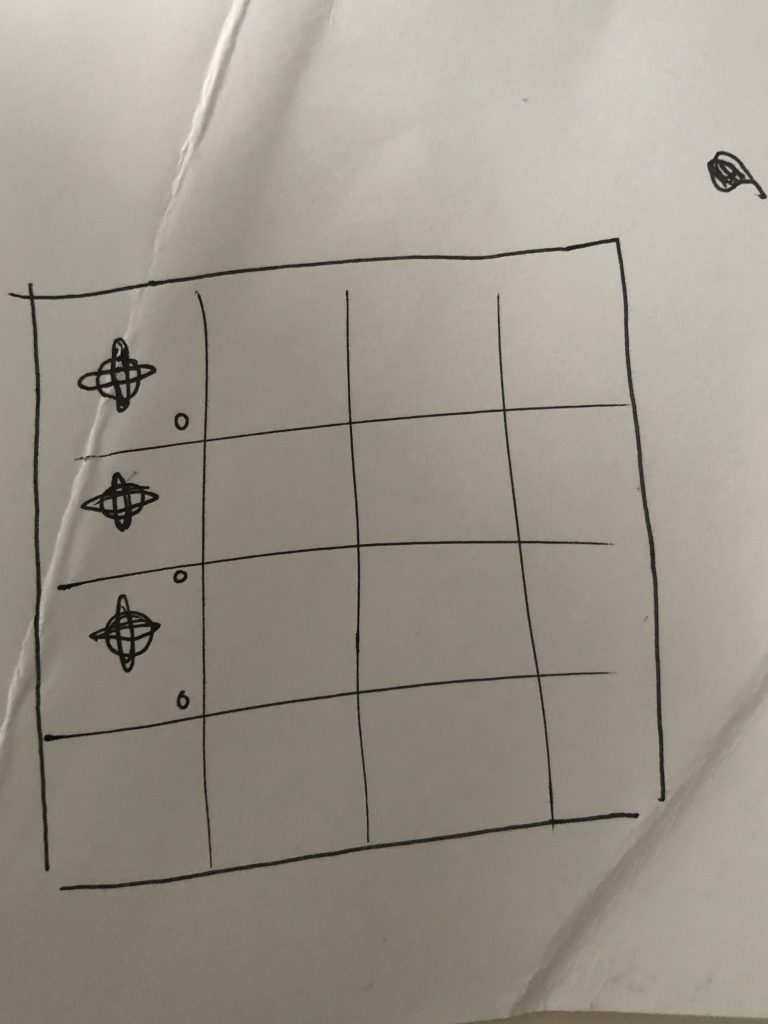
The following work is titled ‘e4708‘ by Mark Wilson. Throughout the 80s, it was challenging to create artwork involving a machine. Wilson started to learn programming in 1980, after he bought himself a microcomputer. He then began using this computer to create artwork. His work generally consists of repetition in order to create complex layers that result in very intricate art pieces. Some of the aspects of his art are specifically chosen by him, while some other aspects are left to chance and chosen randomly by the computer.
Wilson’s work has also been exhibited all across the world. His distinct technological style and geometric imagery have made him famous in computer art. I admire the color and style that Wilson uses in his work. It makes the piece very complex and interesting to look at. He also includes many geometric pieces in his work, giving it a very distinct look.
/*Katrina Hu
15104-C
kfh@andrew.cmu.edu
Project-05-Wallpaper*/

function setup() {
    createCanvas(570, 570);
    //background(255, 203, 196);
    background(0);
}

function draw() {
    //flower
    noStroke();
    for (var y = 0.5; y < 7; y++) {
        for (var x = 0.5; x < 7; x++) {
            fill(255);
            ellipse(y * 80, x * 80, 40, 10);
            ellipse(y * 80, x * 80, 10, 40);
            fill(255, 245, 173);
            ellipse(y * 80, x * 80, 25, 25);
            fill(186, 209, 255);
            ellipse(y * 80, x * 80, 10, 10);
        }

    }
    //small polka dots
    for (var y = 0.5; y < 6; y++) {
        for (var x = 0.5; x < 6; x++) {
            fill(255);
            ellipse(y * 80 + 40, x * 80 + 40, 5, 5);
        }
    }
}
This was a fun project to experiment with various shapes and how to create a design from them. I enjoyed seeing how the for loop would change the design.
The Utah Teapot is very commonly regarded as the most important object in computer graphics. Made by computer scientist Martin Newell in 1974 when he was a Ph.D. student at the University of Utah, it was a breakthrough in 3D computer graphics. Newell was looking for new ways to make computer graphics look more realistic, and he needed a subject. The teapot was the perfect object for Newell to demonstrate his complex algorithms, as it had both concave and convex surfaces, and it cast shadows on itself.
I admire the simplicity yet effectiveness of this project. The teapot was not too simple nor too complicated, and it is easily recognizable. It also didn’t need a texture for the object to look realistic. This teapot eventually paved the way for lots of future computer graphics research, and both Adobe and Pixar got their start at the lab Newell worked at.
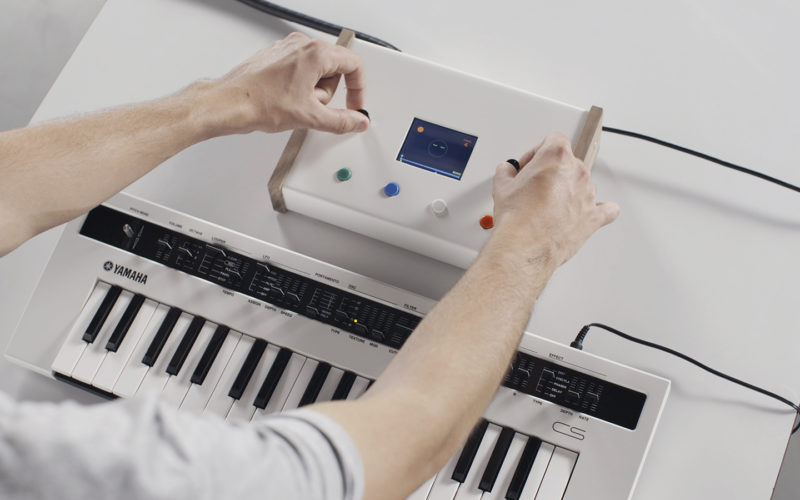
The interface screen that displays the data collected by the sensors.
Weather Thingy is a sounds controller that uses real time climate-related events to control and modify the settings of musical instruments. The device consists of a weather station on a tripod microphone and a custom built controller connected to the weather station. The station has 3 climate sensors including a rain gauge, a wind vane and an anemometer. There is a controller that transforms climatic data into midi data, and can therefore be interpreted by instruments. The purpose of this project was to allow users to listen to the impact of climate on composition.
I admire that it allows users to take the data and use it to turn it into their own creative compositions. This is possible because you can use the device to pre-record the climate data of a certain place at a certain time. The musician can capture moments that he has found inspiring to create new melodies on his own.
This project changes four different aspects of image elements – size, shape, position, and color. It was a fun project to do, as it was interesting to experiment with how mouse position would affect these elements.
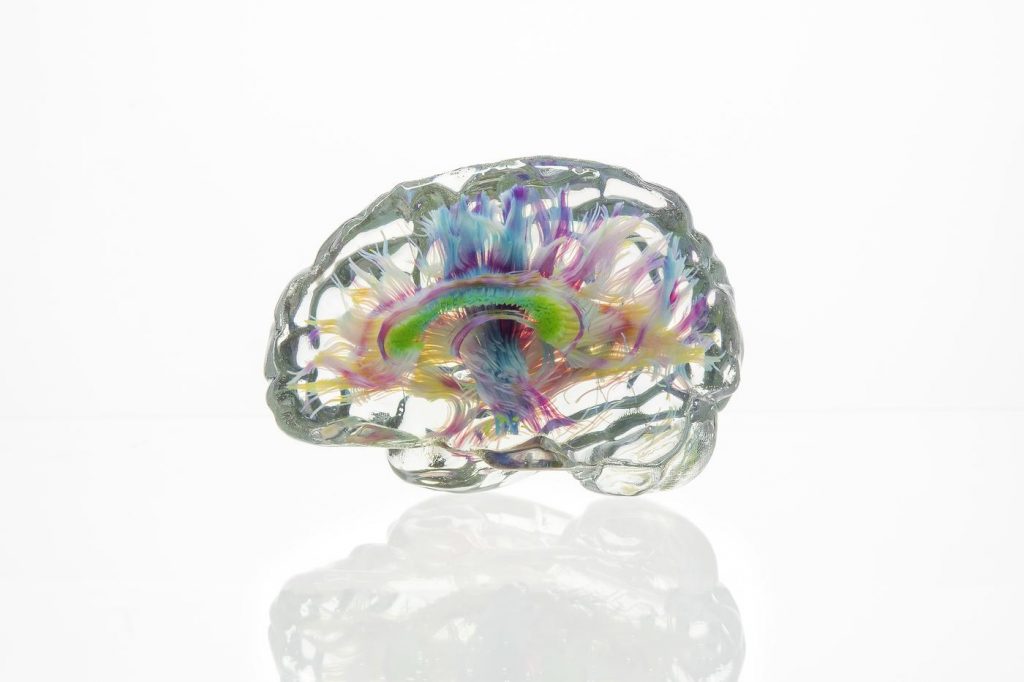
Data physicalization of the human brain, made by the Mediated Matter Group
The Mediated Matter Group at MIT uses a multimaterial voxel-printing method. This enables the physical visualization of data sets. These data sets are visualized on a screen, and then converted into physical 3-D objects. One of the objects that stood out to me was the physicalization of the human brain. The viewer is able to see various brain structures, including bundles of axons that connect different parts of the brain.
I admire this work because it allows people to actually visualize structures that may otherwise be hard to see. It is very effective, as physical manifestations of data sets can improve spatial perception skills. It also makes the presentation of new information more intuitive for students. It allows much more interaction than 2-D information displays.
To generate this work, the group converts data sets into dithered material deposition descriptions. The data sets then can be visualized on screen and can later be converted into physical objects.
The exhibition “Growing Objects,” designed by Jessica Rosencrantz in 2014, replicates natural growth processes using simulations and 3D printed sculptures. The piece is very effective at replicating the structural patterns in nature. I admire the complexity and accuracy of the work.
The algorithm used to generate these works of art are made by using scientific theories and models of natural pattern formation. It is very successful in allowing viewers to visualize the complex growth processes that occur in nature. The project also aims to encourage viewers to think about new ways that design and growth can influence the environment in the future.
![[OLD FALL 2019] 15-104 • Introduction to Computing for Creative Practice](https://courses.ideate.cmu.edu/15-104/f2019/wp-content/uploads/2020/08/stop-banner.png)