Claire Lee – Project 07 – Curves

project07

/* 
Claire Lee
15-104 Section B
seoyounl@andrew.cmu.edu
Project-07
*/

var nPoints = 100;
var angle = 0;
//initial global variables

var bgRed = 135;
// background color variable

function setup() {
    createCanvas(480, 480);
    background(bgRed, 195, 255);
}

function draw() {
    bgRed = 150 + (mouseX * (120 / width));
    background(bgRed, 195, 255);

    push();
    translate((width / 2), (height / 2));
    rotate(radians(mouseY));
    hypotrochoidCurve();
    pop();
    // place curve in center, govern rotation by mouseY

    push();
    translate((width / 2), (height / 2));
    rotate(radians(mouseX));
    epitrochoidCurve();
    pop();
    // place curve in center, govern rotation by mouseX 

    push();
    translate((width / 2), (height / 2));
    rotate(radians(mouseX * 5));
    deltoidRadialCurve();
    pop();
    // place curve in center, govern rotation by mouseX 
    // comparatively faster rotation
}

function hypotrochoidCurve() {
    var a1 = map(mouseX, 0, 480, 80, 200);
    //size changes with repsect to mouseX
    var b1 = 30; 
    var h1 = (mouseX / 10);
    var angle1 = 0;
    // variables for shape 1 (hyopotrochoid)

    strokeWeight(1);
    stroke(255);
    noFill();
    beginShape();
    for (var i = 0; i < nPoints; i++) {
        var angle1 = map(i, 0, nPoints, 0, TWO_PI);
        x1 = (a1 - b1) * cos(angle1) + h1 * (cos(((a1 - b1)/ b1) * angle1));
        y1 = (a1 - b1) * sin(angle1) + h1 * (sin(((a1 - b1)/ b1) * angle1));
        vertex(x1, y1);
    }
    endShape(CLOSE);
    //hypotrochoid curve
}

function epitrochoidCurve() {
    var a2 = map(mouseX, 0, 480, 50, 100);
    //size changes with respect to mouseX
    var b2 = 50;
    var h2 = (mouseY / 20);
    var angle2 = 0;
    // variables for shape 2 (epitrochoid)

    strokeWeight(1);
    stroke(255);
    fill(255, 255, 255, 50);
    beginShape();
    for (var i = 0; i < nPoints; i++) {
        var angle2 = map(i, 0, nPoints, 0, TWO_PI);
        x2 = (a2 + b2) * cos(angle2) - h2 * cos((a2 + b2) * angle2);
        y2 = (a2 + b2) * sin(angle2) - h2 * sin((a2 + b2) * angle2);
        vertex(x2, y2);
    }
    endShape(CLOSE);
    // epitrochoid curve
}

function deltoidRadialCurve() {
    var a3 = map(mouseY, 0, 480, 0, 100);
    //size changes with respect to mouseY
    var angle3 = 0;
    // variables for shape 3 (deltoid radial)

    strokeWeight(1);
    stroke(255);
    fill(255, 255, 255, 50);
    beginShape();
    for (var i = 0; i < nPoints; i++) {
        var angle3 = map(i, 0, nPoints, 0, TWO_PI);
        x3 = (1/3) * a3 * (2 * cos(angle3) + cos(2 * angle3));
        y3 = (1/3) * a3 * (2 * sin(angle3) - sin(2 * angle3));
        vertex(x3, y3);
    }
    endShape(CLOSE);
    // deltoid radial curve   
}

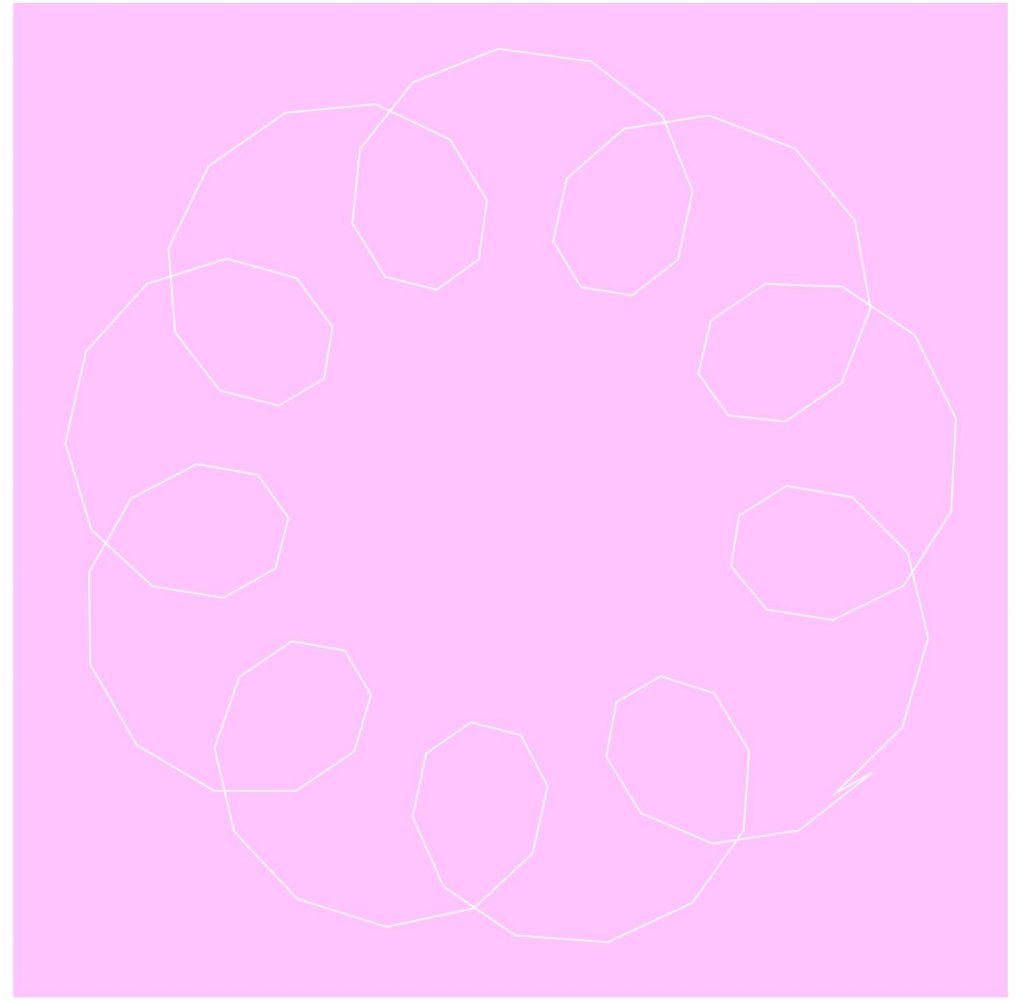
This project was really interesting because I got to see how I could adjust different variables within parametric equations to change with respect to mouse position. I wanted to create something relatively simple that resembles a “blooming” flower as the mouse moves position from (0,0) to (480,480). Admittedly, this took a bit of trial and error, and I ran into a lot of formatting issues in the beginning, but I’m pretty satisfied with how it turned out.

The first hypotrochoid curve — “petals”
Addition of the epitrochoid — “center”

Claire Lee – Looking Outwards – 07

I chose to write about Stamen Design’s Cell Phone Coverage in the Bay Area. I do admire the firm’s work as a whole, but I thought that the designs they chose to generate from this particular dataset was really interesting to look at. I really liked how they took as mundane of a topic as cell phone coverage and made it into something visually appealing and beautiful. It was also really fascinating to see the variety in the different kinds of designs that they made out of the same type of data. I think that this set of designs is a really good representation of Stamen Design’s artistic sensibilities in that the firm considers itself to be sitting at the intersection between design and data science, and the collection embodies that combination.

Cell Phone Coverage in San Francisco, Carrier 1

Specifically, the Cell Phone Coverage in San Francisco is meant to visualize cellular network strength across four major carriers in the Bay Area through data-driven algorithms and interactive sketches. Although I’m not really sure about this, I think that this kind of data-derived design algorithm would involve importing data into the code editor and then inputting the values into some type of array structure to generate the patterns. It also looks like there are preset color and shapes that go with the information, so I would assume those use some type of array as well.

Claire Lee – Project 06 – Abstract Clock

project06

var starX = [];
var starY = [];
// star position arrays

function setup() {
    createCanvas(600, 600);
    for (i = 0; i < 100; i++) {
        starX[i] = random(width);
        starY[i] = random(height);
    } // randomizing star x and y positions
}

function draw() {
    background(0, 0, 10);

    noStroke();
    fill(255, 210, 10); 
    ellipse(300, 300, 50, 50);
    //sun

    stroke(200);
    strokeWeight(1.5);
    noFill();
    ellipse(300, 300, 500, 500);
    // outer orbit

    stroke(200);
    strokeWeight(1);
    noFill();
    ellipse(300, 300, 350, 350);
    // middle orbit

    stroke(200);
    strokeWeight(0.5);
    noFill();
    ellipse(300, 300, 250, 250);
    // inner orbit

    var S = second();
    var M = minute();
    var H = hour();
    var mappedS = map(S, 0, 59, 0, 354);
    var mappedM = map(M, 0, 59, 0, 354);
    var mappedH = map(H, 0,23, 0, 354);
    // time variables

    push();
    //stars
    for (i = 0; i < 100; i++) {
        noStroke();
        fill(255, 255, 255, 75);
        ellipse(starX[i], starY[i], 2, 2);
    } 
    translate(300, 300);
    // red planet
    rotate(radians(mappedH));
        noStroke();
        fill(230, 50, 15);
        ellipse(0, -250, 20, 20);
    // grey planet
    rotate(radians(mappedS));
        noStroke();
        fill(150);
        ellipse(0, -125, 10, 10); 
    pop();

    var moonX = 300 + -175 * (cos(radians(mappedM)));
    var moonY = 300 + -175 * (sin(radians(mappedM)));
    // circle math!
    push();
    translate(moonX, moonY);
        noStroke();
        fill(70, 210, 200);
        ellipse(0, 0, 25, 25);
        // blue planet

        stroke(200);
        strokeWeight(0.5);
        noFill();
        ellipse(0, 0, 60, 60);
        // moon orbit

        rotate(radians(mappedS));
        noStroke();
        fill(150);
        ellipse(0, -30, 10, 10);
        // moon
    pop();
}

This project was really interesting to do because I got to revisit and experiment with the translate() and rotate() functions. I also incorporated arrays into my piece, and was really satisfied with the result. One thing I learned that I don’t think I remember seeing before is the map() function, which I think made it a lot easier to convert measures of time into evenly-spaced coordinates without hard-coding in the math.

Claire Lee – Looking Outwards – 06

I decided to write about Yale architecture student Aaron Tobey’s Randomness Project. It seems to have been for a coding-based architecture course, and essentially runs a program that draws a randomly-generated set of lines and shapes on 36 canvases. I found it really interesting because each of the 36 canvases were in the same format (same background and same color/weight of line) but seemed like they were generated with different programs. I admired that despite these variations, the entire piece is cohesive and comes together in an aesthetically pleasing way.

Random Video Project, Aaron Tobey, 2015.

Trying to think around the algorithms that might have created this piece was really interesting because unlike some of the previous works I’ve found, this was a student’s work. I still think that it goes a little beyond the scope of what I’ve learned to do so far, but the script used to create this visual piece uses a set of rules to overlap circles, triangles, and lines in a random but constrained space, with a defined frame per second rate. It starts out with a “base” piece–a set of randomly generated canvases containing shapes that don’t change– and then layers dynamic shapes on top of that. I’m not sure whether these bases are hard-coded (for aesthetic purposes?) or not, but they seem fairly random.

Claire Lee – Project 05 – Wallpaper

project05

function setup() {
    createCanvas(600, 600);
}

function draw() {
    background(140, 180, 155, 200);

    for (x = 0; x < 10; x ++) {
        stroke(30, 70, 45, 200);
        strokeWeight(2);
        line((x*60) + 30, 0, (x*60) + 30, height);
        //stem  
    }

    for (x = 0; x < 15; x ++) {
        for (y = 0; y < 62; y += 3) {
            noStroke();
            fill(30, 70, 45, 200); 
            quad((x*60) + 30, y*10 - 5, (x*60) + 40, y*10 - 5, (x*60) + 50, y*10 - 15, (x*60) + 40, y*10 - 15);
            quad((x*60) + 30, y*10 - 5, (x*60) + 20, y*10 - 5, (x*60) + 10, y*10 - 15, (x*60) + 20, y*10 - 15);
            //leaves
        }
    }

    for (x = 0; x < 10; x ++){
        for (y = 0; y < 30; y += 3) {
            noStroke();
            fill(255, 250, 220);
            ellipse((x*120) + 40, y*40 + 4.5, 5, 5);
            ellipse((x*120) + 37, y*40 + 10, 5, 5);
            ellipse((x*120) + 43, y*40 + 10, 5, 5);
            //flowers (odd)
            ellipse((x*120) + 20, (y*40 + 60) + 4.5, 5, 5);
            ellipse((x*120) + 23, (y*40 + 60) + 10, 5, 5);
            ellipse((x*120) + 17, (y*40 + 60) + 10, 5, 5);
            //flowers (even)

        }
    }
    noLoop();

}

This project was a great way to keep playing around with for() loops. I wanted to go for something simple and plant-inspired, so this is what I came up with. I think if I were to make this a little more complex, I’d try using bezier curves instead of straight lines, and implement a little more randomness. However, since it was supposed to be a “wallpaper” type project, I decided to keep it basic.

The planning process

Claire Lee – Looking Outwards – 05

  • Please discuss the project. What do you admire about it, and why do you admire these aspects of it?
  • What do you know (or what do you suppose) about the algorithms that generated and/or rendered the work?
  • It what ways are the creator’s artistic sensibilities manifest in the final form?
  • Link (if possible) to the work. To the best of your abilities, be sure to provide the creator’s name, title of the work, and year of creation.
  • Embed an image, sound, and/or a YouTube/Vimeo video of the project.

I decided to write about a program called the Persistence of Vision (POV) Ray Tracer, which uses millions of mathematical calculations to generate a 2-dimensional scene from a text description. This isn’t necessarily an “artwork” but rather a program that pioneered the process of transcribing 3-dimensional images to a 2-d visual artwork using a software. I’m not entirely sure how the algorithms work, but it has something to do with manipulating “solids” in a “3-D space” within the program. The images that this program produces are fascinating, because of the “perfect” nature of the pieces: it’s computer-generated, so there isn’t any human error to speak of, and the images produced often look like photographs. It’s unsettling, in a way, because they are so precise. It’s also interesting to note that because these images are completely generated through text, they require no artistic capability in the traditional sense.

The Lovers by Gilles Tran, 2001.
Bonsai Life by Jeremy M. Praay, 2008.

POV-ray was first conceptualized in the late 1980’s by David K. Buck, but has since then taken on a life of its own. As the creators have kept it an open-source software, numerous users have utilized it in their individual projects. The two artists I have included in this post are Jeremy M. Praay and Gilles Tran.

Claire Lee – Project 04 – String Art

sketch

/*
Claire Lee
15-104 Section B
Project - 04
*/

var canvasW = 400;
var canvasH = 300;
var lineR = 0;
var lineG = 255;
var lineB = 200;

function setup() {
    createCanvas(canvasW, canvasH);
    strokeWeight(1);
}

/*function draw() {
    background(0);
    for (var i = 30; i < 600; i += 30) {
        fill(255);
        line(i, 0, 1.5*i, 300);
    } 

}*/

function draw() {
    background(0);
    for (var i = 20; i < 400; i += 20) {   
      line(i, 0, canvasW, 0.5*i);
      stroke(lineR + i, lineG, lineB); 

      line(canvasW, canvasH, i, 0);
      stroke(lineR + i, lineG, lineB);

      line(0, i, i - 5, canvasH); 
      stroke(lineR + i, lineG, lineB);

      line(canvasW, i, -0.5*i, canvasH);
      stroke(lineR + i, lineG, lineB);
    }

}

For my string art project, I tried to construct an abstract piece based on the form of a leaf. Initially, it was a little difficult to understand how the relationships of the lines and edges changed with respect to i, but it was fairly easy once I figured out how to draw the first curve. I also tried to incorporate gradients into the coloring of this piece as well, and was very satisfied with the result.

Claire Lee – Looking Outwards – 04

I have always had a deep appreciation for the products of the intersection between art and biology. However, I’d only ever seen visual examples of this genre of work, so I was really excited and fascinated by Pierry Jacquillard’s Prélude in ACGT, a piece that takes the A-C-G-T (adenine, cytosine, guanine, thymine) order of Jacquillard’s own DNA and uses a Javascript-based program to convert it into the musical notes A, C, G, and T to a musical score. I really admired the concept of combining biology and music to create an organically generated musical piece that also holds deep meaning for an individual in regards to his own identity.

Prelude in ACGT, Chr. 1 to 22 and XY ECAL/Pierry Jaquillard

“This Prelude is important for me, as the technological advances are taking any data (including music) and turn them into DNA in order to save them for almost eternity as they promise. But for me, the most important is more the interpretation of a code rather than the materialism of the code itself. I think that maybe we are just generating data that will last centuries but the key to retrieve them won’t. They could be a kind of post-digital hieroglyphs.” 

Pierry Jacquillard

The algorithm that generated the work is written in JavaScript, using a midi library that generates signals to be converted into electronic sounds. I suppose that the DNA analysis is done outside of the code, but that the program takes the DNA analysis information and converts the A, C, G, and T to corresponding sound files. I believe that conceptually, this work is very simple, but that the concept in itself is very creative.

Claire Lee – Project 03 – Dynamic Drawing

project – 03 – seoyounl

var canvasW = 480
var canvasH = 640

function setup() {
    createCanvas(canvasW, canvasH);

}

function draw() {
    var drinkY = 300;
    var drinkH = 200;
    var drinkOpacity = 200 - (mouseY / 8);

    background(100 + (mouseX / 10), 150 + (mouseX / 10), 255);
    // background color changes with mouseX
    
    noStroke();
    fill(255, 200, 200);
    ellipse(canvasW / 2, 240, 300, 300);

    noStroke();
    fill(0);
    ellipse(180, 160, 15, 15);

    noStroke();
    fill(0);
    ellipse(300, 160, 15, 15);

    noStroke();
    fill(0);
    rect(235, 190, 10, 305);

    stroke(0);
    strokeWeight(4);
    line(210, 190, 270, 190);


    noStroke();
    fill(240, 130, 30, drinkOpacity);
    rect(170, drinkY + (mouseY / 4), 140, drinkH - (mouseY / 10));
    // drink height and opacity changes with mouseY
  
    noStroke();
    fill(60); 
    rect(0, 500, canvasW, canvasH - 500); 

    stroke(255);
    strokeWeight(4);
    noFill();
    rect(170, 250, 140, 250); 

    push();
    translate(0, (mouseY / 4.3));  
    rectMode(CENTER);
    noStroke();
    fill(255, 255, 255, 100);
    rect(200, 292, 50 - (mouseY / 100), 50 - (mouseY / 100), 5);
    pop(); 

    push();
    translate(0, (mouseY / 5)); 
    rectMode(CENTER);
    noStroke();
    fill(255, 255, 255, 100);
    rect(250, 320, 50 - (mouseY / 100), 50 - (mouseY / 100), 5);
    pop();

    push();
    translate(0, (mouseY / 4.3)); 
    rectMode(CENTER);
    noStroke();
    fill(255, 255, 255, 100);
    rect(280, 292, 50 - (mouseY / 100), 50 - (mouseY / 100), 5);
    pop();
    // ice cubes change size and position


}

This project was a really interesting way to experiment with changing shapes, colors, opacity, size, and position in a piece. I really enjoyed learning some new functions, and some other things I wish I could’ve implemented are rotations (in the ice cubes) and some more complex figures.

Claire Lee – Looking Outwards – 03

Mushtari is a 3D-printed wearable piece that incorporates microorganisms into channels throughout the piece, creating microbial “factories” that use synthetic biology to create different effects (such as pigments, scents, or chemicals) using various microorganisms’ photosynthetic byproducts.

Mushtari, Mediated Matter Group, 2015.

This piece is an fascinating example of computational digital fabrication, because it creates a synthetic piece by meshing organic elements and generative growth algorithms. Although the initial geometry and parameters were defined by a computational algorithm, the final product became much more complex: Mushtari grew from a single long 58-foot channel to a wearable piece that incorporated variations from relative strength of relaxation, attraction and repulsion between mesh vertices, and fluctuations in transparency to explore different degrees of photosynthesis.

Living Mushtari, directed by Neri Oxman and created by the Mediated Matter Group in collaboration with Stratasys, 2015.

Personally, I thought this piece was really interesting because it incorporated living elements into a computer-generated project, and then created a wearable piece that could be manipulated in various aspects.