Xu Xu – Project 07 – Curves

sketch

//Claire Xu
//xux1@andrew.cmu.edu
//Section B
//Project-07
var angle = 0;

function setup() {
    createCanvas(480, 480);
    frameRate(100);
}


function draw() {
    background("black");
    push();
    translate(width/2, height/2);
    rotate(radians(angle));
    angle += mouseX;
    drawAstroid();
    drawEightCurve();
    drawHypocycloid();
    pop();
}
function drawAstroid() {
    var b = map(mouseY, 0, width, -100, 150);
    strokeWeight(3);
    stroke(157,68,110);
    noFill();
    beginShape();
    for (var i = 0; i < 300; i++){
        var t = map(i, 0, 100, 0, TWO_PI);
        var x = (3*b*cos(t) + b*cos(3*t));
        var y = (3*b*sin(t) - b*sin(3*t));
        vertex(x, y);
    }
    endShape(CLOSE);

}
function drawEightCurve() {
    strokeWeight(2);
    stroke(252,158,33);
    noFill();
    var a = map(mouseX, 0, width, 0, 100); 
    beginShape();
    for (var i = 0; i < 800; i++){
        var t = map(i, 0, 100, 0, TWO_PI);
        var x = (a*sin(t));
        var y = (a*sin(t)*cos(t));
        vertex(x, y);
    }
    endShape(CLOSE);
}

function drawHypocycloid() {
    strokeWeight(1);
    stroke(255,111,97);
    noFill(); 
    var a = map(mouseX, 0, width, 0, 150);
    var b = map(mouseY, 0, width, 0, 150);
    beginShape();
    for(var i = 0; i < 400; i++){
        var angle2 = map(i, 0, 100, 0, TWO_PI);
        var x = ((a - b)* cos(angle2) - b*cos(((a - b))*angle2));
        var y = ((a - b)* sin(angle2) + b*sin(((a - b))*angle2));
        vertex(x, y);
    }
    endShape(CLOSE);
}

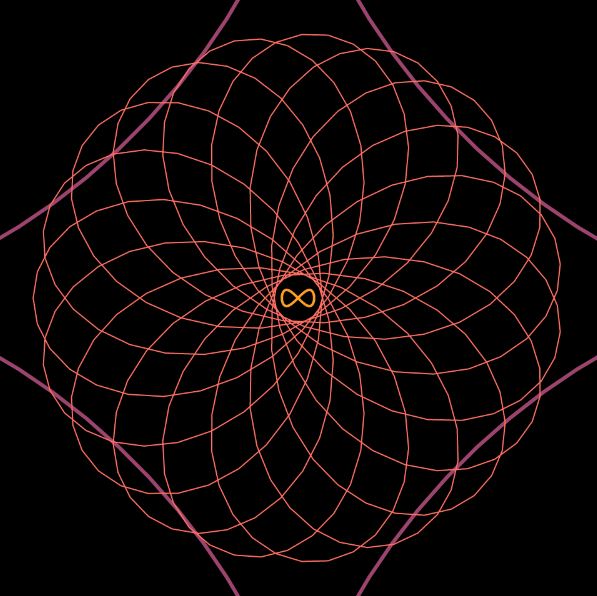
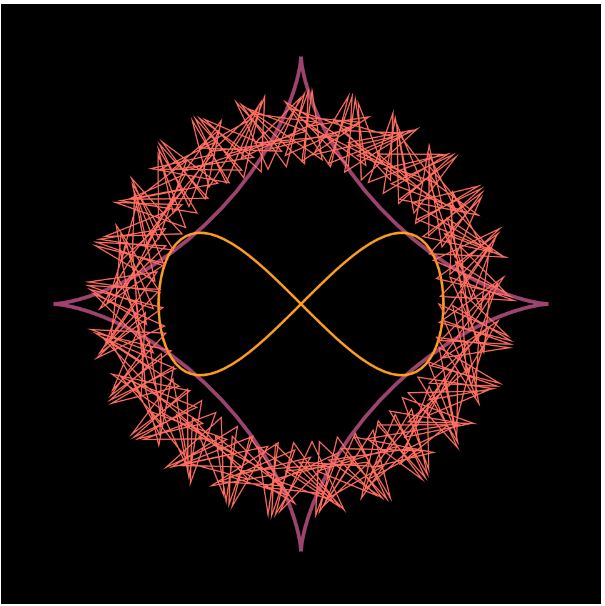
This project was quite challenging, because it took me a long time before I figured out what part of the code modified which part of the drawn form. I wanted to create spiraling geometric shapes that are web-like, and I was really interested in Hypocycloid, because it seemed to be less “restrictive” than other curves. I think the rotation makes it look more fun, because it gives the drawing a new dimension.

Xu Xu – Looking Outwards – 07

Building visual tools to manage Germany’s rail network and its hundreds of thousands of daily passengers.

The project Peak Spotting was created by Studio NAND in collaboration with Moritz Stefaner, intended to provide visualization to passenger loads and identify potential bottlenecks early on. This web application collects millions of data-points over 100 days into the future, then these data-points are integrated into custom developed visual tools such as animated maps, stacked histograms, path-time-diagrams and lists with mini visualizations.

The application is split into 4 sections horizontally: Calendar, Day view, Train collection, and Train details. This application was designed with the team at Deutsche Bahn and the later users. According to Stefaner, prototyping with Tableau proved very useful to learn quickly if specific features would prove useful and in which form.

This project had my interest because of it’s various forms of data visualization. Through a combination of graphs and animations, the user is able to grasp data quickly and make judgement early on. The visualizations communicate information while also being aesthetically pleasing to the eye.

Xu Xu – Project 06 – Abstract Clock

sketch

//Claire Xu
//xux1@andrew.cmu.edu
//Section B
//Project 05
var spacing = 400/30;
var distance = 400/30;
var diam = 4;

function setup() {
    createCanvas(400, 400);

}
function draw() {
    let s = second();
    let m = minute();
    let h = hour();
    background(245);
    //hour
    fill(33, 72, 39);
    arc(width/2, height/2, 350, 350, 0 + TWO_PI * h/12, PI + TWO_PI * h/12);
    noFill();
    strokeWeight(2);
    stroke(100);
    strokeCap(SQUARE);
    arc(width/2, height/2, 220, 220, 0 + TWO_PI * h/12, PI + TWO_PI * h/12);
    arc(width/2, height/2, 190, 190, 0 + TWO_PI * h/12, PI + TWO_PI * h/12);
    arc(width/2, height/2, 160, 160, 0 + TWO_PI * h/12, PI + TWO_PI * h/12);
    //minute
    noStroke();
    fill(163, 199, 139);
    arc(width/2, height/2, 325, 325, 0 + TWO_PI * m/60, PI + TWO_PI * m/60);
    noFill();
    strokeWeight(2);
    stroke(205);
    strokeCap(SQUARE);
    arc(width/2, height/2, 250, 250, 0 + TWO_PI * m/60, PI + TWO_PI * m/60);
    arc(width/2, height/2, 220, 220, 0 + TWO_PI * m/60, PI + TWO_PI * m/60);
    arc(width/2, height/2, 190, 190, 0 + TWO_PI * m/60, PI + TWO_PI * m/60);
    //second
    noStroke();
    fill(241, 225, 191);
    arc(width/2, height/2, 300, 300, 0 + TWO_PI * s/60, PI + TWO_PI * s/60);
    noFill();
    strokeWeight(2);
    stroke(255);
    strokeCap(SQUARE);
    arc(width/2, height/2, 280, 280, TWO_PI * s/60, PI + TWO_PI * s/60);
    arc(width/2, height/2, 250, 250, TWO_PI * s/60, PI + TWO_PI * s/60);
    arc(width/2, height/2, 220, 220, TWO_PI * s/60, PI + TWO_PI * s/60);
    //clock center
    noStroke();
    fill(241, 225, 191);
    circle(width/2, height/2, 100);
    fill("black");
    circle(width/2, height/2, 10);
}

For this project I was inspired by an abstract clock that I saw online, which abstracts the second/minute/hour hands, where it would have entire half-circle plates rotating to count the time. I used arc to draw the half-circles, and instead of trying to rotate the arc through the center, I discovered that I could just redraw the arc at new positions every frame according to the time. I wish I could figure out how to have holes in the half-circle plates like in the real abstract clock images. Unlike the real abstract clock reference, the line that’s tangent to the flat side of the half-circle is where the time is pointed at.

Xu Xu – Looking Outwards – 06

The stigmergic system is an agent-based growing tower created by Institute for advanced architecture of Catalonia. Through the use of this multi-agent-based system in a stigmergic environment, a column is created. The column starts at designated coordination points and moves to certain endpoints (or targets) following specific paths (or desired velocity). With the use of grasshopper code, the agents are guided through ‘steering’ so they move within the cylindrical shape. The Data Dam collects the agents with the network between adjacent points.

Afterwards, the velocity lines and network lines become visible, and the ‘variable-sweep’ makes the tower apparent. The combination of those towers creates the column, which happens in a bottom-up growing manner. The data inputs simply guide the agents, but the output is the randomness combined with steering and velocity. I admire the use of randomness in creating structures, which I can envision being applied to future architectural designs. Using randomness as part of our architectural creation is beginning to be introduced to the world.

A03 GVanlimburgstirum

Xu Xu -Project 05 – Wallpaper

sketch

//Claire Xu
//xux1@andrew.cmu.edu
//Section B
//Project 05
var diameter = 8;
var spacing = 600/12;
var distance = 600/40;
var diam = 4;

function setup() {
    createCanvas(570, 570);
}
function draw() {
    background("black");
//love
  for (var y = 0; y < 20; y += 1) {
        for (var x = 0; x < 15; x += 1) {
        	noStroke();
            fill("white");
            circle(x*spacing + (diameter/2) + 5, y* spacing * 3 + (diameter), diameter);
            circle(x*spacing + (diameter*1.5) +5 , y* spacing * 3 + (diameter), diameter);
            triangle(x*spacing +5, y* spacing * 3 + (diameter), x*spacing + (diameter)+5, y*spacing *3 + 2.5*diameter, x*spacing + (diameter*2) +5, y* spacing *3 + (diameter));
        }
    }
//death
  for (var y = 0; y < 20; y += 1) {
        for (var x = 0; x < 15; x += 1) {
        	strokeWeight(4);
          	stroke("white");
          	strokeCap(PROJECT);
            line(x*spacing + 5*diameter, y* spacing * 3 + 7.5*diameter,x*spacing + 3.5*diameter, y* spacing * 3 + 6*diameter);
            strokeCap(ROUND);
            line(x*spacing + 5*diameter, y* spacing * 3 + 6*diameter,x*spacing + 3.5*diameter, y* spacing * 3 + 7.5*diameter);
        }
    }
//robots
  for (var y = 0; y < 20; y += 1) {
        for (var x = 0; x < 15; x += 1) {
        	noStroke();
            fill("white");
            rect(x*spacing + 0.5*diameter+3, y* spacing * 3 + 12*diameter, diameter*2, diameter*2);
            fill("black");
            circle(x*spacing + diameter+3, y* spacing * 3 + 12.5*diameter, diam);
            circle(x*spacing + 2*diameter+3, y* spacing * 3 + 12.5*diameter, diam);
        }
    }  

    noLoop();
}

For this project, I was inspired by the patterns of the Netflix show “Love, Death + Robots”, which I wanted to incorporate as part of my wallpaper design. Therefore I used the black and white logo colours, and organized the logos onto the wallpaper. I included details such as the different stroke caps of the “death” symbol, but to me organizing the logos using code was the most challenging part.

Xu Xu – Looking Outwards – 05

Alexey Kashpersky is a 3D digital artist who has experience in creating CG artworks, large amounts of 3D models for televisions, and 3D printing studios. His series of Virus artworks are intended to raise awareness, such as this Hepatitis C artwork. While visually pleasing to the eye, the video was intended to capture attention, imply the hidden dangers of an undiagnosed HCV infection, and generate awareness of this bloodborne pathogen. Through thoughtful abstractions, the morphological form of the Virus is created in order to express the hidden dangers of this virus, yet still portraying a certain amount of realism. VR was utilized to create a sense of realism in this piece of work. I admire the attention to detail and the cleanness of his 3D artworks, which I can only imagine he used certain 3D modeling softwares to create these artworks. It is apparent that the virus is deadly, despite its beautiful form and colour.

Outside of the digital world, Alexey is a strong believer in living a healthy lifestyle – one which would allow him to live life to its fullest. He says, “…perhaps one day, I will decide to go diving along the coral reefs or explore thousand year-old caves at the ends of the Earth.” But for now, he’s happy to show the world where his imagination takes him through his art.  (Autodesk)

Xu Xu – Project 04 – String Art

sketch

//Claire Xu
//xux1@andrew.cmu.edu
//Section B
//Project 04
function setup() {
    createCanvas(400, 300);
}

function draw() {
    background(0);
    for (var i = 0; i < width; i += 10){
        //horizontal colour
        stroke(255-(i/1.2),200-(i/1.2),100-(i/1.2));
        //horizontal curves set1
        line(i,mouseY, 0,i-mouseX);
        line(i,mouseY, 0,i+mouseX);
        //horizontal curves set2
        line(width-i, mouseY, width, i-mouseX);
        line(width-i, mouseY, width, i+mouseX);
        //vertical colour
        stroke(100-(i/1.2),200-(i/1.2),255-(i/1.2));
        //vertical curves set1
        line(i-mouseX, 0, mouseY+100, i);
        line(i+mouseX, 0, mouseY+100, i);
        //vertical curves set2
        line(i-mouseX, height, mouseY+100, height-i);
        line(i+mouseX, height, mouseY+100, height-i);

    }

}

For this project, I was experimenting with lines that would change and form patterns with the change of mouse. I was also playing with colour to create a gradient effect, and when certain patterns are formed some lines would look like dashed lines due to colour and crisscrossing patterns.

Xu Xu – Looking Outwards – 04

For this week’s looking outwards, I discovered an audiovisual installation called “Multiverse” created by fuseworks. This installation discovers the evolution of possible universes through the generation of haunting visual graphics and sound and strives to define the theorization of the multiverse: where infinite numbers of universe co-exist parallel outside space-time.

In the video, it presents the installation almost like a digital painting, which produces beautiful visuals accompanied by the audio. The installation explores and tries to imagine the birth/death of infinite parallel universes, and this “narrative” is based on American theoretical physicist Lee Smolin’s scientific theory. From the fall of black holes comes their decedents, the parameters and physical laws constantly tweaked and modified. This installation tries to create intimacy between the art and the viewer, yet creating two hierarchies: an impermanent, vulnerable human figure vs a vast, impenetrable universe.

The artworks are completely generated by the software developed in openFrameworks, which interacts with the generative system soundtrack of Ableton Live and Max/MSP. In the simulation, the physical laws are constantly being adjusted, which leads to the origin of a “new universe”. After thirty minutes, the previous sequences “evolve” and provide infinite new various outcomes. The creator of this installation explains: “Particularly, the particles react with each other and with the surrounding space, changing the information perceived by modifying a vector field that stores the values within a voxel space. The strategy involved the massive use of shader programs that maximize the hardware performance and optimize the graphics pipeline on the GPU.”

I really admire the creativity of this installation, but what amazes me is that these beautiful visuals are generated purely from the software. Creators provide the framework and allow the program to develop freely from there to present its creativity. I wish I have the chance to see the installation in real life.

Xu Xu – Project 03 – Dynamic Drawing

sketch

var cable = 640;
var finger = 480;
var fingercolour1 = 350;
var fingercolour2 = 380;
var light1 = 0;
var light2 = 0;
var light3 = 0;
var light4 = 0;
var light5 = 0;
var light6 = 0;
var ow = 0;

function setup() {
    createCanvas(480, 640);
}

function draw() {    
    background(50);
//light
    noStroke();
    fill(255,267,13,light1);
    ellipse(width/2, height/3, 80,80);
    fill(255,267,13,light2);
    ellipse(width/2, height/3, 155, 155);
    fill(255, 267, 13,light3);
    ellipse(width/2, height/3, 250, 250);
    fill(255, 267, 13,light4);
    ellipse(width/2, height/3, 370, 370);
    fill(255, 267, 13,light5);
    ellipse(width/2, height/3, 600, 600);
    fill(255, 267, 13, light6);
    ellipse(width/2, height/3, 800, 800);
//Finger
    strokeWeight(3);
    fill(227,mouseX-fingercolour1,mouseX-fingercolour2);
    ellipse(finger, 200, 40, 20);
    circle(finger + 50, 220, 50);
    noStroke();
    rect(finger, 190, 50, 20);
    rect(finger + 50, 190, 300, 40);
    fill(208, 156, 158);
    ellipse(finger-10, 198, 15, 10);
//cable
    stroke("black");
    fill("gray");
    beginShape();
    vertex(220, cable);
    vertex(230, cable - 30);
    vertex(250, cable - 30);
    vertex(260, cable);
    endShape();
    line(237,cable-30, 232, cable);
    line(243, cable - 30, 247, cable);
    rect(220,cable,40,55);
    fill("yellow");
    rect(199, cable + 55, 80, 20);
    rect(210, cable + 75, 60, 30);
    strokeWeight(15);
    rect(235, cable + 111, 10, 100);
//lightbulb
    strokeWeight(5);
    noFill();
    arc(width/2, height/3, 200,200, 300,0);
    arc(width/2, height/3, 200,200, 180,150);
    strokeWeight(5);
    stroke("black");
    line(140,height/3, 190,350);
    line(340,height/3, 290,350);
    fill("black");
    rect(170,350,138,10);
    strokeWeight(15);
    line(290, 375, 190, 385);
    line(290, 400, 190, 410);
    line(290, 425, 190, 435);
    fill("black");
    rect(220, 440, 40, 30);
//lightbulb interior
    strokeWeight(3);
    noFill();
    beginShape();
    vertex(220, 350);
    vertex(180, 220);
    vertex(195, 205);
    vertex(210, 220);
    vertex(225, 205);
    vertex(240, 220);
    vertex(255, 205);
    vertex(270, 220);
    vertex(285, 205);
    endShape();
    if (mouseY > 420){
    	cable = mouseY + 50;
	}	
    if (cable < 490 & cable > 370){
		light1 = 100;
		light2 = 75;
		light3 = 55;
		light4 = 35;
		light5 = 15;
		light6 = 5;
	}
    else{
		light1 = 0;
		light2 = 0;
		light3 = 0;
		light4 = 0;
		light5 = 0;
		light6 = 0;
	}
    if (mouseX > 355){
		finger = mouseX;
	}
    if(finger < 365 & cable<490 & cable > 370){
		textSize(20);
		textFont("old english");
		fill("white");
		text("OW!",420, 50);
	}
}

I wanted to create dynamic drawing that incorporates the change of mouseX and mouseY, so I created a lightbulb that will be turned on when the cable is plugged in, and the finger is able to reach the lightbulb. If the finger touches the bulb while it’s on, the person will scream “ow”.

Xu Xu – Looking Outwards – 03

The project that I decided to choose is the ICD/ITKE Research Pavilion 2016-17: Interactive Panorama by Heiko Stachel. This research pavilion investigates building scale fabrication of glass and carbon-fibre reinforced composites. I was attracted to it due to its unique form, and I admire the beautiful cantilever structure that incorporates a sort of weaving pattern. Due to the fibre composites’ lightweight and long-span characteristics, the project was carried out using different methods: a combination of unmanned aerial vehicles (UAE), which has low payload but long-range, and industrial robots, which is precise, strong but has limited reach. According to the research institute, this design was inspired by “two species of leaf miner moths, the Lyonetia clerkella and the Leucoptera erythrinella, whose larvae spin silk “hammocks” stretching between connection points on a bent leaf”. Certain concepts were abstracted from the biological models such as the combination of bending structures, fibre orientations and hierarchy, and three-dimensional geometries to create the new, innovative form.

The algorithm methods weren’t listed in the research institute’s website, but I assume that the fabrication of this structure is similar to 3d printing, but on a much larger scale. The algorithm somehow transforms the digital model (perhaps done by Rhinoceros), and uses robots to print out the structure layer by layer.