Kristine Kim – Project 07 – Curves

sketch

//Kristine Kim
//Section D
//younsook@andrew.cmu.edu
//Project- 07- Curves
var nPoints = 70

function setup() {
    createCanvas(480, 480);
    frameRate(10);
}

function draw() {
    background(67, 42, 135);
    //calling all the functions 
    //drawing all of them on the center of the canvas

    push();
    translate(width/2, height/2);
    drawMovinglines();
    drawHypotrochoid();
    drawEpitrochoidCurve();   
    pop();
}

/*drawing the EpitrochoidCurve filled with
colors that are determined by mouseX and mouseY */
//the image that is drawing on top of everything
function drawEpitrochoidCurve(){

    var x;
    var y;

    var r1 = 100
    var r2 = r1 / mouseX;
    var h = constrain(mouseX, r1 , r2) 
    noStroke();
    fill(mouseY, 245, mouseX);
    beginShape();
    //for loop to draw the epitrochoidcurve
    for (var i = 0; i < nPoints; i++){
        var t = map(i, 0, nPoints, 0, TWO_PI);
        x = (r1 + r2) * cos(t) - h * cos(t * (r1 + r2) / r2);
        y = (r1 + r2) * sin(t) - h * sin(t * (r1 + r2) / r2);
        vertex (x,y);
    }
    endShape(CLOSE);
}
/*drawing the hypotrochoid with vertexs with
colors determined by mouseY */
//the first layer, drawing behind the epitrochoidcurve and movinglines

function drawHypotrochoid(){
    var x;
    var y;

    var r1 = 250
    var r2 = r1/ mouseX;
    var h = constrain(mouseY, r1, r2)
    stroke(mouseY, 200, 73);
    noFill();
    beginShape();
    //for loop for drawing the hypotrochoid form
    for (var i = 0; i < nPoints; i ++){
        var t = map(i, 0, nPoints, 0 , TWO_PI);
        x = (r1- r2) * cos(t) + h * cos(t * (r1 - r2) / r2);
        y = (r1- r2) * sin(t) + h * sin(t * (r1 - r2) / r2);
        vertex(x,y)
    }
    endShape(CLOSE);
}
/*drawing the constiently moving/wiggling circle
the radius and fill all controlled by mouseX and mouseY
the second layer, between the epitrochoidcurve and hypotrochoid */

function drawMovinglines(){
    var x;
    var y;
    var r1 = mouseX
    fill(mouseX, mouseY, mouseX)

    beginShape();
    //for loop for drawing the wiggling circle
    for (var i = 0; i < nPoints; i++) {
        var t = map(i, 0, nPoints, 0, TWO_PI);
        var x = r1 * cos(t);
        var y = r1 * sin(t);
        vertex(x + random(-5, 5), y + random(-5, 5));
    }
    endShape(CLOSE);

}
    

I was first very intimidated by this project because it looked so complicated and intricate, but I studying the website provided to us was very helpful. The little explanations and gif helped me understand the concept a lot. There are just so many ways we can execute this project so I struggled with starting the project, but once I drew the Hypotrochoid function, I knew how to approach this project. I played around with the quantity of nPoints, fill(), stroke(), and a lot with mouseX and mouseY until I ended up with the product that I have right now . I enjoyed creating this a lot because I love discovering new images and findings so I was pleasantly surprised every single time I changed something in my code and found different drawings.

Kristine Kim – Looking Outward – 07

Emoto installation , Studio NAND

Emoto Installation, created by Studio NAND, is a  computational information visualization project that executes the global response/data collected from  Twitter around the London 2012 Olympic Games in an interactive online visualization and physical data sculpture. Based on approximately 12.5 million Twitter messages which were collected in real-time, this project recorded trending topics and how they were discussed online in an interactive visualization which was running live during the same time as the Games in July and August 2012. Each Tweet was annotated with a sentiment score by the project’s infrastructure using software provided by Lexalytics. This data formed the basis for an extensive profiling of London2012 which was finally documented in this interactive installation and physical data sculpture at the WE PLAY closing exhibition of the Cultural Olympiad in the Northwest. I was drawn into this installation because not only it was executed well online, but it was also presented in a physical form/installation.  It was easily recognizable and accesible to understand the project and the data visualization.  The video captures the intentions and content of the project really well and it helped me to understand Emoto Installation more. I love the details of the usage of light projection, color, laser cut, and text all incorporated very well into one installation. I admire the level of detail and effort that was put into this project, the depth of the research and data visualization is very inspiring. 

Emoto Installation Video, Studio NAND

Kristine Kim- Project 06- Abstract-Clock


sketch

//Kristine Kim
//Section D
//younsook@andrew.cmu.edu
//Project -06- Abstract Clock


var prevSec;

//cloud
var dx = 0;
var x = 30
var y = 110;
var db = 120


function setup() {
    createCanvas(480, 380);
    secondRolloverTime = 0;
    noStroke();
}

function draw() {
    background('lightblue'); // sky


//grass
    var grassTop = 330;
    var grassBottom = 380;
    var grassTilt = 30;


    for(var g = 0 - 30; g < 530; g = g + 10){
        stroke(3, 168, 50);
        strokeWeight(3);
        line(g + grassTilt, grassTop, g, grassBottom);
        line(g - grassTilt, grassTop + 10, g, grassBottom);
  }


//clock part

    var H = hour();
    var M = minute();
    var S = second();
    
    // Reckon the current millisecond, 
    // particularly if the second has rolled over.
    // Note that this is more correct than using millis()%1000;

    if (prevSec != S) {
        secondRolloverTime = millis();
    }
    prevSec = S;

    var mils = floor(millis() - secondRolloverTime);

   
    var hourballoonheight   = map(H, 0, 23, 0, height);
    var minuteballoonheight = map(M, 0, 59, 0, height);
    var secondballoonheight = map(S, 0, 59, 0, height);

    
    // // Make a bar which *smoothly* interpolates across 1 minute.
    // // We calculate a version that goes from 0...60, 
    // // but with a fractional remainder:

    var secondsWithFraction   = S + (mils / 1000.0);
    var secondballoonheightSmooth  = map(secondsWithFraction, 0, 60, 0, height);


    //hour balloon (green)
    stroke(255);
    strokeWeight(5);
    line(80,330 - hourballoonheight, 80, 500 - hourballoonheight)

    noStroke();
    fill(138, 199, 107);
    triangle(80, 330 - hourballoonheight, 50 ,  390 - hourballoonheight , 110,  390 - hourballoonheight);
    
    fill(168, 247, 129);
    stroke(138, 199, 107);
    strokeWeight(5);
    ellipse(80, 300 - hourballoonheight, db, db + 30);


    //minute balloon (pink)
    strokeWeight(5);
    stroke(255);
    line(240,330 - minuteballoonheight, 240, 500 - minuteballoonheight)

    noStroke();
    fill(214, 152, 227);
    triangle(240, 330 - minuteballoonheight, 210 ,  390 - minuteballoonheight , 270,  390 - minuteballoonheight);
    
    fill(247, 209, 255);
    stroke(214, 152, 227);
    strokeWeight(5);
    ellipse(240, 300 - minuteballoonheight, db, db + 30);

    //seconds balloon(yellow)
    stroke(255);
    line(400,330 - secondballoonheightSmooth, 400, 500 - secondballoonheightSmooth)

    noStroke();
    fill(196, 209, 96);
    triangle(400, 330 - secondballoonheightSmooth, 370 ,  390 - secondballoonheightSmooth , 430,  390 - secondballoonheightSmooth);
    
    stroke(196, 209, 96);
    strokeWeight(5);
    fill(246, 255, 176);
    ellipse(400, 300 - secondballoonheightSmooth, db,db + 30);


    translate(dx,0);
    dx ++;

    for(var c = 0; c < 3; c++){
        fill(245);
        noStroke()
        ellipse(c * x *-1, y, 50, 50);
        ellipse(c * x + 160 * -1, y - 80, 50, 50);
        ellipse(c *x + 300 * -1, y + 35, 50, 50);
        //if (dx -50 > width){
            //dx = -100;
        if ( dx - 350 > width){
        dx = -50
        }
    } 


    }


When I was brainstorming for this project, I saw a balloon fly outside my window and that sparked an idea in my head; to represent time with balloons flying. I didn’t want just the balloons to be the only things in the canvas so I put them in a setting. I created grass and clouds to make my abstract clock more interesting. I struggled with having the balloons and the triangles move according to the hour/minute/second variables the most. I am very glad I added those elements because it resulted in an animation for my abstract clock . 

Kristine Kim – Looking Outward-06

Path, Casey Reas, 2001

Casey Reas is a generative artist and owns a website that is filled with variety of different types of generative art but the ones that I was most drawn into was Path and Tissues. They are both executed and created in a similar technique and are built around the ideas of neuroanatomist Valentino Braitenberg. They are a series of prints and images that documents the movement of synthetic neural systems. Each line in the image reveals the history of one system’s movement as it navigates its environment. I love these projects because of the textures its creating randomly and also the rapid movement it captures. I think the idea behind the works are executed very well. I personally admire Path a little bit more than Tissues because of its’ color palette. The combination of both cool and warm color makes the piece more livid and interesting. There is no end to observing these prints because there are so many details and “paths” that leads the audience into, but I love that about Path and Tissues. Rea’s website contains many more generative arts and prints that are very admirably and interesting. 

http://reas.com/path_p/

Tissues, Casey Reas, 2002

Kristine Kim – Project -05-Wallpaper


sketch

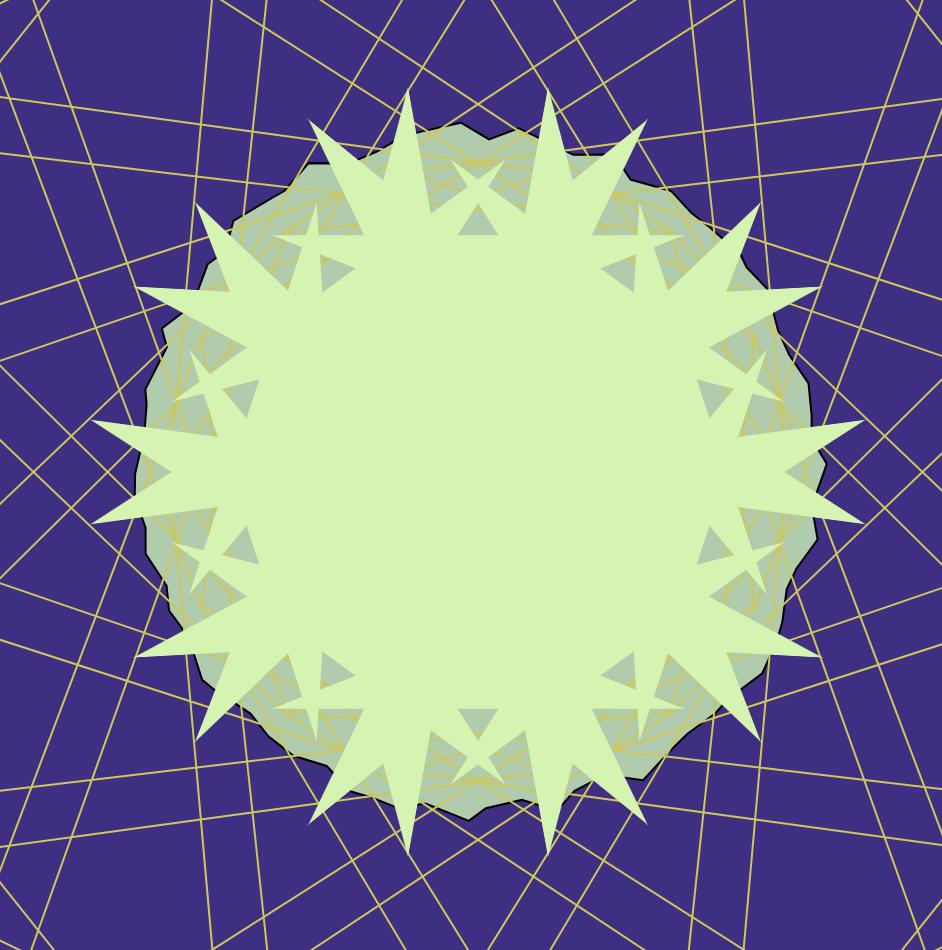
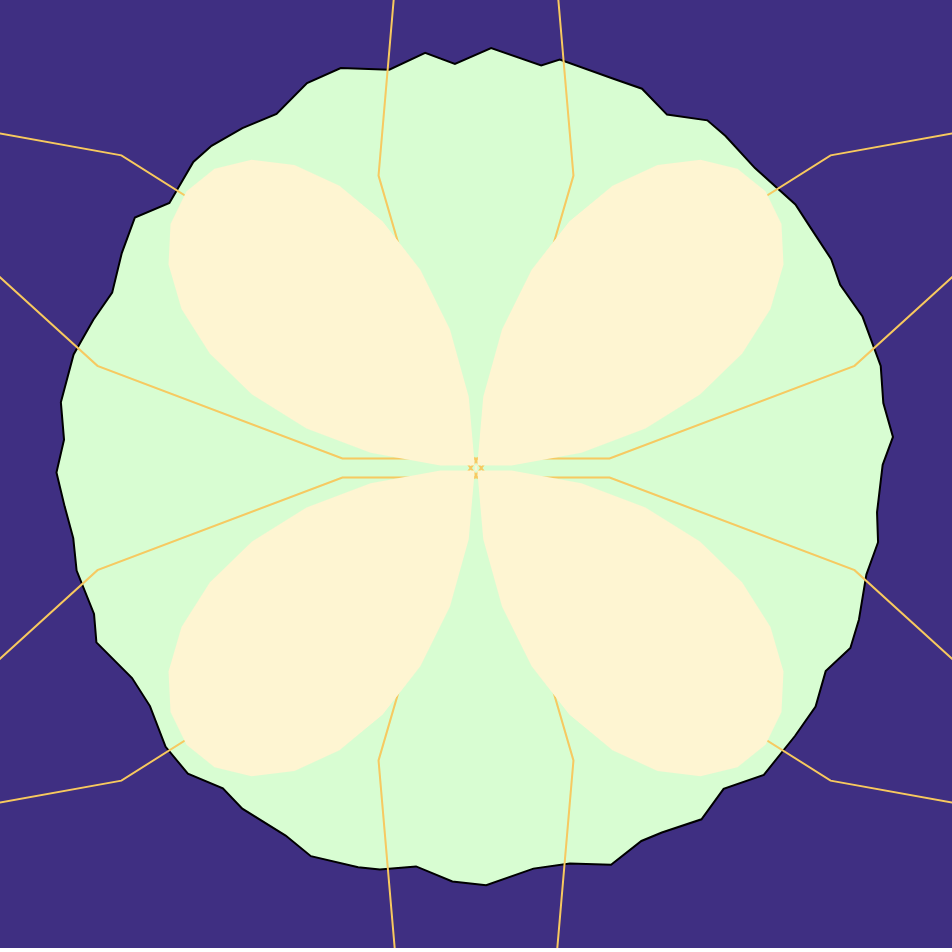
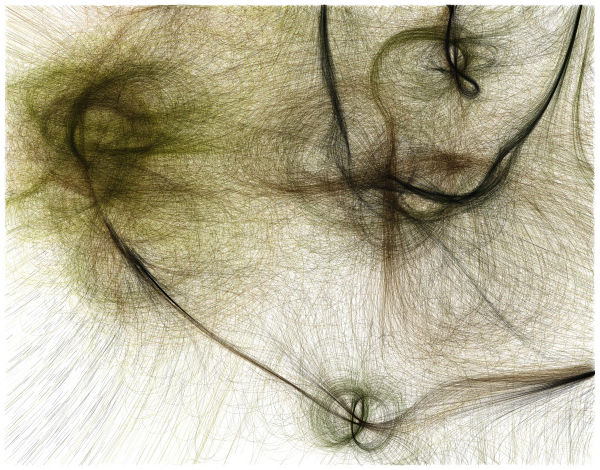
For this project, I wanted to use curved lines instead of rigid geometric shapes so I used sin() and cos() to portray that. I also wanted to convey a little bit of depth and dimension, so I had shadows to the curves and circles in the background. The color of the circles are a couple of shades darker than the background color so that it could help portray more dimension.

index

//Kristine Kim
//Section D
//younsook@andrew.cmu.edu
//Project-05- Wallpaper
var x1 = 100; //x of the rect
var y1 = 100; //y of the rect

function setup() {
    createCanvas(500, 600);
    noLoop();   
}

function draw() {
    background(150, 200, 150);

//circles in the background
    for (var y = 0; y < height; y += 2 ) {
        for (var x = 0; x < width; x += 2) {
            var rx = x1 + x *25
            var ry = y1 + y * 25
            noFill();
            strokeWeight(3);
            stroke(245);
            rect(rx-100, ry-100, 60, 60);
            fill(150, 143, 255);

        }
    }

// 1st row of the curves
    for (var x = 0; x < width/4-20; x = x + 1) {
        fill(245);
        point(x, 60 - 50 * sin(radians(x)) - 40);
        point(x + 135, 60 - 50 * sin(radians(x)) - 40);
        point(x + 265, 60 - 50 * sin(radians(x)) - 40);
        point(x + 390, 60 - 50 * sin(radians(x)) - 40);

        fill(255, 191, 241);
        point(x, 60 - 50 * cos(radians(x)) - 40);
        point(x + 135, 60 - 50 * cos(radians(x)) - 40);
        point(x + 265, 60 - 50 * cos(radians(x)) - 40);
        point(x + 390, 60 - 50 * cos(radians(x)) - 40);

// shadows for the 1st row
        strokeWeight(8);
        fill(110);
        point(x, 60 - 50 * sin(radians(x)) - 47);
        point(x, 60 - 50 * cos(radians(x)) -47);
        point(x + 135, 60 - 50 * sin(radians(x)) -47);
        point(x + 135, 60 - 50 * cos(radians(x)) -47);
        point(x + 265, 60 - 50 * sin(radians(x)) - 47);
        point(x + 265, 60 - 50 * cos(radians(x)) - 47);
        point(x + 390, 60 - 50 * sin(radians(x)) - 47);
        point(x + 390, 60 - 50 * cos(radians(x)) - 47);
 
 //2nd row
        fill(245);
        point(x, 60 - 50 * sin(radians(x)) + 50);
        point(x + 135, 60 - 50 * sin(radians(x)) + 50);
        point(x + 265, 60 - 50 * sin(radians(x)) + 50);
        point(x + 390, 60 - 50 * sin(radians(x)) + 50);

        fill(255, 191, 241);
        point(x, 60 - 50 * cos(radians(x)) + 50);
        point(x + 135, 60 - 50 * cos(radians(x)) + 50);
        point(x + 265, 60 - 50 * cos(radians(x)) + 50);
        point(x + 390, 60 - 50 * cos(radians(x)) + 50);

 //shadows for the 2nd row  
        strokeWeight(8)
        fill(110);
        point(x, 60 - 50 * sin(radians(x)) + 57);
        point(x, 60 - 50 * cos(radians(x)) + 57);
        point(x + 135, 60 - 50 * sin(radians(x)) + 57);
        point(x + 135, 60 - 50 * cos(radians(x)) + 57);
        point(x + 265, 60 - 50 * sin(radians(x)) + 57);
        point(x + 265, 60 - 50 * cos(radians(x)) + 57);
        point(x + 390, 60 - 50 * sin(radians(x)) + 57);
        point(x + 390, 60 - 50 * cos(radians(x)) + 57);

//3rd row
        fill(245);
        point(x, 60 - 50 * sin(radians(x)) + 150);
        point(x + 135, 60 - 50 * sin(radians(x)) + 150);
        point(x + 265, 60 - 50 * sin(radians(x)) + 150);
        point(x + 390, 60 - 50 * sin(radians(x)) + 150);

        fill(255, 191, 241);
        point(x, 60 - 50 * cos(radians(x)) + 150);
        point(x + 135, 60 - 50 * cos(radians(x)) + 150);
        point(x + 265, 60 - 50 * cos(radians(x)) + 150);
        point(x + 390, 60 - 50 * cos(radians(x)) + 150);

//shadows for 3rd row
        strokeWeight(8); 
        fill(100);
        point(x, 60 - 50 * sin(radians(x)) + 157);
        point(x, 60 - 50 * cos(radians(x)) + 157);
        point(x + 135, 60 - 50 * sin(radians(x)) + 157);
        point(x + 135, 60 - 50 * cos(radians(x)) + 157);
        point(x + 265, 60 - 50 * sin(radians(x)) + 157);
        point(x + 265, 60 - 50 * cos(radians(x)) + 157);
        point(x + 390, 60 - 50 * sin(radians(x)) + 157);
        point(x + 390, 60 - 50 * cos(radians(x)) + 157);


//4th row
       fill(245);
        point(x, 60 - 50 * sin(radians(x)) + 250);
        point(x + 135, 60 - 50 * sin(radians(x)) + 250);
        point(x + 265, 60 - 50 * sin(radians(x)) + 250);
        point(x + 390, 60 - 50 * sin(radians(x)) + 250);

        fill(255, 191, 241);
        point(x, 60 - 50 * cos(radians(x)) + 250);
        point(x + 135, 60 - 50 * cos(radians(x)) + 250);
        point(x + 265, 60 - 50 * cos(radians(x)) + 250);
        point(x + 390, 60 - 50 * cos(radians(x)) + 250);

//shadows for 4th row
        strokeWeight(8); 
        fill(100);
        point(x, 60 - 50 * sin(radians(x)) + 257);
        point(x, 60 - 50 * cos(radians(x)) + 257);
        point(x + 135, 60 - 50 * sin(radians(x)) + 257);
        point(x + 135, 60 - 50 * cos(radians(x)) + 257);
        point(x + 265, 60 - 50 * sin(radians(x)) + 257);
        point(x + 265, 60 - 50 * cos(radians(x)) + 257);
        point(x + 390, 60 - 50 * sin(radians(x)) + 257);
        point(x + 390, 60 - 50 * cos(radians(x)) + 257);


//5th row
        fill(245);
        point(x, 60 - 50 * sin(radians(x)) + 350);
        point(x + 135, 60 - 50 * sin(radians(x)) + 350);
        point(x + 265, 60 - 50 * sin(radians(x)) + 350);
        point(x + 390, 60 - 50 * sin(radians(x)) + 350);

        fill(255, 191, 241);
        point(x, 60 - 50 * cos(radians(x)) + 350);
        point(x + 135, 60 - 50 * cos(radians(x)) + 350);
        point(x + 265, 60 - 50 * cos(radians(x)) + 350);
        point(x + 390, 60 - 50 * cos(radians(x)) + 350);

//shadows for 5th row
        strokeWeight(8); 
        fill(100);
        point(x, 60 - 50 * sin(radians(x)) + 357);
        point(x, 60 - 50 * cos(radians(x)) + 357);
        point(x + 135, 60 - 50 * sin(radians(x)) + 357);
        point(x + 135, 60 - 50 * cos(radians(x)) + 357);
        point(x + 265, 60 - 50 * sin(radians(x)) + 357);
        point(x + 265, 60 - 50 * cos(radians(x)) + 357);
        point(x + 390, 60 - 50 * sin(radians(x)) + 357);
        point(x + 390, 60 - 50 * cos(radians(x)) + 357);

//6th row  
        fill(245);
        point(x, 60 - 50 * sin(radians(x)) + 450);
        point(x + 135, 60 - 50 * sin(radians(x)) + 450);
        point(x + 265, 60 - 50 * sin(radians(x)) + 450);
        point(x + 390, 60 - 50 * sin(radians(x)) + 450);

        fill(255, 191, 241);
        point(x, 60 - 50 * cos(radians(x)) + 450);
        point(x + 135, 60 - 50 * cos(radians(x)) + 450);
        point(x + 265, 60 - 50 * cos(radians(x)) + 450);
        point(x + 390, 60 - 50 * cos(radians(x)) + 450);

//shadows for 6th row
        strokeWeight(8); 
        fill(100);
        point(x, 60 - 50 * sin(radians(x)) + 457);
        point(x, 60 - 50 * cos(radians(x)) + 457);
        point(x + 135, 60 - 50 * sin(radians(x)) + 457);
        point(x + 135, 60 - 50 * cos(radians(x)) + 457);
        point(x + 265, 60 - 50 * sin(radians(x)) + 457);
        point(x + 265, 60 - 50 * cos(radians(x)) + 457);
        point(x + 390, 60 - 50 * sin(radians(x)) + 457);
        point(x + 390, 60 - 50 * cos(radians(x)) + 457);

//7th row
        fill(245);
        point(x, 60 - 50 * sin(radians(x)) + 550);
        point(x + 135, 60 - 50 * sin(radians(x)) + 550);
        point(x + 265, 60 - 50 * sin(radians(x)) + 550); 
        point(x + 390, 60 - 50 * sin(radians(x)) + 550);

       
        fill(255, 191, 241)
        point(x, 60 - 50 * cos(radians(x)) + 550);
        point(x + 135, 60 - 50 * cos(radians(x)) + 550);
        point(x + 265, 60 - 50 * cos(radians(x)) + 550);
        point(x + 390, 60 - 50 * cos(radians(x)) + 550);

//shadows for 7th row
        strokeWeight(8); 
        fill(100);
        point(x + 390, 60 - 50 * sin(radians(x)) + 557);
        point(x + 390, 60 - 50 * cos(radians(x)) + 557);
        point(x + 265, 60 - 50 * sin(radians(x)) + 557);
        point(x + 265, 60 - 50 * cos(radians(x)) + 557);
        point(x + 135, 60 - 50 * sin(radians(x)) + 557);
        point(x + 135, 60 - 50 * cos(radians(x)) + 557);
        point(x, 60 - 50 * sin(radians(x)) + 557);
        point(x, 60 - 50 * cos(radians(x)) + 557);
    }
}


Kristine Kim – Looking Outwards -05

Antoni Tudisco, Summer Update Series, 2018
Antoni Tudisco, Summer Update, 2018

Antoni Tudisco is a German 3D artist and motion designer. The artist never revealed his technique and process behind his works. I can only assume that he uses already developed softwares like adobe creative cloud but I am also so interested and confused on how he creates all these hyper realistic textures with such limitation (computer generated).  He creates many commercial arts and works for big companies. I was drawn into this piece because of his usage of collaborating realistic textures and abstract illustration together. The way Tudisco renders his 3D works and motion graphics is very unique and complex. The vibrancy and extremely abstract imagery helps Antoni Tudisco build his style and his pieces only work because it is computer generated and all done on a device. I admire Antoni Tudisco because of  the endless amount of 3D works and motion graphics he produces with just a computer.

Antoni Tudisco, Beat the Robots, 2018. Motion graphic

Kristine Kim – Project – 04- String Art

sketch

//Kristine Kim
//section D
//younsook@andrew.cmu.edu
//Project-04-String-Art

var bright = 0;

function setup() {
    createCanvas(400, 300);
    noStroke()
}

function draw() {
  //background is fading from black to white and 
  //when it turns white, it goes back to black and fad  
    
   background(bright);
    bright = bright + 1;
    if (bright == 255){
        bright = 0
     }
    
//all the colors are controlled by mouseX and mouseY
   
   for(var i = 0; i<= 400; i+= 15){
// the top right corner web
        stroke(26, 9, mouseX);
        line(i, 0, 400, i);
// the bottome left corner web
        stroke(mouseX, 9, 217);
        line(0, i, i - 5, height);
//the bigger web that covers half of the canvas diagonally
        stroke(0, mouseX, 217);
        line(400, -i, i + 5, height);
//the  right 
        stroke(100, mouseY, 200);
        line(mouseX, mouseY, 400, i);

        stroke(100, mouseY, 200);
        line(0, i, mouseX, mouseY);
    }
     
//moueseX and mouseY controlling the vertical lines
    for(var i = 0; i < 400; i += 18){  
        strokeWeight(1.5);
        stroke(255);

        line(mouseX, i * 3, width / 2, i - 10);
        stroke(247, 255, 140);
        line(mouseX, i * 3, mouseY + 50, i - 10);
        stroke(247, 255, 140);
        line(mouseX, i * 3, mouseY - 50, i - 10);
   }
}

This project was both very fun and challenging. I played around with different functions and codes that we learned in the previous weeks, such as fading background, mouseX mouseY, etc.

Kristine Kim – Looking Outward – 04

Amanda Ghassaei, SugarCube: a grid-based MIDI and MaxMSP interface that produces sounds with different tilt movements.

Sugarcude, an arduino powered grid-based MIDI,Musical Instrument Digital Interface, controller boots up into a variety of apps to produce sounds. Amanda Ghassaei, the creator behind this piece was inspired by the monome and tenori-on when she was in college. She focused on having the controller itself do all the app processing, not relying on a computer to process button presses/analog controls into MIDI, which makes it portable. The controller can boot up to 7 different apps even though it has the potential to boot up to 16 total. This device is primarily a MIDI controller, but the artist also wrote an app that allows the audience to pull the button and analog data into Max MSP and control audio. I was drawn into this project because of its simple design and its ability to produce sound by itself. After examining the artist’s website and her procedures into making SugarCube, I was more intrigued by concept and idea behind her work. The website contains a lot more complex and detailed steps of the project.

https://www.instructables.com/id/Sugarcube-MIDI-Controller/

Demonstration Video of the instructions of how to use the cube.

Kristine Kim – Looking Outward-03

Glass II at La Triennale di Milano. Top view of the three columns in high brightness mode. Designed and constructed by the Mediated Matter group, MIT Media Lab.

Glass II, a sequel of project Glass I by Andy Ryan is a high- fidelity, monumental, and additive manufacturing technology for 3D printing “optically transparent glass.” To create the computational aspect of the installation, the team used constraints of the manufacturing platform and structural system and generated each of the glass column’s form. This demonstrates the ability to 3D print a wide range of shapes and sizes determined by the desired outcome of the creator. I was drawn into this project because of the dynamic and contrasting light source and its simple yet intense atmosphere. Each of the glass column is fitted with a dynamic internal lighting system called the “una stellina” and it is programmed to travel up and down the column, projecting a large “caustic footprint with kaleidoscope-like patterns.” This piece is very intriguing to me  because I am currently enrolled in a conceptual art studio class called Space and Time and this installation challenges the perceived limits and boundaries between time and space.

Kristine Kim- Project 03- Dynamic-Drawing


sketch

var radx = 200;
var rady = 200;
var anglet = 0;
var angless = 0;
var angles = 0;
var anglem = 0;
var angleb = 0;
var anglebb = 0;


function setup() {
    createCanvas(640, 480);
    noStroke();  
}

function draw() {
//background color changing depending on the placment of the mouse
    background(mouseX,mouseY, 200);
// creating the 4 ellipses 
    fill(mouseX, 245, 127);
    ellipse(width/4, height/2,radx,rady);
    fill(mouseX, 245, 127);
    ellipse(width/2, height/4,rady,radx);
    fill(mouseX, 245, 127);
    ellipse(width/1.33, height/2,radx,rady);
    fill(mouseX, 245, 127);
    ellipse(width/2, height/1.33,rady,radx);
//This code transforms the 4 ellipses
    if (mouseX > width/2){
        radx = 50 + (width/2 - mouseX);
    }else {
        radx = 50 + (width/2 - mouseX);
    }
/*6 squares, all different sizes rotating either clockwise or
counter clockwise based on the left top corner of the squares*/

//rotating the smallest square, color stays the same
    fill (23, 0, 173);
    push();
    translate(mouseX, mouseY);
    rotate(radians(anglet));
    rect(0,0,25,25);
    pop();
    anglet = anglet + 12

//rotating smaller square , color stays the same
    fill(255, 55, 0);
    push();
    translate(mouseX,mouseY);
    rotate(radians(angless));
    rect(0,0,60,100);
    pop();
    angless = angless - 12;

//rotating small square, color changes with the mouse
    fill (150, mouseX, mouseY);
    push();
    translate(mouseX,mouseY);
    rotate(radians(angles));
    rect(0,0,90,150);
    pop();
    angles = angles + 10;

//rotating medium square, color changes with the mouse
    fill (200, mouseY, mouseX);
    push();
    translate(mouseX, mouseY);
    rotate(radians(anglem));
    rect(0,0,140,140);
    pop();
    anglem = anglem - 10; 


//rotating bigger square, color changes with the mouse
    fill(mouseY, mouseX, 250);
    push();
    translate(mouseX,mouseY);
    rotate(radians(angleb));
    rect(0,0,170,170);
    pop();
    angleb = angleb + 8;

//roating biggeest square, color changes with the mouse
    fill(mouseX,140, mouseY);
    push();
    translate(mouseX,mouseY);
    rotate(radians(anglebb));
    rect(0,0,200,200);
    pop();
    anglebb = anglebb -8;
}

This project was a little bit more challenging for me but definitely made me more interested in this class and coding for art in general. I started by creating an ellipse and making it change the height and the width(shape/size) with the mouse movement. Then added more element and abstraction with the rotating squares and rectangles.