It is interesting to visualize a world from radiowaves. Through collecting WIFI signals, GPS information, and the radio-active data created by the built environment, the Dutch designer Richard Vijgen successfully constructs an “infosphere” in which people are able to see how the radio waves and dots are bounced back and forth under different network condition. What attracts me about this project is that under this digital tool, people are able to visualize how the radio signals are transmitted not only from a plan view but also from a person’s standing position. Moreover, such a way of navigation in any built environment has implied different network construction and social infrastructural conditions such as the satellite services and cell tower managements.
Meanwhile, the program allows diverse datasets to show on the screen, which creates the opportunities for different visual information to join and compose a dynamic drawing for artists to experience and observe the information-industrial world. What’s more, the real-time info software also provides the chance for people to see which area of the information traffic is busy or not to help guide people to explore into different worlds and places.
//Steven Fei
//Section A
//zfei@andrew.cmu.edu
//Project-07
var nPoints = 100;

function setup() {
    createCanvas(480, 480);

}


function draw() {
    background("pink");
    push();
    translate(width/2, height/2);

    hypocycloidInvolute();
    hypotrochoid();

    pop();

}
function hypotrochoid(){
    //http://mathworld.wolfram.com/Hypotrochoid.html
    var x;
    var y;
    var x2;
    var y2;
    var a = constrain(mouseX,60, 180) ;//variable for hypotrochoid with 1/6radius
    var b = a/6; //variable for hypotrochoid with 1/6 radius
    var h = constrain(mouseY/8, 0, 2*b); // control the size of the radius
    var ph = mouseX/20; // control the starting angle of the radius
    var a2 = map(mouseY,0,480,30,80); // variable for hypotrochoid with 1/2 radius
    var b2 = a/2; // variable for hypotrochoid with 1/2 radius
    var a3 = a-20;//variable for the grey hypotrochoid
    var b3 = a3/4;//variable for the grey hypotrochoid
    var h3 = constrain(mouseY/8,0,2.5*b3);//variable for the grey hypotrochoid
    var lineV1x = []; // arrays to collect the hypotroid coordinates with 1/2 radius
    var lineV1y = []; // arrays to collect the hypotroid coordinates with 1/2 radius
    var lv2x = [];//arrays to collect the white hypotrochoid coordinates
    var lv2y = [];//array to collect the white hypotrochoid coordinates
    var lv3x = [];//arrays to collect the grey hypotrochoid coordinates
    var lv3y = [];//arrays to collect the grey hypotrochoid
    noFill();
    //draw the grey hypochocoid with 1/4 radius
    beginShape();
    stroke("grey");
    strokeWeight(1);
    for (var z = 0; z<nPoints; z++){
        var tz = map(z, 0, nPoints, 0, TWO_PI);
        x2 = (a3-b3) * cos(tz) - h3*cos(ph + tz*(a3+b3)/b3);
        y2 = (a3-b3) * sin(tz) - h3*sin(ph + tz*(a3+b3)/b3);
        vertex(x2,y2);
        lv3x.push(x2);
        lv3y.push(y2);
    }
    endShape(CLOSE);

    //begin drawing the hypotrochoid with 1/6 radius
    beginShape();
    stroke("white");
    strokeWeight(2);
    for (var i = 0; i<nPoints; i++){
        var t = map(i, 0, nPoints, 0, TWO_PI);
        x = (a-b) * cos(t) - h*cos(ph + t*(a+b)/b);
        y = (a-b) * sin(t) - h*sin(ph + t*(a+b)/b);
        vertex(x,y);
        lv2x.push(x);
        lv2y.push(y);
    }
    endShape(CLOSE);
    //draw the blue vains
    for (var d = 0; d<lv2x.length; d++){
        stroke("cyan");
        strokeWeight(1);
        line(lv2x[d],lv2y[d],lv3x[d],lv3y[d]);
    }

    //begin drawing the hypotrochoid with 1/2 radius
    beginShape();
    stroke(0);
    strokeWeight(1);
    for (var j = 0; j<nPoints; j++){
        var t2 = map(j, 0, nPoints, 0, TWO_PI);
        x = (a2-b2) * cos(t2) - h*cos(ph + t2*(a2+b2)/b2);
        y = (a2+b2) * sin(t2) - h*sin(ph + t2*(a2+b2)/b2);
        vertex(x,y);
        lineV1x.push(x);
        lineV1y.push(y);
    }
    endShape(CLOSE);
    // creating the mark pen effect by adding lines with 4 spacings of the inddex
    for (var j2 = 0; j2 < lineV1x.length-1; j2++){
        strokeWeight(1);
        stroke(0);
        line(lineV1x[j2], lineV1y[j2],lineV1x[j2+4],lineV1y[j2+4]);
        stroke("lightgreen");
        line(0,0,lineV1x[j2],lineV1y[j2]);//drawing the green veins
    }
}
function hypocycloidInvolute(){
    //http://mathworld.wolfram.com/HypocycloidInvolute.html
    var x1;//vertex for the red hypocycloid
    var y1;//vertex for the red hypocycloid
    var x2;//vertex for the orange hypocycloid
    var y2;//vertex for the orange hypocycloid
    var lx1 = [];//array for collecting the coordinates of the red hypocycloid
    var lx2 = [];//array for collecting the coordinates of the red hypocycloid
    var ly1 = [];//array for collecting the coordinates of the orange hypocycloid
    var ly2 = [];//array for collecting the coordinates of the orange hypocycloid
    var a = map(mouseY,0,480,90,180);//size of the red hypocycloid
    var b = a/7; //sides for the red hyposycloid
    var h = b; //determine the sharp corners
    var ph = mouseX/20;
    noFill();
    // red hypocycloid
    beginShape();
    stroke("red");
    strokeWeight(4);
    for (var i = 0; i<nPoints; i++){
        var t = map(i, 0, nPoints, 0, TWO_PI);
        x1 = a/(a-2*b) * ( (a-b)*cos(t) - h*cos( ph + (a-b)/b*t) );
        y1 = a/(a-2*b) * ( (a-b)*sin(t) + h*sin( ph + (a-b)/b*t) );
        vertex(x1,y1);
        lx1.push(x1);
        ly1.push(y1);
    }
    endShape(CLOSE);
    // begin drawing orange involute of the hypocycloid
    beginShape();
    stroke("orange");
    strokeWeight(3);
    for (var j = 0; j<nPoints; j++){
        var th = map(j, 0, nPoints, 0, TWO_PI);
        x2 = 1.5*((a-2*b)/a * ( (a-b)*cos(th) + h*cos( ph + (a-b)/b*th) ));
        y2 = 1.5*((a-2*b)/a * ( (a-b)*sin(th) - h*sin( ph + (a-b)/b*th) ));
        vertex(x2,y2);
        lx2.push(x2);
        ly2.push(y2);
    }
    endShape(CLOSE);
    // drawing the connection of the two hypocycloids
    for (var k = 0; k < lx1.length; k++){
        stroke("yellow");
        strokeWeight(1);
        line(lx1[k],ly1[k],lx2[k],ly2[k]);
    }

}
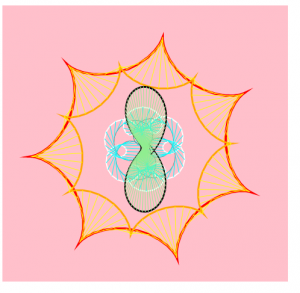
For this project, I was fascinated with the curves generated by those functions to breakdown the x and y coordinates. Then I started to play it around with mouse positions to create a growing, blooming effect. Generally, I used 2 types of curves — hypocycloid and hypotrocloid — to construct the imaginary veins and flowers. The central “mark-pen” drawing of the hypotrocloid was discovered accidentally when I tried to add varying thickness to the lines and now it gave a more realistic and 3D effect when combined with the light green lines. The blooming process integrates a series of overlappings among different elements. The white, cyan, and grey lines are related to give an impression of how the flowers can “squeeze” and “expand” during the process. The outer red,orange, and yellow lines give the basic pedestals for the drawing.
State0, blooming beginstate1, bloomingoriginal sketch of using curves to generate a spatial drawing
Randomness has brought artists with a more natural composition of artworks. However, randomness in artistic expressions is still under intentional control to maintain a better big picture.
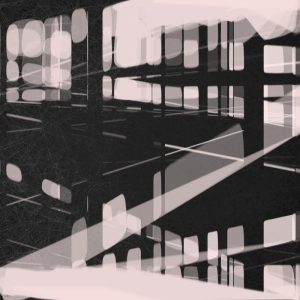
The artist, Tyler Hobbs, who takes advantage of random numbers, combines his intention of relating randomness to graphical proximity, transparency, brightness of the specific elements to create amazing compositions. The Continuity No. 8 impresses me the most with its “random” intention to create the architectural space. By generating semi-random quadrilateral shapes, the artist carefully controls the sizes of the elements and allows the intersections of the shapes to become negative spaces. By randomly choosing focal points, the artist succeeds in creating a collage painting with multiple perspectives and transparencies. The overlapping areas are randomly distributed in adjustment with the transparency and brightness to give a visual depth and hierarchy. Meanwhile, contents from different layers are thus connected to give a pseudo-realistic effect.
Such an interesting painting of randomness me inspires me that by combining the random numbers and sizes with specific parameters such as transparency and brightness, we are able to depict an architecture or even a scenary. I have never thought of random images or polygons can “have” such intentions to collaborate under these manipulations. What’s more, such a process will never produce two same compositions, meaning that the infinite graphical collages and abstract paintings can be created even under one same template.
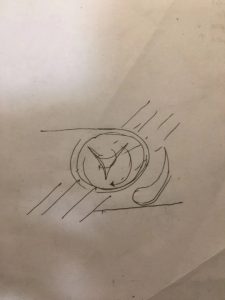
For this project, I tried to create an interstellar-style clock with arcs and circles cycle in different rates. The bluish ink-like path represents the current pace of the second. The two horizontal bars represent the current minute and the amount and length of diagonal bars represent the current hour. As I gained the inspiration from an hourglass, I realized that the cycle period didn’t have to be exactly a minute, or an hour. Then I created a web-like form in the center that revolves with a period of 20 seconds and the red arc with a period of 5 minutes.
function setup() {
    createCanvas(480, 480);

}

var xarray =[]; // array for ink graphics according to seconds
var x1; //variables for central web form
var stepX1 = 10;// steps of the spacing of the central web form
var circleMove = 0;//blue circles movement

function draw() {
    background("black");

    //diagonal bars to represent the growth of every hour and the exact hour of the current time(only look at one side)
    var h = hour();
    var hLength = map(h,0,24,50,440);
    var hColor = map(h,0,24,40,160);

    circleMove +=1;
    for (var hz = 0; hz<h; hz++){
        stroke(133,62,hColor);//changing color of the bar
        strokeWeight(8);
        line(0+15*hz,480,0.5*hLength+15*hz-20,480-0.7*hLength+5*hz);//amount of the purple bar to represent time
        stroke(133,62,hColor);//changing color of the bar
        strokeWeight(8);
        line(480-15*hz,0,480-0.5*hLength-15*hz+20,0.7*hLength-5*hz);//amount of the purple bar to represent time
        noStroke();
        fill("blue");//moving blue circles as fun animation
        circle(0.5*hLength+15*hz+circleMove-20,480-0.7*hLength+5*hz-circleMove,5);
        if (circleMove>50){
            circleMove = 0;
        }
    }


    //two horizontal bars to represent the grouth of minute overtime
    var m = minute();
    var mAdjusted = map(m,0,60,30,480); //fullfill a full length when one hour passed
    var mColor = map(m,0,60,26,150);
    noStroke();
    fill(180,58,mColor);
    rect(0,50,mAdjusted,8);
    noStroke();
    fill(180,mColor,40);
    rect(480,480-8-50,-mAdjusted,8);
    //second
    if (xarray.length>=6){
        xarray.shift();
    }
    var s = second();
    //create ink-like path to represent the path of seconds
    for (var i = s-8; i<=s; i++){
        xarray.push(i);
        var colorOfCircle = map(i,s-8,s,90,255);
        var sizeOfCircle = map(i,s-8,s,5,30);//define the size of the circle
        push();
        translate(240,240);
        rotate(-PI/2);
        stroke(0);
        fill(colorOfCircle, colorOfCircle, 255);
        noStroke();
        strokeWeight(1);
        rotate(radians(6*i));//the ink like traces will move every second and fullfill a full cycle after 60s
        var px = 180 + random(-5,5);
        var py = 0 + random(-3,3);
        frameRate(9);
        circle(px,py,sizeOfCircle);
        pop();
    }
    //changing color of the purple circle to represent the growth of a minute
    var colorOfRing0 = map(s,0,60,145,200);
    var colorOfRing1 = map(s,0,60,0,122);
    var colorOfRing2 = map(s,0,60,90,150);
    noFill();
    strokeWeight(20);
    stroke(colorOfRing0, colorOfRing1,colorOfRing2);
    circle(240,240,230);
    //slowly growing red circle
    var mil = millis();
    push();
    translate(240,240);
    frameRate(30);
    noFill();
    stroke("red");
    strokeWeight(15);
    rotate(-PI/2);
    arc(0,0,100,100,0,mil*PI/150000,OPEN); //revolving a circle every 5 min
    pop();

    // central rotating web-form
    //    Central White Lines
    push();
    translate(240,240);
    rotate(radians(mil*18/1000));//the web form fulfills a cycle every 20 seconds
    for(x1 = 0; x1 < 150; x1 += stepX1){
        strokeWeight(1);
        stroke("white");
        line(x1, 0, -(150-x1)*tan(radians(30)), 150-x1);
    }
    //     Central blue lines
    rotate(radians(120));
    for(x1 = 0; x1 < 150; x1 += stepX1){
        strokeWeight(1);
        stroke(109,129,185);
        line(x1, 0, -(150-x1)*tan(radians(30)), 150-x1);
    }
//    central light purple lines
    rotate(radians(120));
    for(x1 = 0; x1 < 150; x1 += stepX1){
        strokeWeight(1);
        stroke(152,109,185);
        line(x1, 0, -(150-x1)*tan(radians(30)), 150-x1);
    }
    pop();


}
This approach is to take advantage of the multiple nested loops to further my string art approach of creating the red “illusion” curves through repetition and more rigid layouts. The inspiration is still from the Sharingan in Naruto.
function setup() {
    createCanvas(600, 600);
    background("black");


}
var angle;//variables for the red fish curves
var radius = 8;//varaibles for the size of red curves

function draw() {


//   background lines
    for (var y = 0; y<height; y+=60){
        for (var x = 0; x<width; x+=60){
            stroke(35,41,54);
            strokeWeight(2);
            line(x, y, x+60, y+60);//rightward diagonal line
            stroke(148,148,148);
            line(x+40, y, x-40, y+60);//leftward light grey line
            stroke(77,78,80);
            line(x+30, y, x+90, y+60); //rightward dark gray line
        }
    }
    // yellow hex circles
    var radiusTwo = 12;
    for (var y = 0; y < height; y+=120){
        for(var x = 0; x < width; x+=100){
            push();
            translate(x+50, y+30+40);
            for (var i = 0; i<6; i++){
                push();
                rotate(radians(30));
                rotate(radians(i*360/6));
                noStroke();
                fill(255,255,102);
                circle(radiusTwo, 0, 5);
                pop();
            }
            pop();
        }
    }

// constructions of the red wheels
    for(var y = 0; y < height; y += 120){
        for (var x = 0; x < width; x+= 100){
            push();
            translate(x+50, y+30); // spacing
            // top part of the red fish
            rotate(-PI/2);
            for (angle = 0; angle <90; angle += 5){
                angConv = radians(angle);
                angConv2 = 1.5*angConv;
                strokeWeight(0.5);
                stroke("red");
                line(radius+radius*cos(angConv), radius*sin(angConv), 2*radius*cos(angConv2), 2*radius*sin(angConv2));
            }
            for (angle=90; angle<100; angle += 3){
                angConv = radians(angle);
                angConv2 = 1.8*angConv;
                strokeWeight(0.5);
                stroke("red");
                line(radius+radius*cos(angConv), radius*sin(angConv), 2*radius*cos(angConv2), 2*radius*sin(angConv2));

            }
            for (angle=120; angle<=180; angle += 3){
                angConv = radians(angle);
                angConv2 = 3*angConv;
                strokeWeight(0.5);
                stroke("red");
                line(radius+radius*cos(angConv), radius*sin(angConv), -radius-radius*cos(angConv2), -radius*sin(angConv2));

            }
            for (angle=135; angle<163; angle+=4){
                angConv = radians(angle);
                strokeWeight(0.5);
                stroke("red");
                line(radius, radius, 2*radius*cos(angConv), 2*radius*sin(angConv));
            }
            // left part of the red fish
            rotate(PI/2); //return to the original angle coordinates
            translate(-30, 50);
            rotate(radians(30));
            for (angle = 0; angle <90; angle += 5){
                angConv = radians(angle);
                angConv2 = 1.5*angConv;
                strokeWeight(0.5);
                stroke("red");
                line(radius+radius*cos(angConv), radius*sin(angConv), 2*radius*cos(angConv2), 2*radius*sin(angConv2));
            }
            for (angle=90; angle<100; angle += 3){
                angConv = radians(angle);
                angConv2 = 1.8*angConv;
                strokeWeight(0.5);
                stroke("red");
                line(radius+radius*cos(angConv), radius*sin(angConv), 2*radius*cos(angConv2), 2*radius*sin(angConv2));

            }
            for (angle=120; angle<=180; angle += 3){
                angConv = radians(angle);
                angConv2 = 3*angConv;
                strokeWeight(0.5);
                stroke("red");
                line(radius+radius*cos(angConv), radius*sin(angConv), -radius-radius*cos(angConv2), -radius*sin(angConv2));

            }
            for (angle=135; angle<163; angle+=4){
                angConv = radians(angle);
                strokeWeight(0.5);
                stroke("red");
                line(radius, radius, 2*radius*cos(angConv), 2*radius*sin(angConv));
            }
            //right part of the red fish
            rotate(radians(-30)); //return to the original angle coordinates
            translate(60, 0);
            rotate(radians(-30));
            for (angle = 0; angle <90; angle += 5){
                angConv = radians(angle);
                angConv2 = 1.5*angConv;
                strokeWeight(0.5);
                stroke("red");
                line(radius+radius*cos(angConv), radius*sin(angConv), 2*radius*cos(angConv2), 2*radius*sin(angConv2));
            }
            for (angle=90; angle<100; angle += 3){
                angConv = radians(angle);
                angConv2 = 1.8*angConv;
                strokeWeight(0.5);
                stroke("red");
                line(radius+radius*cos(angConv), radius*sin(angConv), 2*radius*cos(angConv2), 2*radius*sin(angConv2));

            }
            for (angle=120; angle<=180; angle += 3){
                angConv = radians(angle);
                angConv2 = 3*angConv;
                strokeWeight(0.5);
                stroke("red");
                line(radius+radius*cos(angConv), radius*sin(angConv), -radius-radius*cos(angConv2), -radius*sin(angConv2));

            }
            for (angle=135; angle<163; angle+=4){
                angConv = radians(angle);
                strokeWeight(0.5);
                stroke("red");
                line(radius, radius, 2*radius*cos(angConv), 2*radius*sin(angConv));
            }
            pop();
        }
    }


}
With the advent of digital graphics, art has stepped into a new era with faster pace and more opportunities.
The 3D artist, Hirokazu Yokohara, has integrated 3D modeling techniques with computational renderings to produce photo-realistic scenes and images. Instead of directly drawing and painting 2D information onto canvas, the artist utilized the 3D modeling software called Blender to compose the objects. Such a process provides the artist with more details and considerations for every element of the forms. In his famous work the Golden Skull, the artist takes advantage of the software to first create the complex geometry and control each part of the skull and bones parametrically to get immediate results. Later, textures are selected and mapped freely onto the parts to give a general impression of how the 2D image of the specific scene should look like. Finally, by utilizing another real-time renderer EEVEE, the artist is able to see quick result of the photo-realistic image provided by the computer which calculates the lighting and compositions of the graph with tremendous speed.
Such a process strongly attracts me not only for its new, organic way of modeling forms which could hardly be achieved through pure handwork but also for the quick, human-interactive process of producing images through putting realistic factors and textures. Such a process indeed has shaped a more dynamic and innovative design strategy, and it also paves the way for quicker image presenting through computing and parametric controlling.
This drawing was my attempt to understand how small changes of the two coordinates can create fluent curves. With the combinations of different lineweights, I was experimenting with the visual depth of different elements. Meanwhile, the three “Taichi” like symbols were inspired by the Sharingan from Naruto which represents creating a world of illusions.
function setup() {
    createCanvas(400, 300);
    background("black");

}
var x1; //variables for central white, blue, and purple curves
var x2; //variables for peripheral curves
var stepX1 = 10;//steps of change for central curves
var stepX2 = 20;//steps of change for peripheral curves
var y1=0;//variables for peripheral curves
var angle;//variables for the red curves
var radius = 30;//varaibles for the size of red curves
function draw() {

    //    top green lines
    for (var i = 0; i < 30; i++){
        x2 = -50 + i * stepX2;
        x3 = 30 + width;
        y1 = 15 * i;
        stroke(3,122,43);
        strokeWeight(0.1);
        line(x2, 0, x3, y1);
    }
//    bottom blue curves
    push();
    translate(0,height);
    for (var i1 = 0; i1 <= 90; i1 += 5){
        x2 = i1*5;
        y1 = 0;
        x3 = 450-x2;
        y2 = sin(radians(i1))*-80;
        stroke("blue");
        strokeWeight(0.1);
        line(x2,y1,x3,y2);
    }
    pop();
//    Dark purple lines on the bottom;
    push();
    translate(0,height);
    for (var i2 = 0; i2 <= 90; i2 += 5){
        x2 = i2*5;
        x3 = 450-x2;
        y2 = sin(radians(i2))*-80;
        i3 = map(i2, 0, 90, 0, PI*1/4);
        x4 = -50 + 500*cos(i3);
        y4 = 300-500*cos(i3);
        stroke(71,3,112);
        strokeWeight(0.1);
        line(x3,y2,x4,y4);
    }
    pop();

//    Central to left bottom White Lines
    push();
    translate(width/2,height/2);
    rotate(radians(60));
    for(x1 = 0; x1 < 150; x1 += stepX1){
        strokeWeight(0.5);
        stroke("white");
        line(x1, 0, -(150-x1)*tan(radians(30)), 150-x1);

    }

//    Central to left top light blue lines
    rotate(radians(120));
    for(x1 = 0; x1 < 150; x1 += stepX1){
        strokeWeight(0.5);
        stroke(109,129,185);
        line(x1, 0, -(150-x1)*tan(radians(30)), 150-x1);
    }
//    central to right light purple lines
    rotate(radians(120));
    for(x1 = 0; x1 < 150; x1 += stepX1){
        strokeWeight(0.5);
        stroke(152,109,185);
        line(x1, 0, -(150-x1)*tan(radians(30)), 150-x1);
    }
    pop();
//   left top Taichi Fish
    push();
    translate(100,70);
    rotate(radians(80));
    for (angle = 0; angle <90; angle += 5){
        angConv = radians(angle);
        angConv2 = 1.5*angConv;
        strokeWeight(0.5);
        stroke("red");
        line(radius+radius*cos(angConv), radius*sin(angConv), 2*radius*cos(angConv2), 2*radius*sin(angConv2));
    }
    for (angle=90; angle<100; angle += 3){
        angConv = radians(angle);
        angConv2 = 1.8*angConv;
        strokeWeight(0.5);
        stroke("red");
        line(radius+radius*cos(angConv), radius*sin(angConv), 2*radius*cos(angConv2), 2*radius*sin(angConv2));

    }
    for (angle=120; angle<=180; angle += 3){
        angConv = radians(angle);
        angConv2 = 3*angConv;
        strokeWeight(0.5);
        stroke("red");
        line(radius+radius*cos(angConv), radius*sin(angConv), -radius-radius*cos(angConv2), -radius*sin(angConv2));

    }
    for (angle=135; angle<163; angle+=4){
        angConv = radians(angle);
        strokeWeight(0.5);
        stroke("red");
        line(radius, radius, 2*radius*cos(angConv), 2*radius*sin(angConv));
    }
    pop();

    //   right side top Taichi Fish
    push();
    translate(320,150);
    rotate(radians(190));
    for (angle = 0; angle <90; angle += 5){
        angConv = radians(angle);
        angConv2 = 1.5*angConv;
        strokeWeight(0.5);
        stroke("red");
        line(radius+radius*cos(angConv), radius*sin(angConv), 2*radius*cos(angConv2), 2*radius*sin(angConv2));
    }
    for (angle=90; angle<100; angle += 3){
        angConv = radians(angle);
        angConv2 = 1.8*angConv;
        strokeWeight(0.5);
        stroke("red");
        line(radius+radius*cos(angConv), radius*sin(angConv), 2*radius*cos(angConv2), 2*radius*sin(angConv2));

    }
    for (angle=120; angle<=180; angle += 3){
        angConv = radians(angle);
        angConv2 = 3*angConv;
        strokeWeight(0.5);
        stroke("red");
        line(radius+radius*cos(angConv), radius*sin(angConv), -radius-radius*cos(angConv2), -radius*sin(angConv2));

    }
    for (angle=135; angle<163; angle+=4){
        angConv = radians(angle);
        strokeWeight(0.5);
        stroke("red");
        line(radius, radius, 2*radius*cos(angConv), 2*radius*sin(angConv));
    }
    pop();

    //   left bottom Taichi Fish
    push();
    translate(110,230);
    rotate(radians(320));
    for (angle = 0; angle <90; angle += 5){
        angConv = radians(angle);
        angConv2 = 1.5*angConv;
        strokeWeight(0.5);
        stroke("red");
        line(radius+radius*cos(angConv), radius*sin(angConv), 2*radius*cos(angConv2), 2*radius*sin(angConv2));
    }
    for (angle=90; angle<100; angle += 3){
        angConv = radians(angle);
        angConv2 = 1.8*angConv;
        strokeWeight(0.5);
        stroke("red");
        line(radius+radius*cos(angConv), radius*sin(angConv), 2*radius*cos(angConv2), 2*radius*sin(angConv2));

    }
    for (angle=120; angle<=180; angle += 3){
        angConv = radians(angle);
        angConv2 = 3*angConv;
        strokeWeight(0.5);
        stroke("red");
        line(radius+radius*cos(angConv), radius*sin(angConv), -radius-radius*cos(angConv2), -radius*sin(angConv2));

    }
    for (angle=135; angle<163; angle+=4){
        angConv = radians(angle);
        strokeWeight(0.5);
        stroke("red");
        line(radius, radius, 2*radius*cos(angConv), 2*radius*sin(angConv));
    }
    pop();

}
The advent of robots, sound art has been mediated by machines and artificial intelligence. Robots can be programed to “think” to produce music that can fool humans to consider the sons were made by their same species. From the article “When Robots Write Songs”, some robots were specially designed to emulate some famous Jazz musians and DJs and they indeed surprised me by copying and developing those personal preferences and styles in music compositions. Starting from building the Fibonacci relationships among the notes to generate people’s general appreciation towards beauty, the amazing robots can even develop the algorithms to deconstruct and understand personal music styles in such a rational way.
One of the most interesting projects about how artificial sound art can change human’s perception of the world is the Prelude in ACGT. Eploring the relationship between biology and music, the tool designed by Pierry Jequillard uses the developer’s own DNA and converts it into music. By controlling several parameters like Tempo, the developer is able to visualize and understand the algorithmic process of how artificial intelligence converts his chromosomes into musical arrangements. Such a technological advances amazes me in its conversion of our natural form into encoded eternal artworks. Moreover, the experiment successfully demonstrates the versatility of artificial intelligence in producing interdisciplinary of arts.
function setup() {
    createCanvas(600, 480);

}

var size = 8; //hexagon size that can change according to the mouse movement
let color = 0; //hexagon color that can change according to the mouse movement
var colorDir = 2; //the degree of change for the color change
let angle = 0; //the initial rotation angle for the hexagon
var dir = 1; // the growing direction of the hexagon, either positive or negative
var speed = 2; //the growing speed of the hexagon

function mouseMoved(){
    color = color +colorDir;
    if (color<0){
        colorDir = 2;
    } else if (color>255){
        colorDir = -2;
    }
    angle +=0.6;
    size += dir * speed;
    if(size<0){
        dir = 1;
        size = 0;
    }else if (size>60){
        dir = -1;
        size = 60;
    }
}

var diffx = 0;
var diffy = 0;
var circlex = 300;
var circley = 300;

function draw() {
    background(0);
//    locate the mouse position
    diffx = mouseX - circlex;
    diffy = mouseY - circley;
    circlex = circlex + 0.1*diffx;
    circley = circley + 0.1*diffy;
    fill("white");
    circle(circlex,circley,20);

    fill(color,37,213);
    var x = max(min(mouseX,300),5); // decide the starting point of the hexagon, when the mouse is far on the left the canvas, the hexagons may shrink together and when the mouse is far on the right of the canvas, the hexagons may move away from each other
    translate(300,240); //move to the center of the canvas
//    draw the basic shape for 1st Hexagon
    beginShape();
    rotate(radians(angle));
    vertex(x/2,0);
    vertex(x/2+size*cos(radians(60)),0-size*sin(radians(60)));
    vertex(x/2+size+size*cos(radians(60)),0-size*sin(radians(60)));
    vertex(x/2+size+2*size*cos(radians(60)),0);
    vertex(x/2+size+size*cos(radians(60)),size*sin(radians(60)));
    vertex(x/2+size*cos(radians(60)),size*sin(radians(60)));
    endShape();
    // draw the basic shape for 2nd Hexagon
    rotate(radians(60));
    beginShape();
    vertex(x/2+1.3,0);
    vertex(x/2+1.3+1.3*size*cos(radians(60)),0-1.3*size*sin(radians(60)));
    vertex(x/2+1.3+1.3*size+1.3*size*cos(radians(60)),0-1.3*size*sin(radians(60)));
    vertex(x/2+1.3+1.3*size+2*1.3*size*cos(radians(60)),0);
    vertex(x/2+1.3+1.3*size+1.3*size*cos(radians(60)),1.3*size*sin(radians(60)));
    vertex(x/2+1.3+1.3*size*cos(radians(60)),1.3*size*sin(radians(60)));
    endShape();
//    draw the basic shape for 3rd Hexagon
    rotate(radians(60));
    beginShape();
    vertex(x/2+1.5,0);
    vertex(x/2+1.5+1.5*size*cos(radians(60)),0-1.5*size*sin(radians(60)));
    vertex(x/2+1.5+1.5*size+1.5*size*cos(radians(60)),0-1.5*size*sin(radians(60)));
    vertex(x/2+1.5+1.5*size+2*1.5*size*cos(radians(60)),0);
    vertex(x/2+1.5+1.5*size+1.5*size*cos(radians(60)),1.5*size*sin(radians(60)));
    vertex(x/2+1.5+1.5*size*cos(radians(60)),1.5*size*sin(radians(60)));
    endShape();
//  draw the basic shape for 4th Hexagon
    rotate(radians(60));
    beginShape();
    vertex(x/2+1.7,0);
    vertex(x/2+1.7+1.7*size*cos(radians(60)),0-1.7*size*sin(radians(60)));
    vertex(x/2+1.7+1.7*size+1.7*size*cos(radians(60)),0-1.7*size*sin(radians(60)));
    vertex(x/2+1.7+1.7*size+2*1.7*size*cos(radians(60)),0);
    vertex(x/2+1.7+1.7*size+1.7*size*cos(radians(60)),1.7*size*sin(radians(60)));
    vertex(x/2+1.7+1.7*size*cos(radians(60)),1.7*size*sin(radians(60)));
    endShape();
//    draw the basic shape for 5th Hexagon
    rotate(radians(60));
    beginShape();
    vertex(x/2+1.9,0);
    vertex(x/2+1.9+1.9*size*cos(radians(60)),0-1.9*size*sin(radians(60)));
    vertex(x/2+1.9+1.9*size+1.9*size*cos(radians(60)),0-1.9*size*sin(radians(60)));
    vertex(x/2+1.9+1.9*size+2*1.9*size*cos(radians(60)),0);
    vertex(x/2+1.9+1.9*size+1.9*size*cos(radians(60)),1.9*size*sin(radians(60)));
    vertex(x/2+1.9+1.9*size*cos(radians(60)),1.9*size*sin(radians(60)));
    endShape();
//    draw the basic shape for 6th Hexagon
    rotate(radians(60));
    beginShape();
    vertex(x/2+2.1,0);
    vertex(x/2+2.1+2.1*size*cos(radians(60)),0-2.1*size*sin(radians(60)));
    vertex(x/2+2.1+2.1*size+1.9*size*cos(radians(60)),0-2.1*size*sin(radians(60)));
    vertex(x/2+2.1+2.1*size+2*2.1*size*cos(radians(60)),0);
    vertex(x/2+2.1+2.1*size+1.9*size*cos(radians(60)),2.1*size*sin(radians(60)));
    vertex(x/2+2.1+2.1*size*cos(radians(60)),2.1*size*sin(radians(60)));
    endShape();


}
Parametric design approach has always attracted me because of its elegant rationale and the infinite possibilities that we are able to create through controling different variables.
In the article from Prof Levin, what I think is the most meaningful work is the “Blooming” Fibonacci Sculptures by John Edmark. Gaining inspirations from the phyllotaxis algorithm, the designer creates several 3D printing sculptures that give the illusion of contiunously blooming and extending while spinning. Through accurate parametric controlling, the artworks achieve strong fluidity in the transition between solid and void. Among those sculptures, the foliage-like piece and the opus with three mobius-strip-like pieces stacked on top of each other impressed me the most. As an architecture student, I once programed a similar “mobius” structure too through the use of Grasshopper and GhPython. Upon using the two plugins, I was able to control the number and size of the basic u-grids that made up of the circular section and the number and spacing of the v-grids that connects horizontally around the rims. Meanwhile, I was also able to decide where to start and end the shape. However, when I created such form, I only thought about of static shape while neglecting the dynamics when taking those parameters to flow overtime. I strongly admire the artist for his talent in thinking in a dynamic way to generate this amazing visual effect while rotating the object.
Moreover, in creating such moving and complex geometries, the artist managed to control those parameters so that the individual pieces can grow or morph while not interfering with each other overtime. Meanwhile, the individual artworks are stacked or combined in interesting ways to create new looks and more complex connections. Ultimately, through the use of parametric designs, the artist demonstrates the dynamic pattern that has seldom been created before and successfully creates a never-stopping illusion to the viewers.
![[OLD FALL 2019] 15-104 • Introduction to Computing for Creative Practice](https://courses.ideate.cmu.edu/15-104/f2019/wp-content/uploads/2020/08/stop-banner.png)