![[OLD SEMESTER] 15-104 • Introduction to Computing for Creative Practice](https://courses.ideate.cmu.edu/15-104/f2021/wp-content/uploads/2023/09/stop-banner.png)
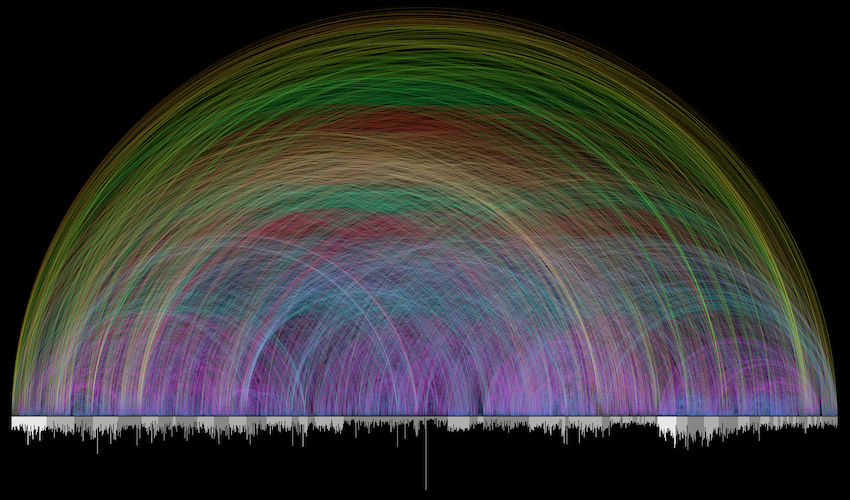
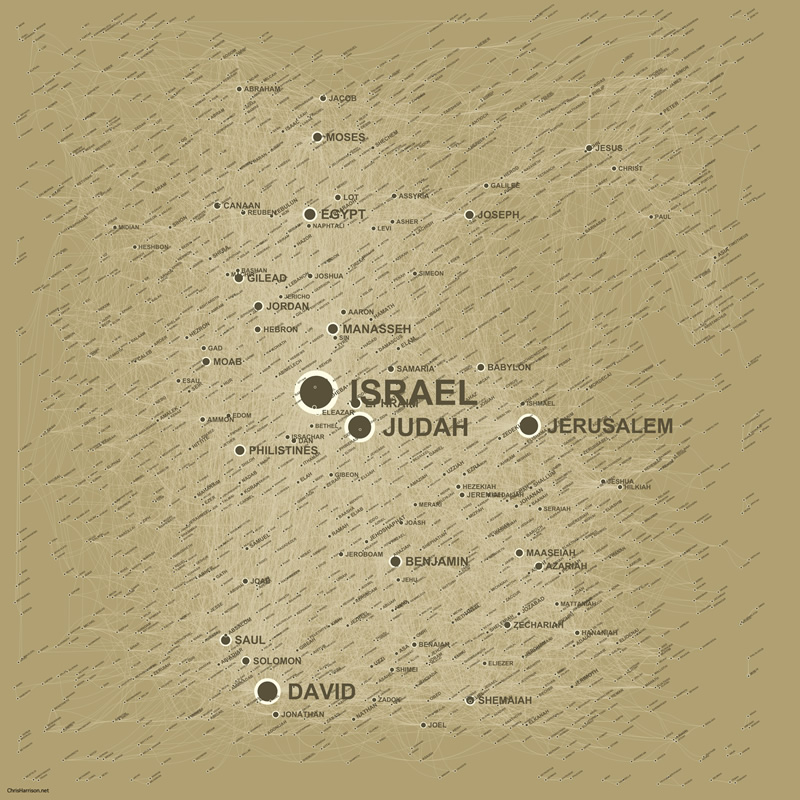
This week I took a look at some artists who specialize in computational data visualization. In particular, I took a look at Chris Harrison’s piece, Visualizing the Bible. This piece drew me in particular because the bible has always been something I have been so fascinated with. The combination of technology and a piece of world history felt refreshing and innovative. Harrison was able to visualize 63,000 cross-references within the bible to create a stunning piece that “honored and revealed the complexity of the data at every level”. A couple of other pieces were also made following the conclusion of the bible arc piece. Harrison wanted to capture the story of the bible and more specifically the people and the places within the bible. He used a spatial clustering algorithm to show the different connections between the 2619 biblical names. These pieces create new and refreshing ways to view classic pieces of human history. They give us a different perspective on how things can be interpreted.
Chris Harrison’s Bible Visualization