![[OLD SEMESTER] 15-104 • Introduction to Computing for Creative Practice](../../wp-content/uploads/2023/09/stop-banner.png)
sketchDownload
// Jiyeon Chun
// Section C
// jiyeonch@andrew.cmu.edu
// Project-07-Project
var nPoints = 100;
function setup() {
createCanvas(400, 400);
background(242, 140, 86);
frameRate(20);
}
function draw() {
push();
//make origin the center of canvas
translate(width/2, height/2);
drawEpicycloidCurve();
pop();
}
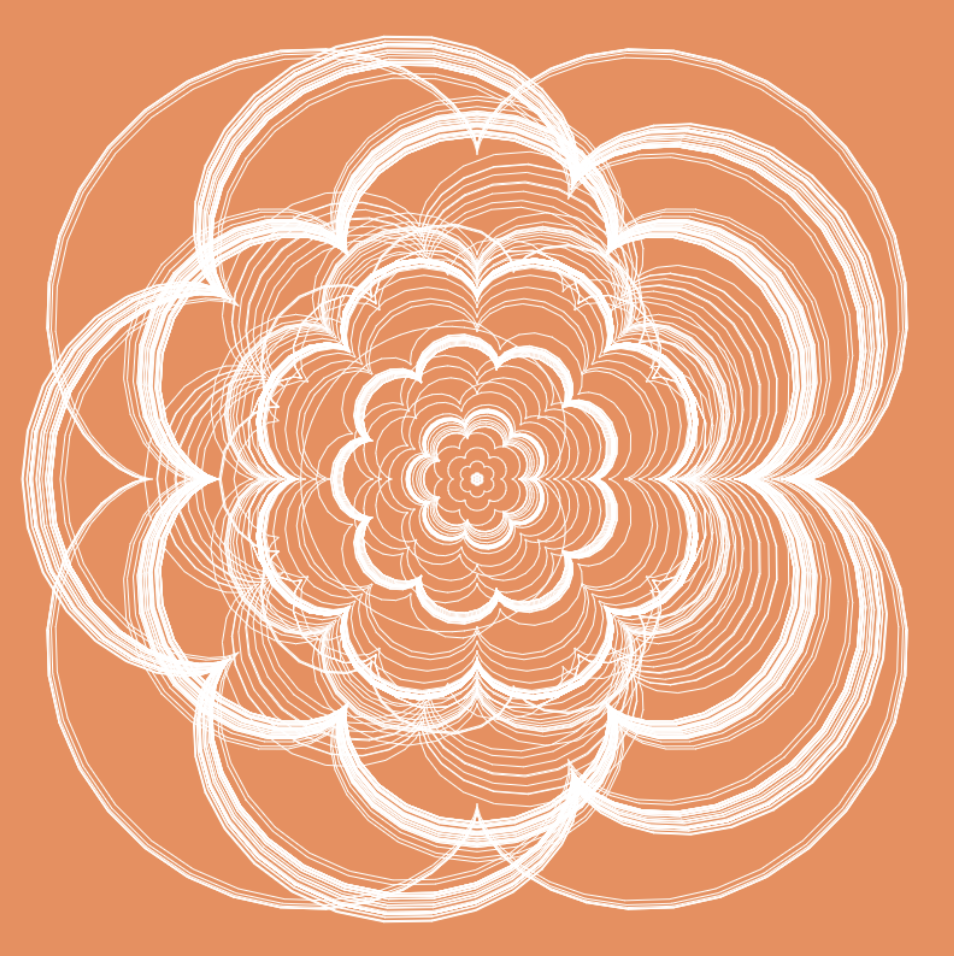
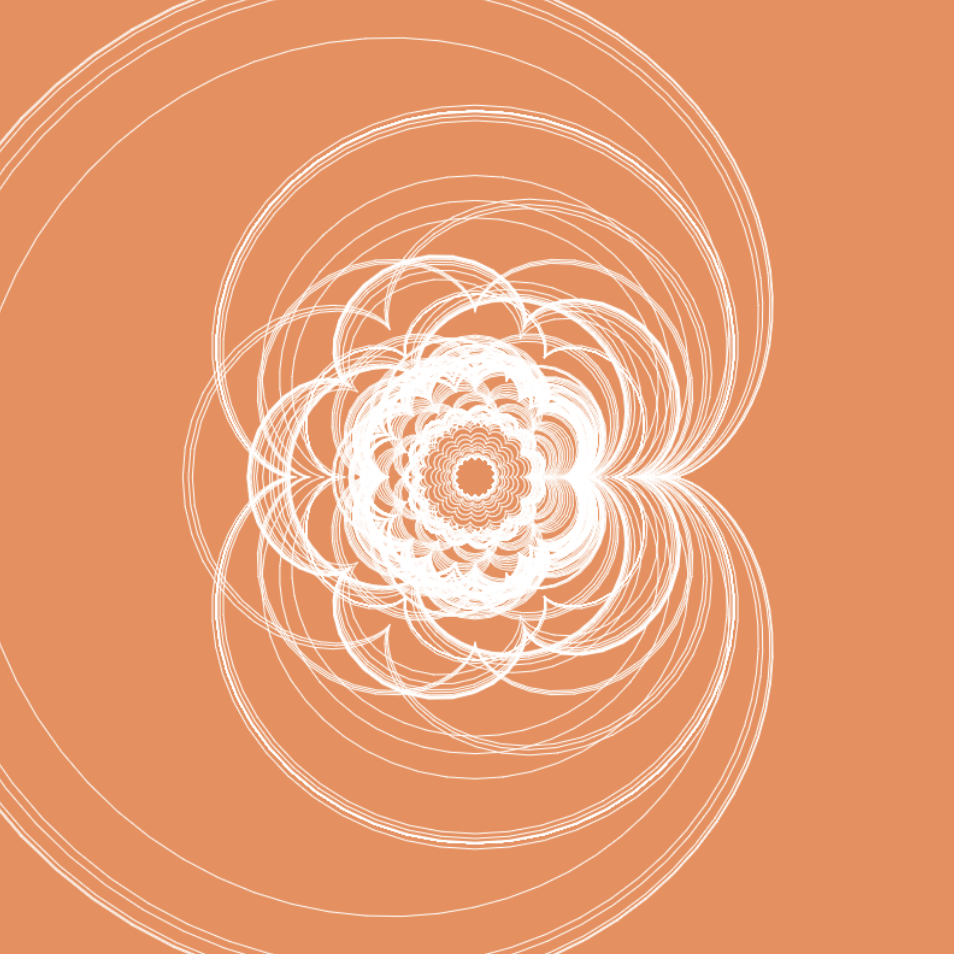
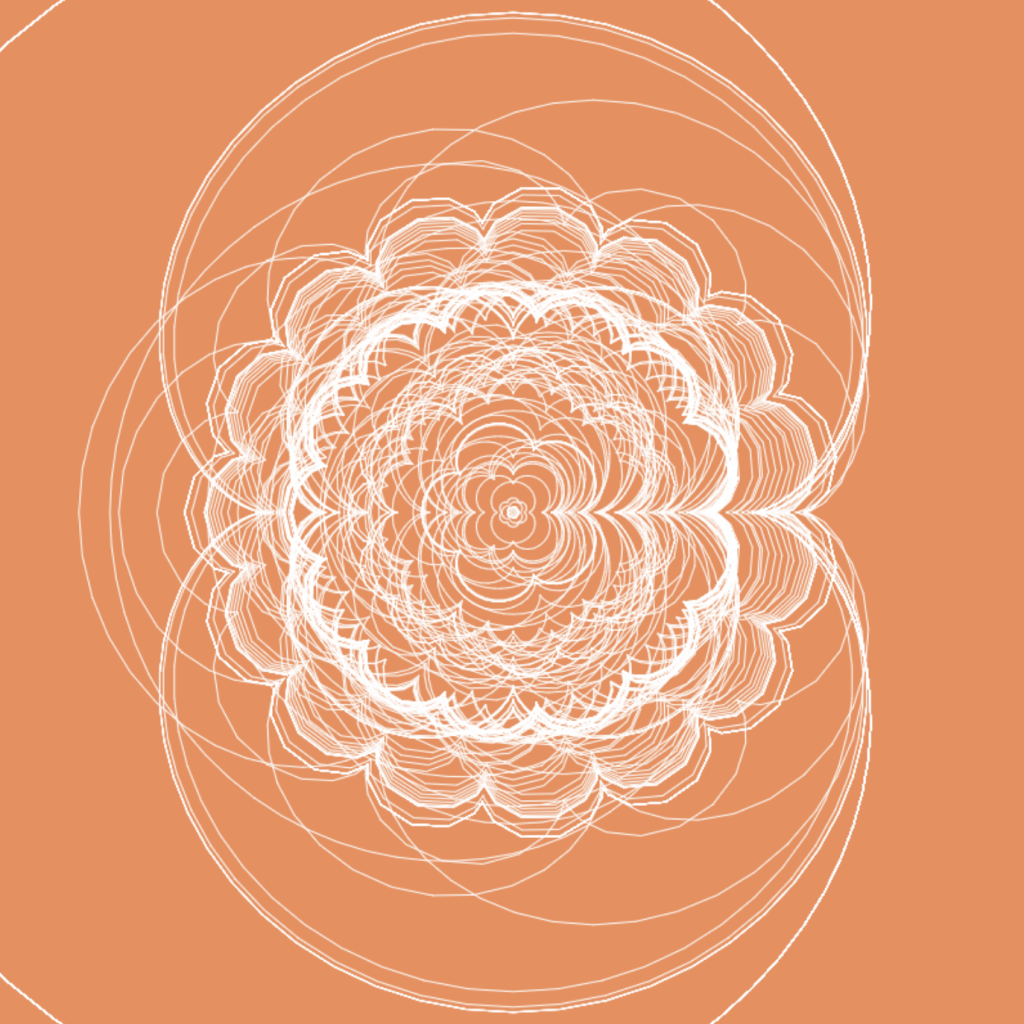
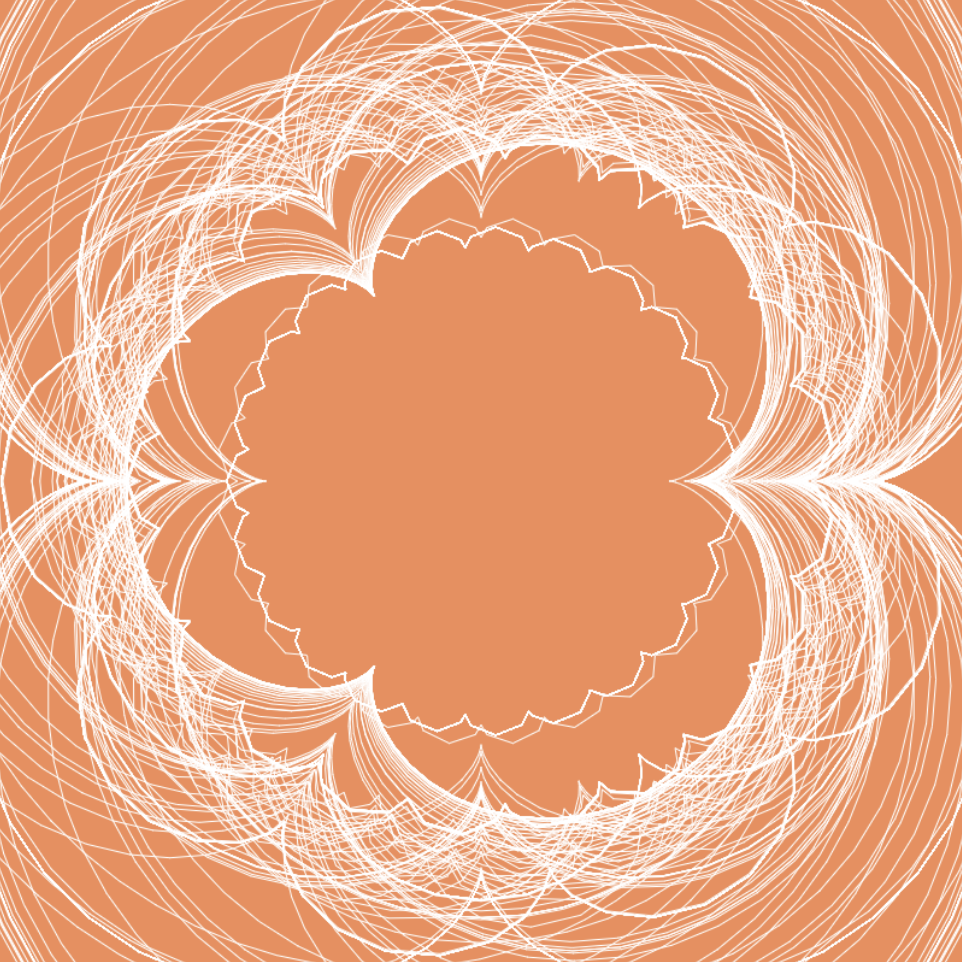
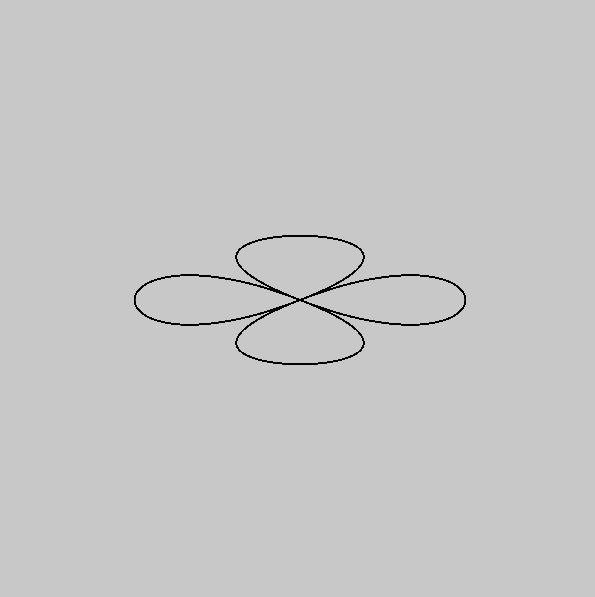
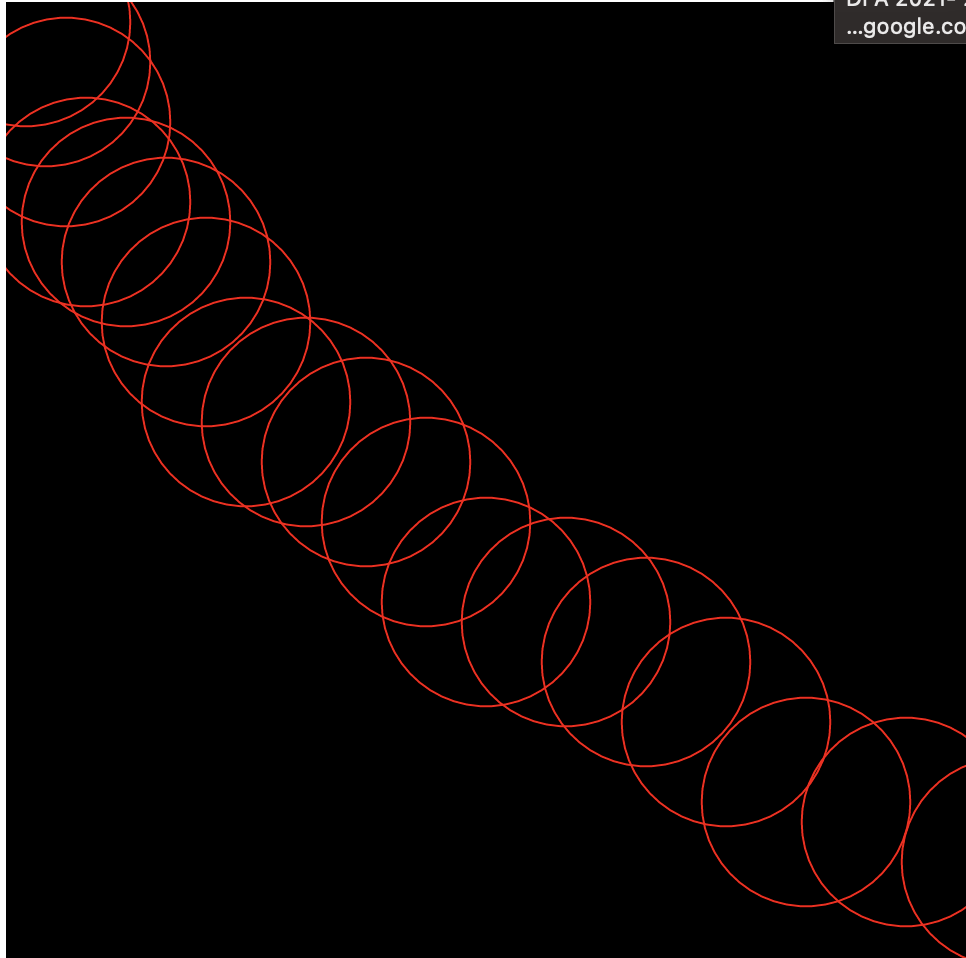
function drawEpicycloidCurve() {
//Epicycloid:
//https://mathworld.wolfram.com/Epicycloid.html
var x;
var y;
var a = mouseX / 5;
var b = a / int(mouseY / 25);
stroke(255);
strokeWeight(.5);
noFill();
beginShape();
for (var i=0; i<nPoints; i++) {
var t = map(i, 0, nPoints, 0, TWO_PI);
x = (a+b)*cos(t)-b*cos(((a+b)/b)*t);
y = (a+b)*sin(t)-b*sin(((a+b)/b)*t);
vertex(x,y);
}
endShape(CLOSE);
}
function mousePressed() { //press mouse to clear canvas and restart
background(242, 140, 86);
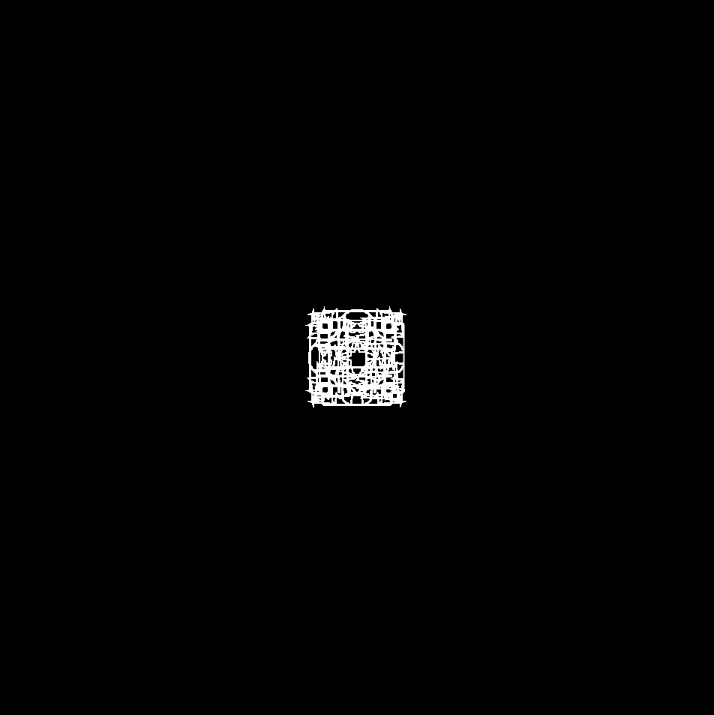
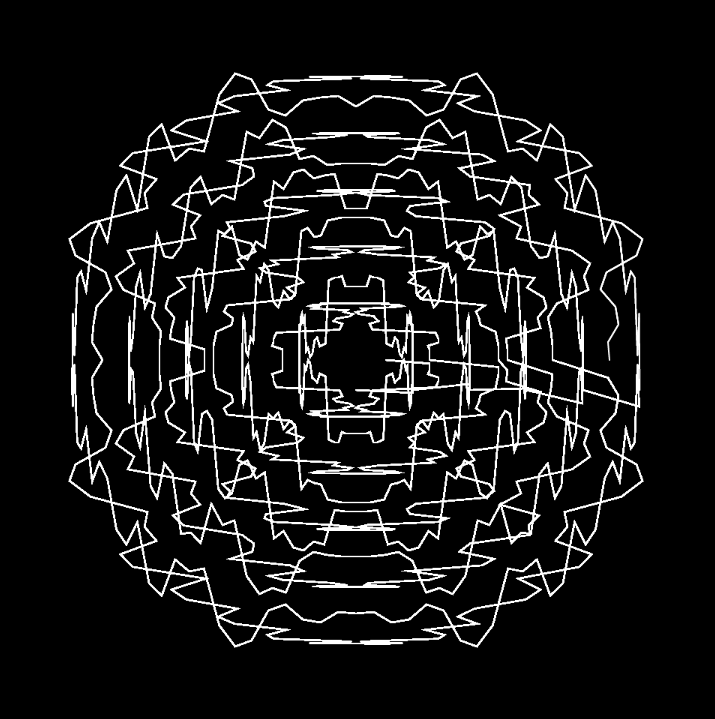
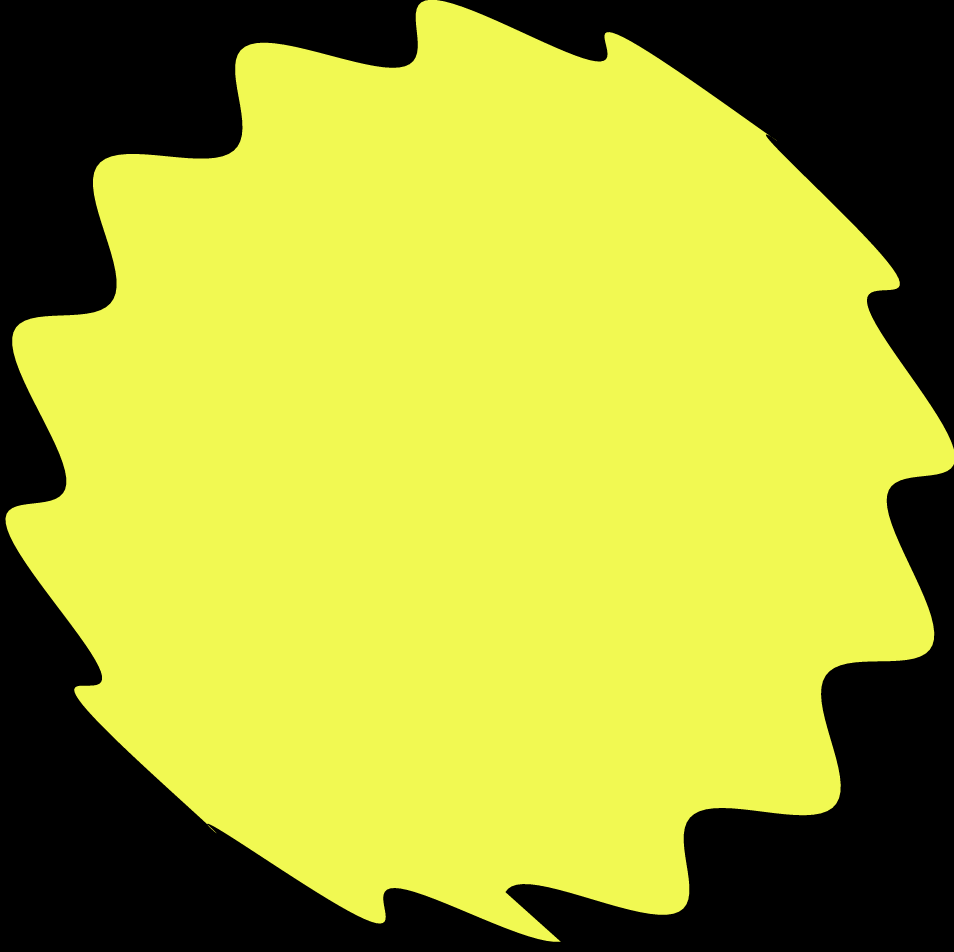
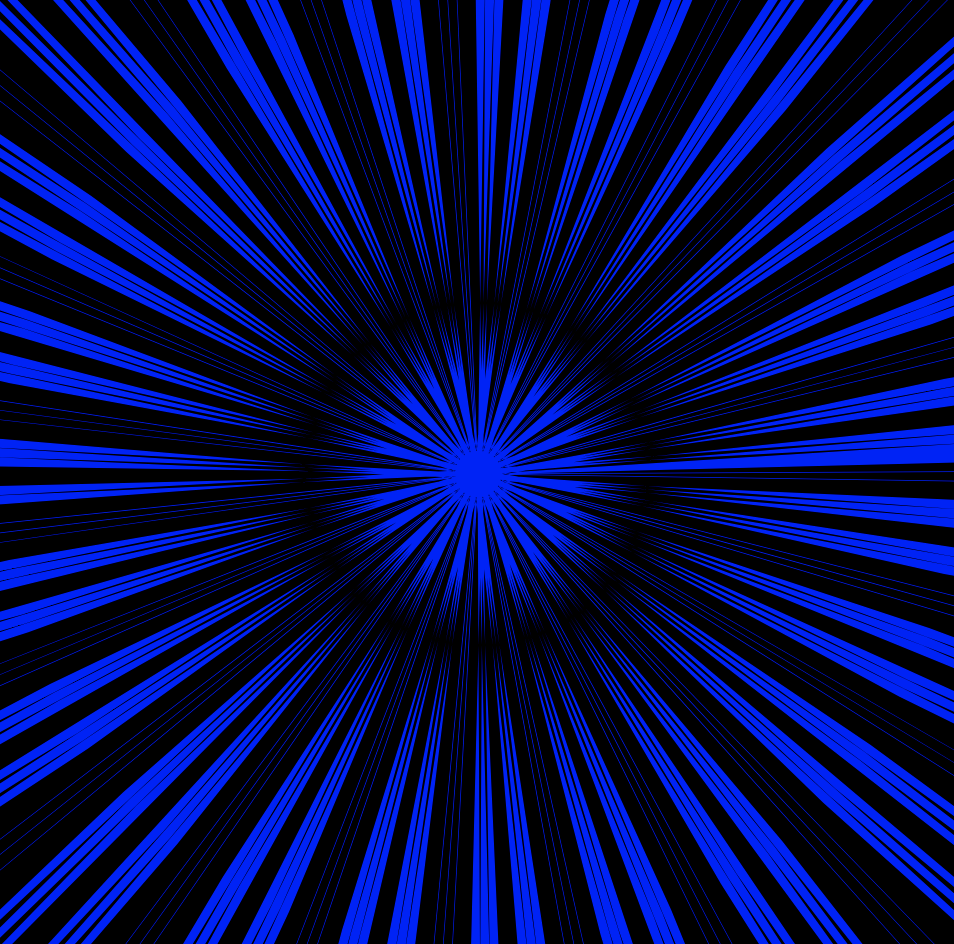
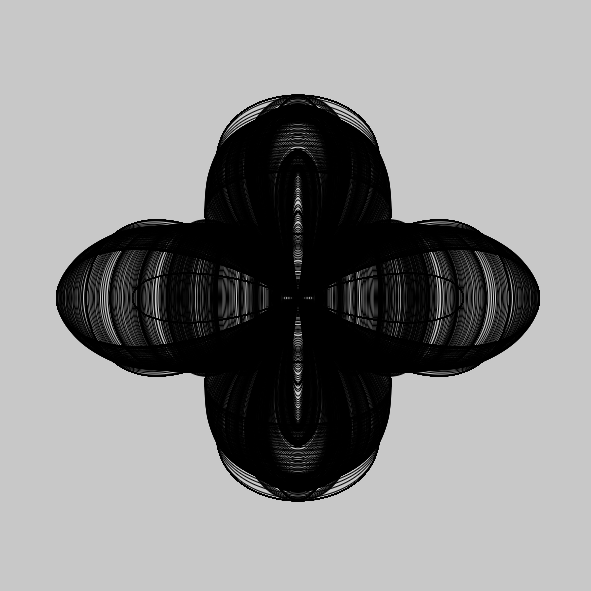
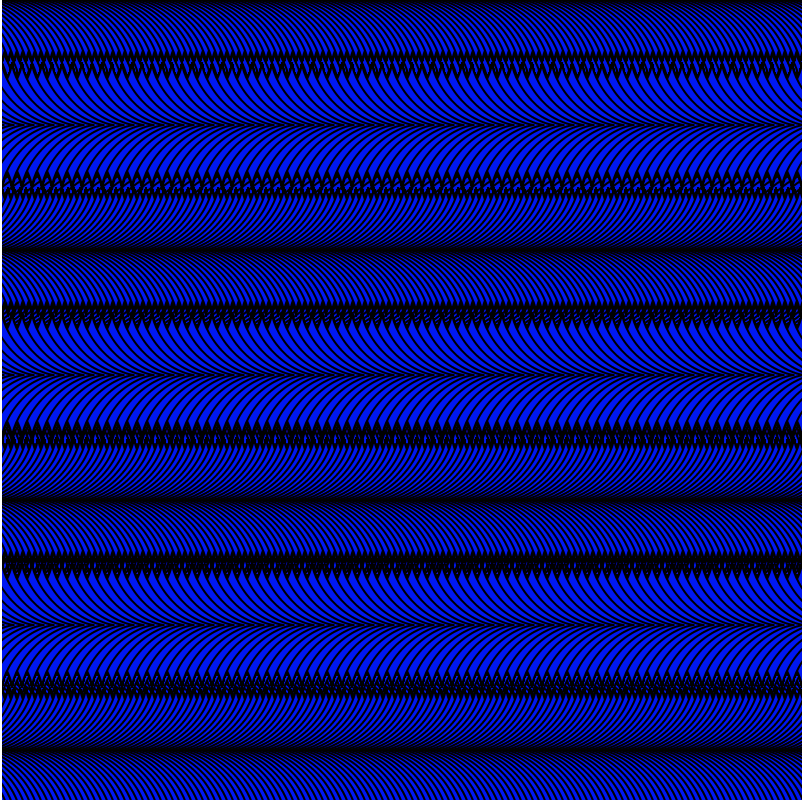
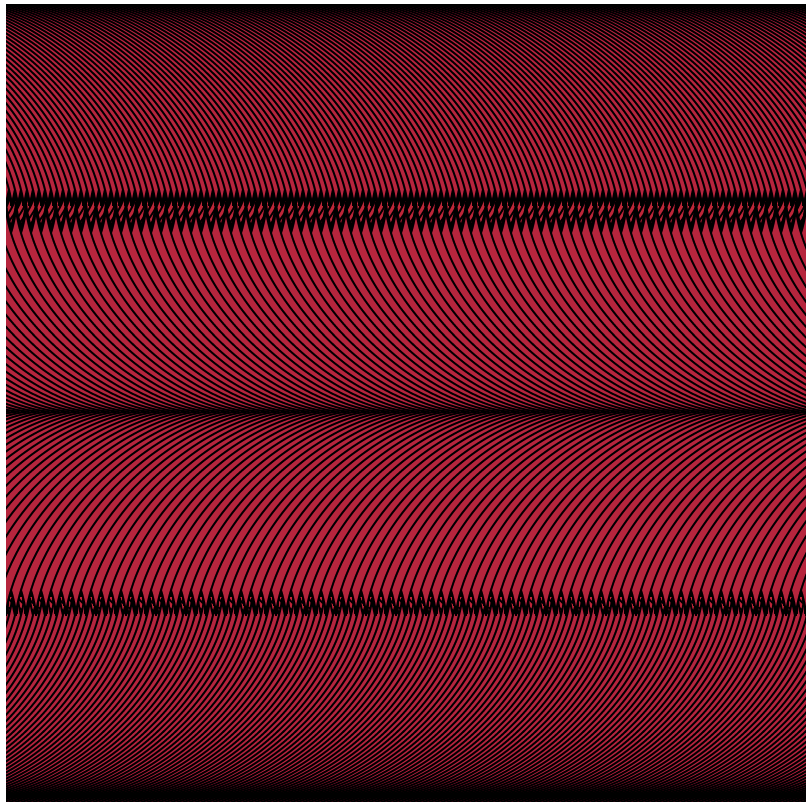
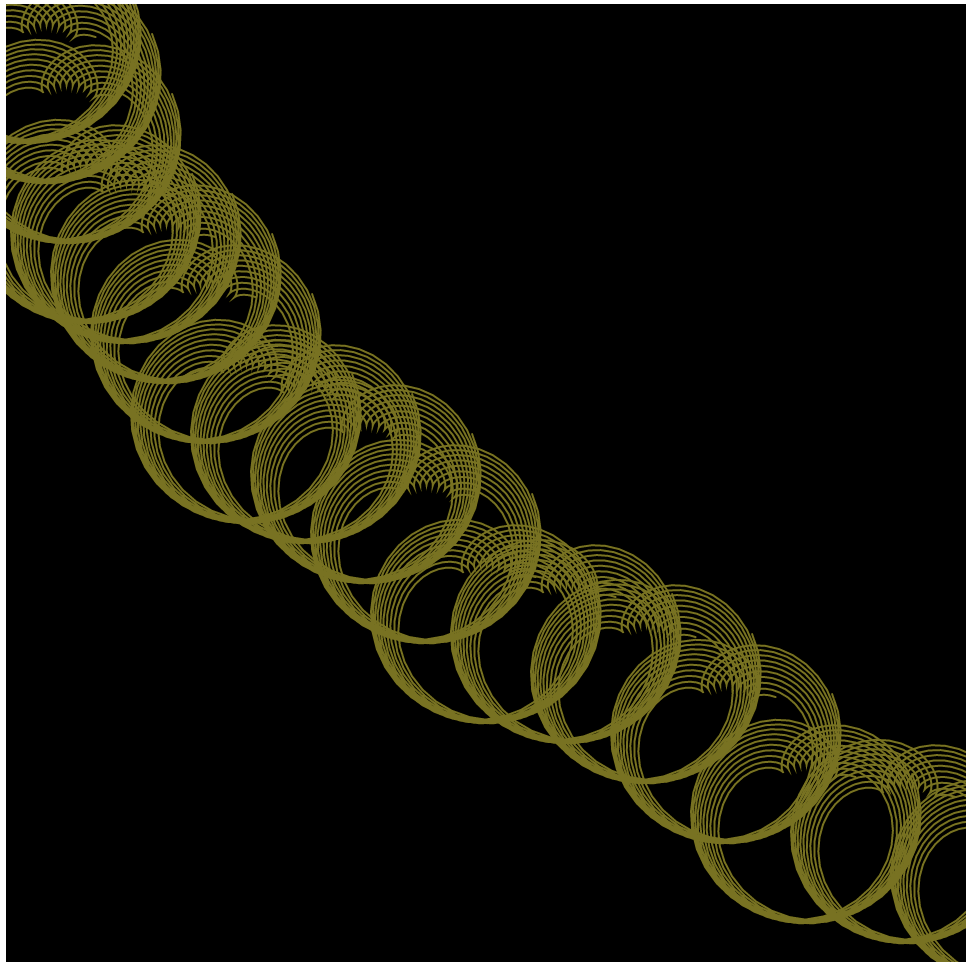
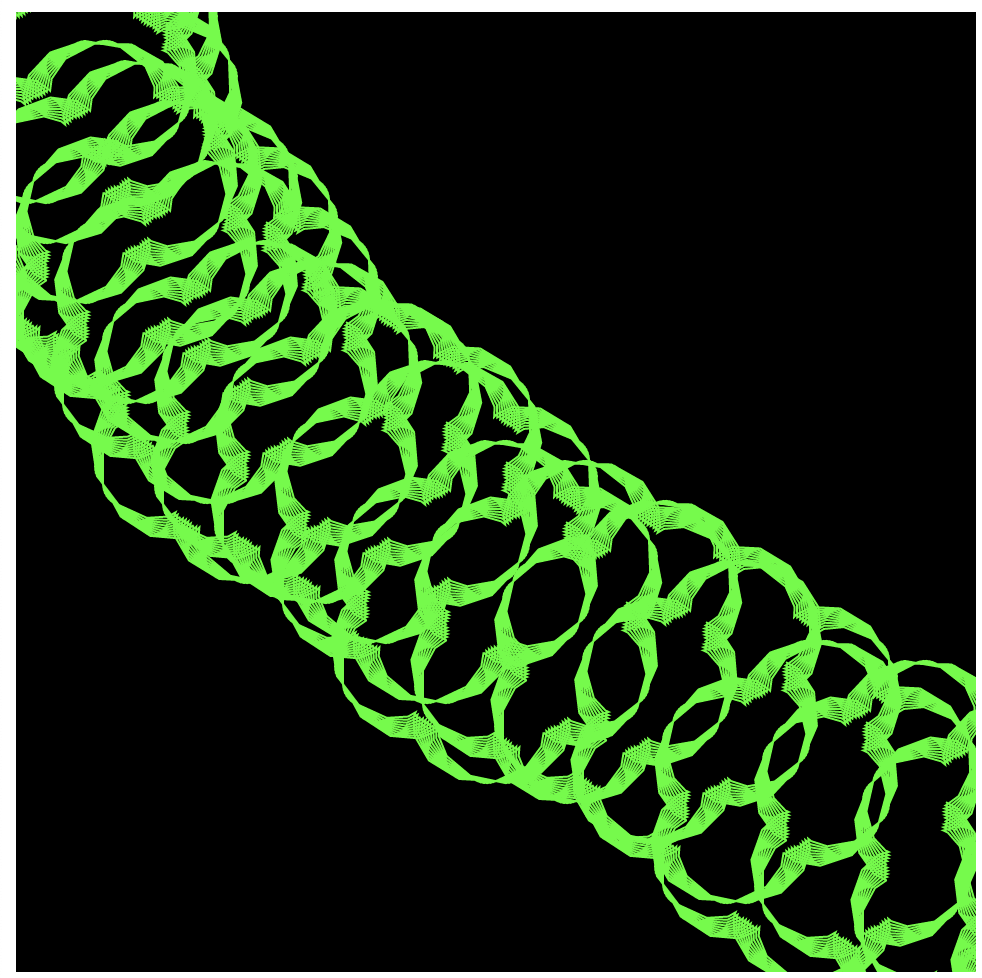
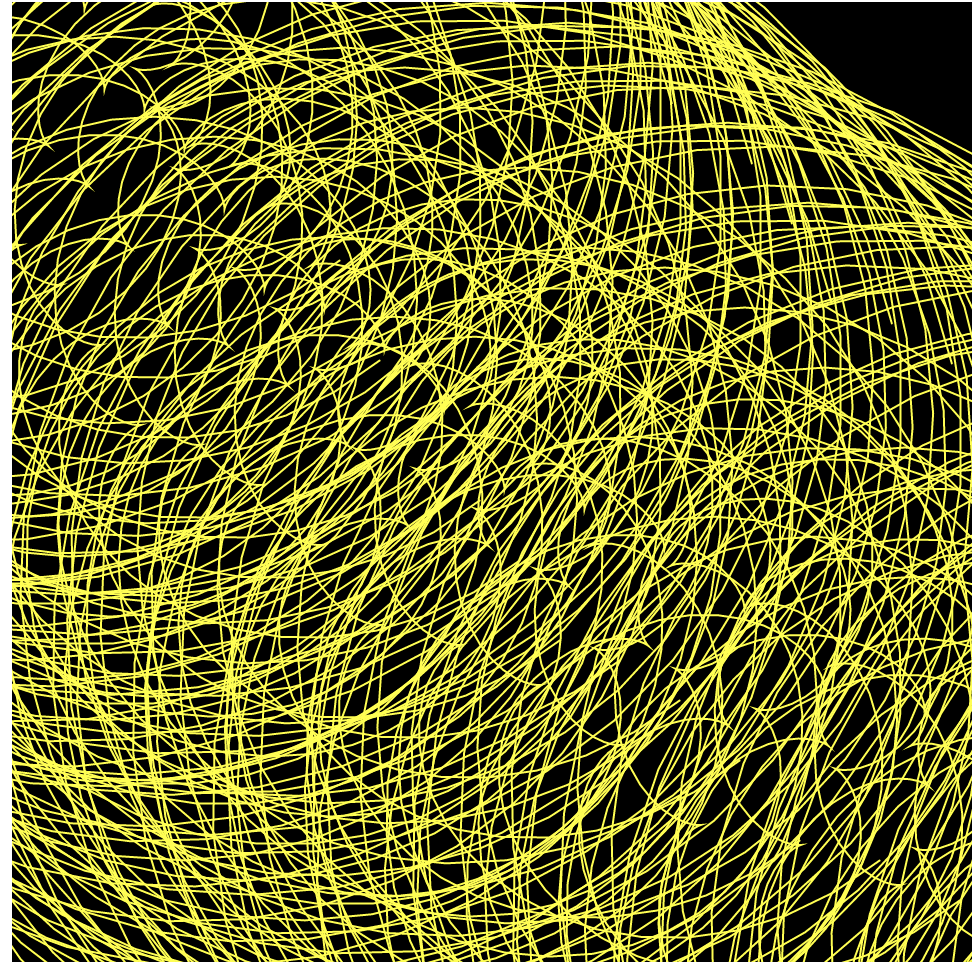
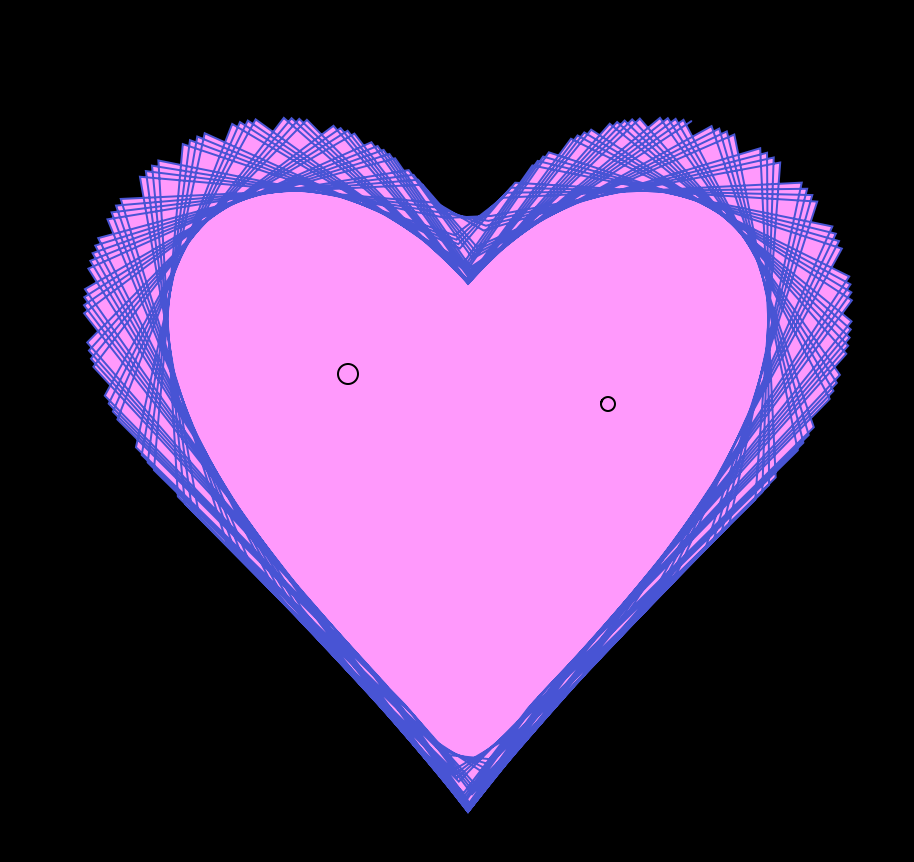
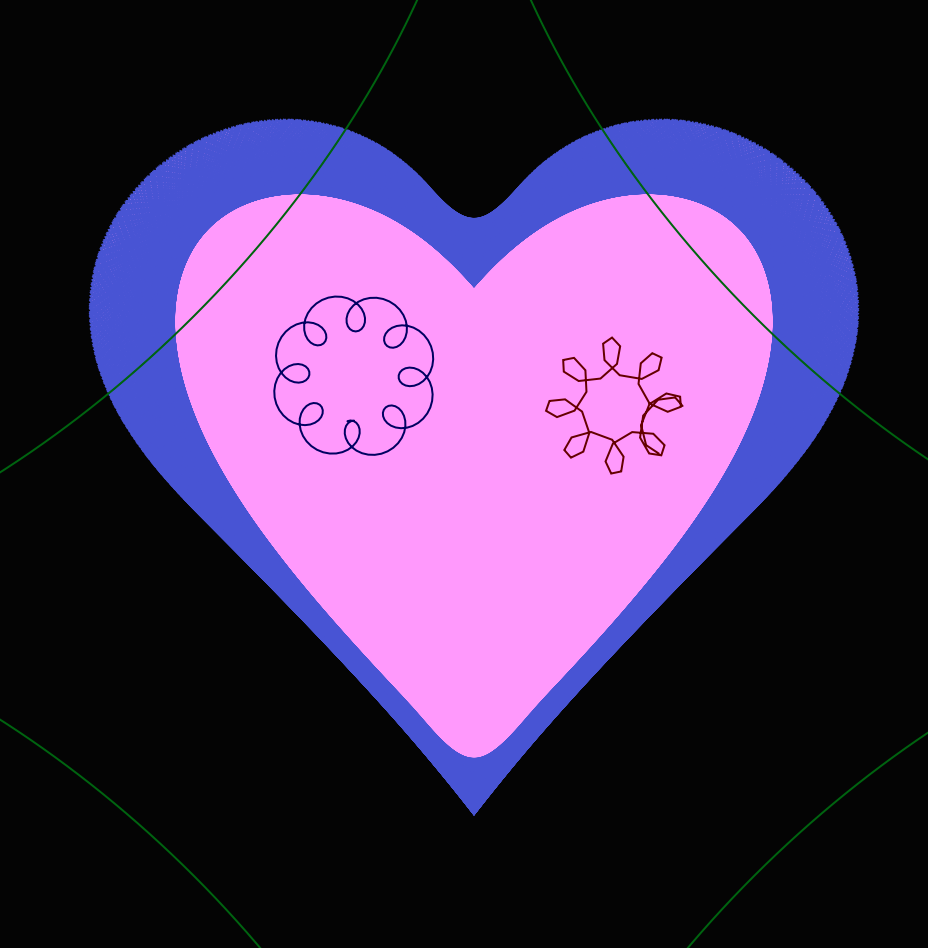
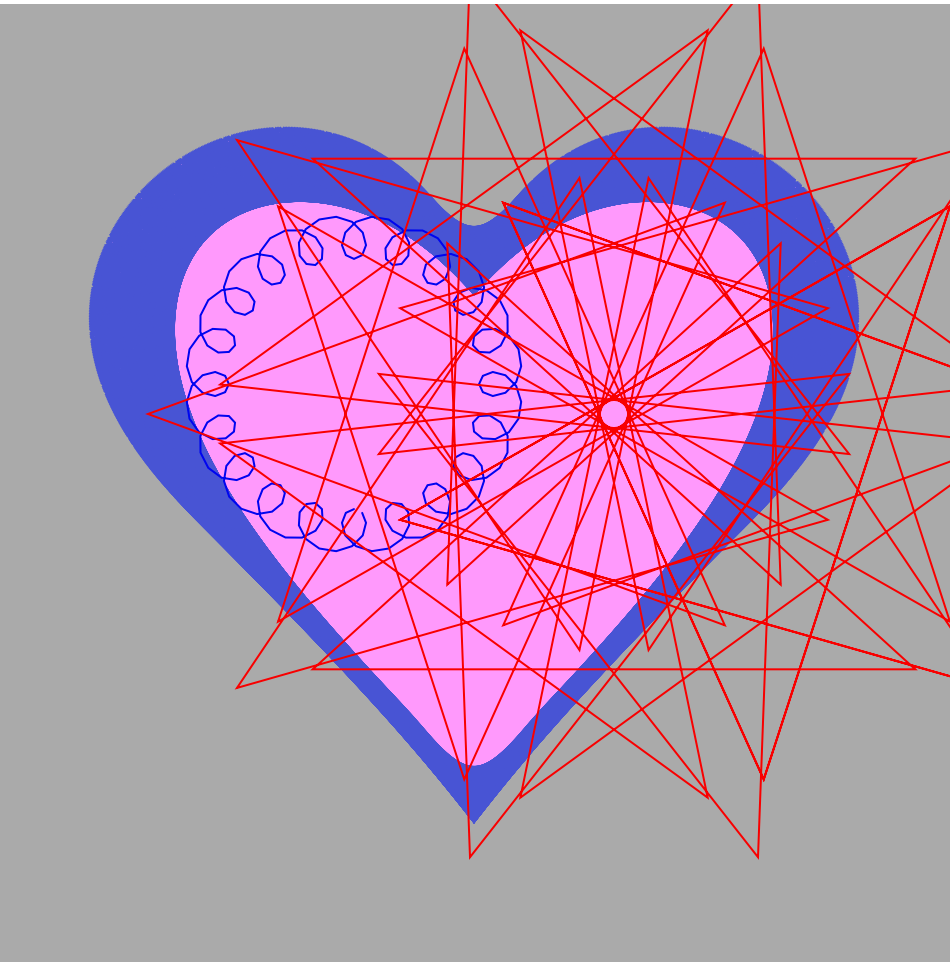
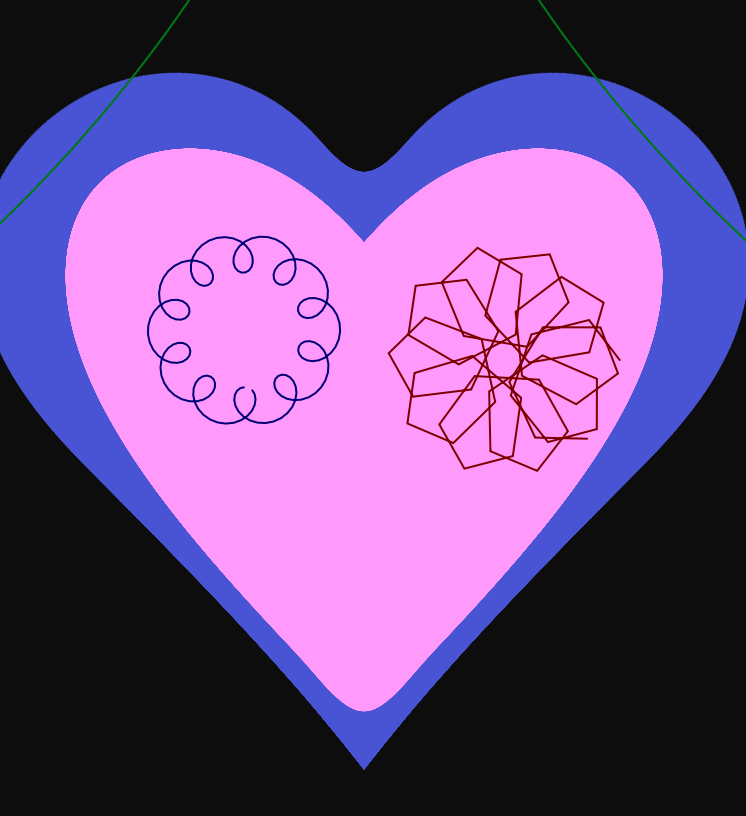
}My project is a program that allows the user to build up a composition using their interaction with the epicycloid curve with their mouse movements. I started off with other curves at first, however, some of the others didn’t offer as many change-able variables, as I wanted the program to be very dynamic upon the movement of the mouse. After putting the curve into my program, I took away the background from the draw function so that the canvas could keep a “history” of the mouse movement every frame, creating a composition over time in which the canvas has responded to the user’s mouse movements and the user to the canvas’ current composition! Here are just a few of the infinite amount of possible compositions: