//Yanina Shavialenka
//Section B

var n;
var heartShape = [];
var theta = 0;
var nPoints = 55;

function setup() {
    createCanvas(480, 480);
}

function draw() {
    background(map(mouseX, 0, width, 0, mouseY));
    heartCurve();
    epitrochoidCurve();
    hypotrochoidCurve();
    astroidCurve();
}

function heartCurve() {
    //https://mathworld.wolfram.com/HeartCurve.html
    push();
    fill(255, 153, 255);
    stroke(73, 84, 216);
    translate(width/2, height/2-35);//changes (0,0) point to center the heart in the middle
    beginShape(); //Begins to draw heart curve
    for (var v of heartShape) {
        vertex(v.x, v.y);
    }
    endShape(); //Ends drawing heart curve
    //The following equations were taken from teh MathWorld
    var radius = height / 40; //sets how big the heart is on the canvas
    var xPos = 16 * pow(sin(theta), 3) * radius;
    var yPos = (13 * cos(theta) - 5 * cos(2 * theta) - 2 * cos(3 * theta) - cos(4 * theta)) * -radius;
    heartShape.push(createVector(xPos, yPos));
    theta += 0.8; //changes the angle by 0.8 each time which increases the outer blue stroke
    pop();
}

function epitrochoidCurve() {
    //https://mathworld.wolfram.com/Epitrochoid.html
    var b = 3.5;
    var h = (b + 5) + mouseX/100;
    var a = mouseX/b;
    push();
    noFill();
    stroke(0, 0, mouseX);
    translate(180, height/2-50);
    /*
    Changes (0,0) point to center the epitrochoid on the
    left side of a heart.
    */
    beginShape(); //Begins to draw epitrochoid curve
    //The following equations were taken from teh MathWorld
    for(var t = 0; t <= TWO_PI; t += PI/110){
        var xPos = (a+b) * sin(t) - h * sin(((a+b)/b) * t);
        var yPos = (a+b) * cos(t) - h * cos(((a+b)/b) * t);
        vertex(xPos,yPos);
    }
    endShape(); //Ends drawing epitrochoid curve
    pop();
}

function hypotrochoidCurve() {
    //https://mathworld.wolfram.com/Hypotrochoid.html
    var b = 3.5;
    var h = mouseY/2; //As height increases, the get little sharp crown circles
    //As height decreases, we get oval star curves instead of crown circles
    var a = mouseX/b;
    push();
    noFill();
    stroke(mouseX, 0, 0);
    translate(width/2+70, height/2-35);
    /*
    Changes (0,0) point to center the hypotrochoid on the
    right side of a heart.
    */
    beginShape(); //Begins to draw hypotrochoid curve
    //The following equations were taken from teh MathWorld
    for (var i = 0; i <= nPoints; i ++) {
        var t = map(i, 0, 50, 0, TWO_PI);
        var xPos = (a-b) * cos(t) + (h * cos(((a-b)/b) * t));
        var yPos = (a-b) * sin(t) - (h * sin(((a-b)/b) * t));
        vertex(xPos,yPos);
    }
    endShape(); //Ends drawing hypotrochoid curve
    pop();
}

function astroidCurve() {
    //https://mathworld.wolfram.com/Astroid.html
    var a = map(mouseX, 0, width, 0, height);
    push();
    noFill();
    stroke(0, mouseX, 0);
    translate(width/2, 300);
    /*
    Changes (0,0) point to center the astroid at the
    bottom of a heart.
    */
    beginShape(); //Begins to draw astroid curve
    //The following equations were taken from teh MathWorld
    for (var i = 0; i < height; i++) {
        var t = map(i, 0, width, 0, TWO_PI);
        var xPos = 3 * a * cos(t) + a * cos(3 * t);
        var yPos = 3 * a * sin(t) - a * sin(3 * t);
        vertex(xPos,yPos);
    }
    endShape(); //Ends drawing astroid curve
    pop();
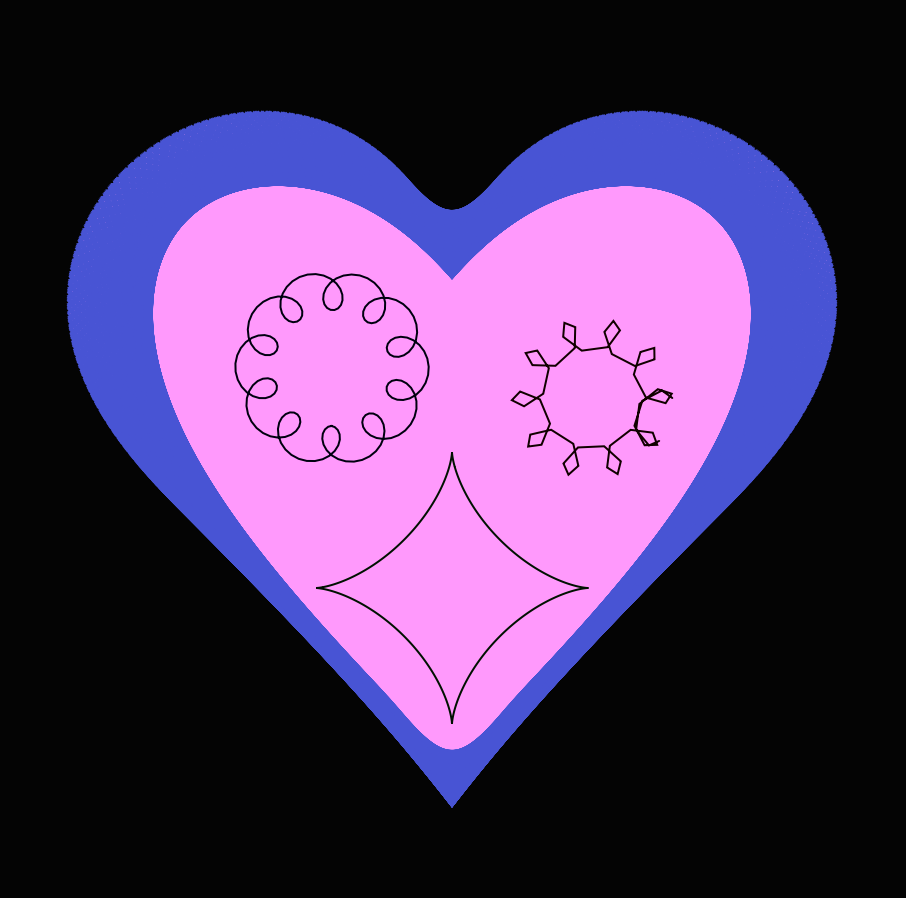
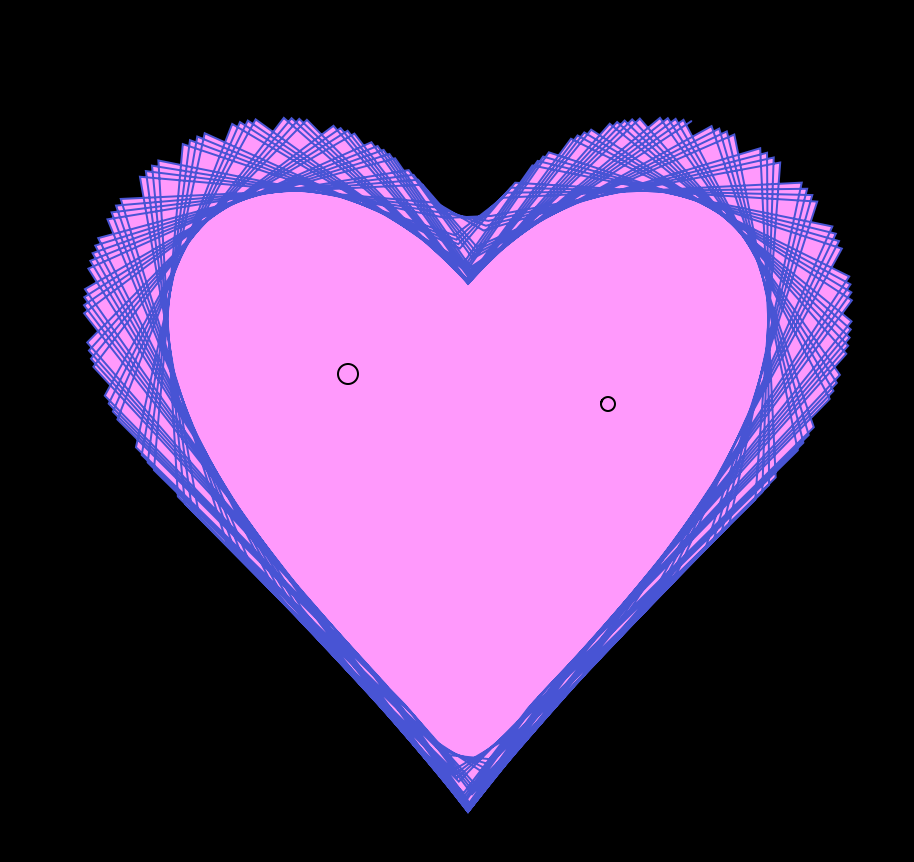
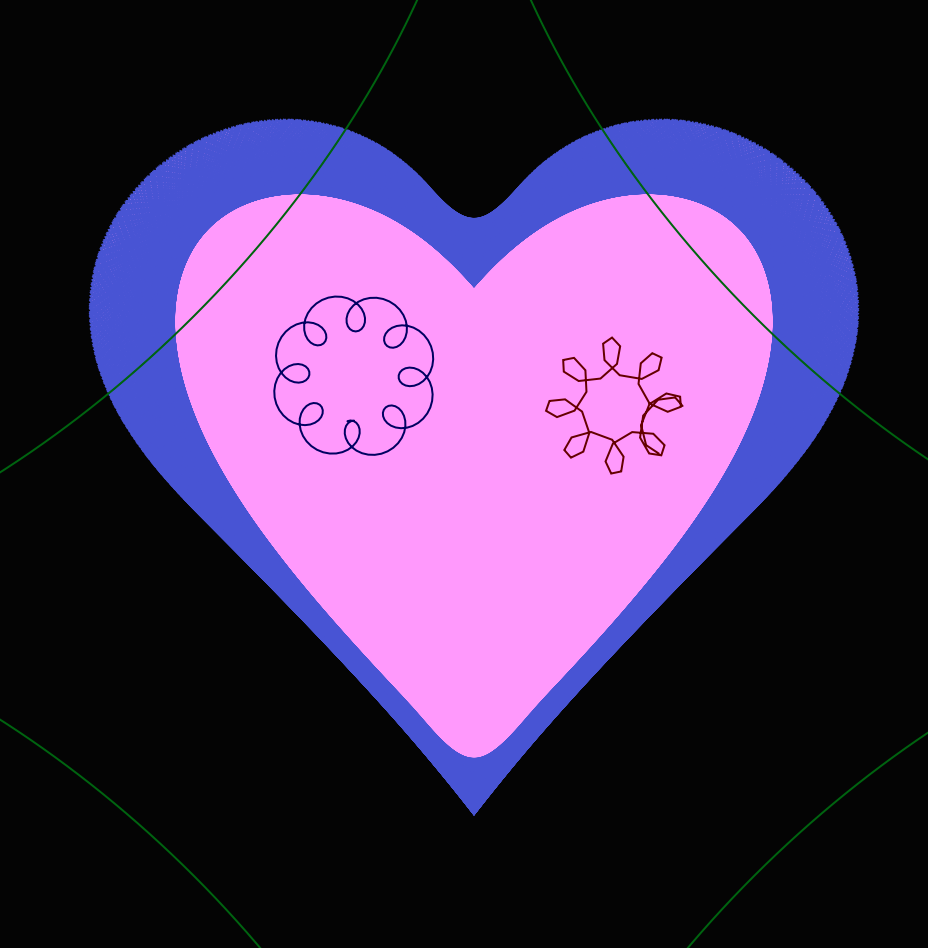
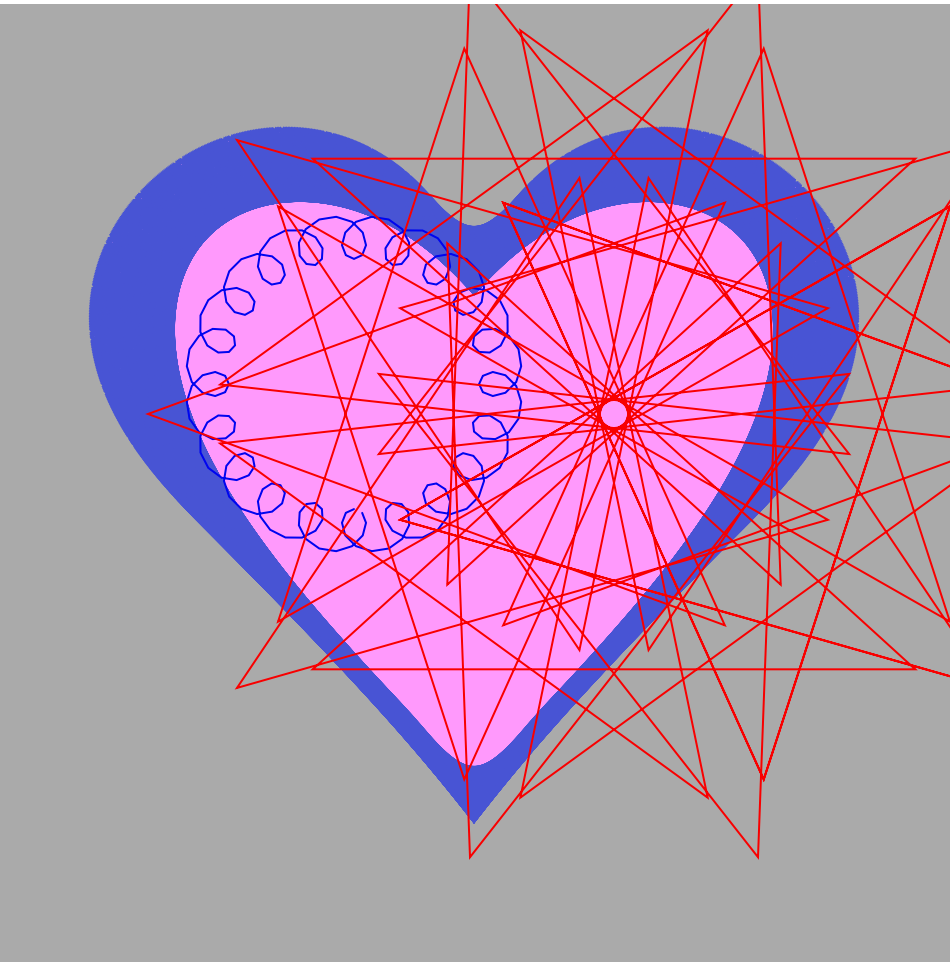
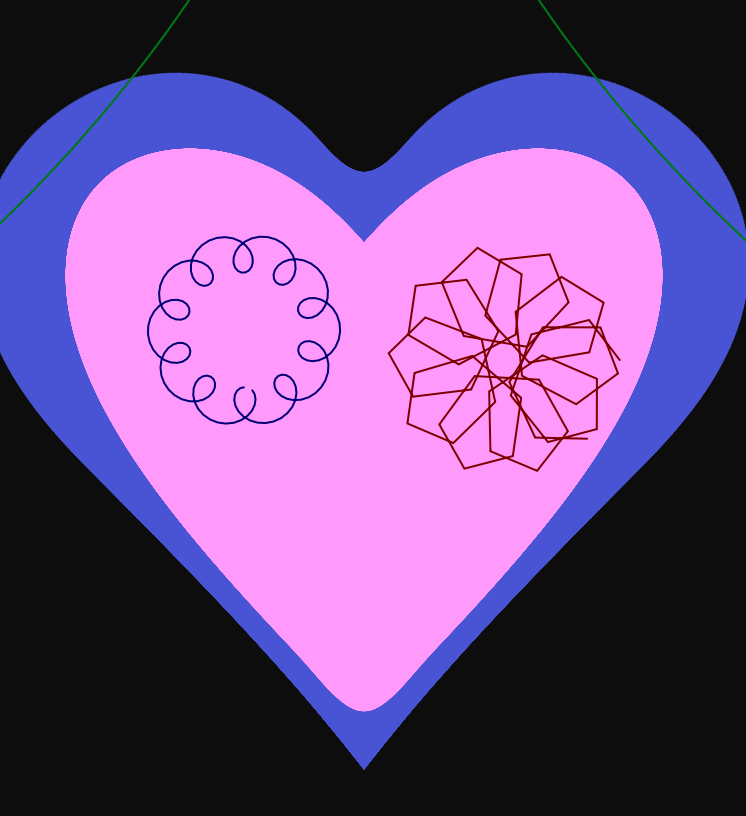
}In this project I drew the curve of a heart and inside of a heart there’s 3 addition curves. Epitrochoid and hypotrochoid in my opinion were kind of like opposite of each other since epitrochoid draws ellipses inside and hypotrochoid draws ellipses outside. For me it was kind of challenging to do this because I had to research a lot of new functions such as Math.pow and many things for me didn’t work so I had to change the curves multiple times for them to work. It was interesting to analyze how angles of 0.1 or 1 would affect the curves, sometimes the smaller the angle the bigger the shape became which is polar opposite of what would I have expected.
![[OLD SEMESTER] 15-104 • Introduction to Computing for Creative Practice](wp-content/uploads/2023/09/stop-banner.png)