LO 7 Data Visualization

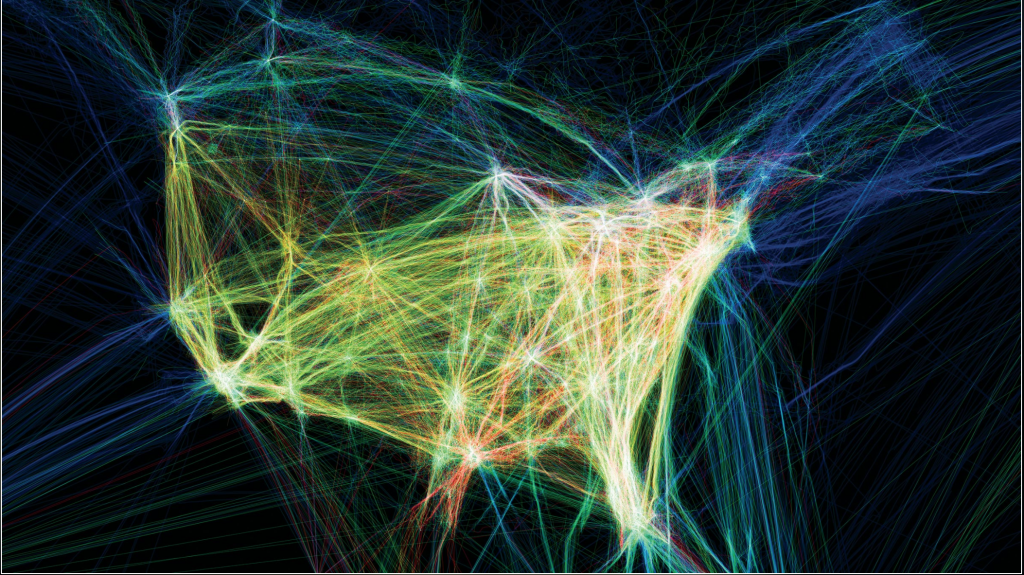
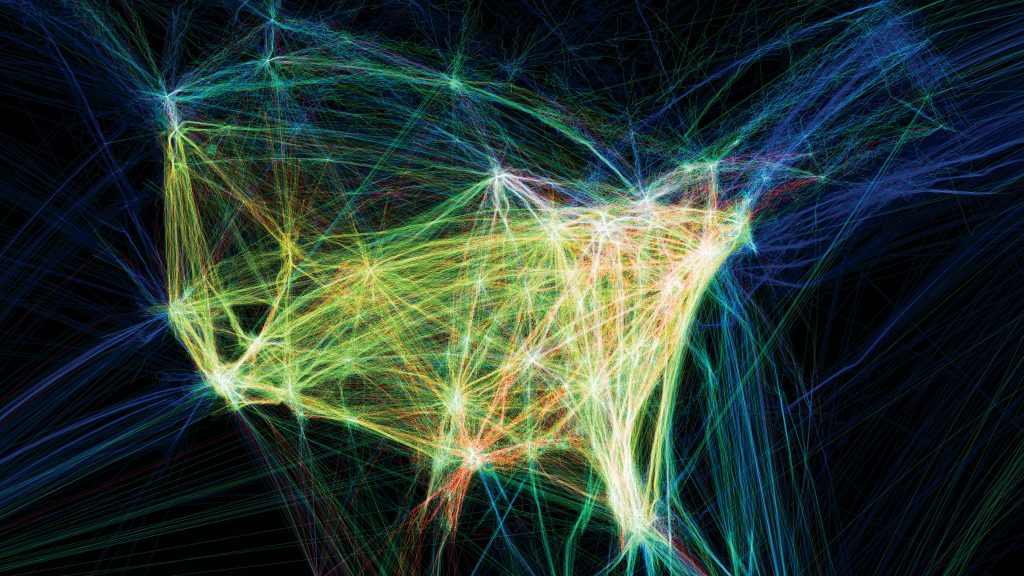
I really enjoyed the work by Aaron Koblin. Their work, “Flight Patterns” is very exquisite in terms of the visual elements. I really enjoy the glowing effect of the many lines. I also am fascinated by the idea behind. It basically maps the paths of air traffic over North America in colour and form. It was done using the Processing programming environment as they took data from the FAA. I enjoy the randomness of the lines and the abstract shape of North America that is created with line densities. I also like how the major destination are highlighted because of the number of lines starting and ending there. The artist has done a good job of preserving its cohesiveness while working that big of a data set. 

http://www.aaronkoblin.com/project/flight-patterns/

LO: Information Visualization

Atlas of Emotions

This Data Visualization, by the group Stamen Design, is a visualization of the atlas of human emotions, designed for the Dalai Lama and scientist Dr. Paul Ekman. It features scholarly findings about emotions and maps it into a series of graphs and interactions on their live website, which brings in different factors such as emotions, triggers, and responses to map how different triggers may cause different emotions in us. For the data itself, the studio and Ekamn conducted a peer-reviewed study among other emotion-studying scientists called “What Scientists Who Study Emotion Agree About,” from which they derived that five emotions in particular are considered and widely acknowledged as universal regardless of culture: anger, fear, sadness, disgust, and enjoyment. I admire that the project uses computation and code to map something so human, visceral, and natural as emotions themselves, and I particularly enjoy the way they graphed the different states of emotions from least to most intense, using shapes, colors, and line qualities that help visualize the emotions themselves, which also point to the design studio’s artistic sensibilities beyond simply plotting data points.

LO7: Data Visualization

For my Looking Outwards, I picked a project done by the data visualization firm
Pitch Interactive. The project, Decoding Asian Hate, is an interactive data visualization that shows a timeline of Asian Hate incidents over the span of January 2020 to present. For the client The Asian American Foundation, Pitch Interactive turned these incidents into fragments of shattered glass. The shards of glass rotate in 3 dimensions around the screen. Users can click an individual shard, and it will bring up an overlay of the news article and date information. I think that this project sheds light on such a critical issue in a really unique and engaging format. Rather than just a raw text timeline, the designers made it into an experience that brings a raw emotive reaction that provides a completely more dramatic outcome to sway audiences.

https://www.pitchinteractive.com/work/DecodingAsianHate/
Pitch Interactive, 2021

LO 07: Data Visualization

Link: https://impfdashboard.de/
Project: Visualizing the vaccination progress in Germany
Creators: Nand.io

The project that I found interesting was one from Nand.io which visualizes vaccination progress in Germany. On the web page that they made, there are a plethora of interactive maps that the user is able to hover over and see the progression of vaccination rates. A part that I found extremely interesting was their tracking of different milestones within the pandemic (see below). The user is able to see a timeline with different milestones all piled on top of each other. They can then hover over different sections and see more information about them and when they took place. This is something I’ve never seen before in tracking covid cases or vaccinations which I think is really interesting to visualize. What I admire most about this project is that it is using data visualization for a very important purpose. I think especially now, being able to make progress tangible and visual can help people move forward and be hopeful for change.

Looking Outward 7

Martin Wattenberg Application of the Embedding Projector

Martin Wattenberg works with computational information visualizations and one project that was particularly interesting to me was the one about machine learning. In this project he used the Embedding Projector, which is a visualization tool for high-dimensional data which he helped create. The algorithms generate the work by using the input data to computational visualize and display the information. Martin co-founded Google People + AI Research which has worked toward further understanding and improving human / AI interaction. The key goals of his research and projects into machine learning are to broaden interaction within AI and computational representation tools. The Embedding Projector is what’s shown above and is a key for creating interactive exploration into high-dimensional data. This type of interaction allows new patterns and connections can be made within the data as it’s visualized in various ways. Ultimately the artist’s sensibilities are able to be specific to each data set as it can be visualized in different ways.

http://bewitched.com/machine-learning.html

LO: Computational Data Visualization

A student in CMU Design called Bryce Li created a website in 2021 that helps visualize songs by a specific artist. If you like a song by that artist, the website can show you other songs by the same artist that are similar. This information is presented in clustered data points that are visualized as circles. Each circle represents a song and the closer 2 circles are together, the more similar those songs are. When you click on a circle, it also plays a 30-second clip of the song so you can hear it for yourself. This website was coded using libraries from React and Three js. And the coding languages are HTML, CSS, and JS. To cluster different points by shared similarities, Spotify has a quantifying API that Bryce used along with a k-means clustering algorithm. I thought this was interesting because I often come across a similar situation where I like an artist’s song but I don’t know how to find similar songs. By simplifying the amount of data a user sees and taking away unnecessary information, this website, therefore, communicates clearly what the user wants to know: similar types of songs by the same artist.

Bryce’s Vimeo video describing his project

Information Visualization

I am a huge fan of quirky jewelry, so I think this project is super cool. Rachel Binx makes earrings and necklaces using various unicode arrows. I hadn’t thought about how many there were until I looked at her work. All of the pieces look crisp and classy. Although simple, I can imagine that certain arrows hold special significance to specific people. To make such a large range of options, Binx has compiled a list of unicode arrows that people can use. Honestly this seems like too many, but apparently all of them were approved by a group who thought they were worth using. Binx’s database + jewelry shop is an incredibly cool blend of technology and fashion.

Rachel Binx: Unicode Arrows

https://unicodearrows.com/

LO 7: Information Visualization

Title: WHO Immunization Progress Reports

Year: 2020

Artist: Stamen

Work

Stamen is a data visualization design agency that combines creativity and fun with utility. I also think that information can also be shown in creative ways which is why I wanted to look into a project that they created. One that I think is cool is the World Health Organization immunization Progress Report in which Stamen created data visualization of the world and their immunization progress. The compelling visualizations that they created tell a story of countries that have made significant progress in their immunizations. Data, especially data that involves other countries should be visualized because they are an easy way for people who speak different languages to understand information. Because Stamen is working with WHO, I think that their visualization was a smart and creative way to visually tell this story in a way that is accessible for everyone to see. Although these visualizations don’t solve the problem of increasing immunizations in countries, designing a way that people can see that these countries are struggling can lead to more solutions.

Looking Outwards – 07

This project is called Flight Patterns by Aaron Koblin. 

Flight Patterns (North America)

This is the visualization of the dataset of air traffic in North America. I think this project is very interesting in that each line created represents a different path, and in the end, the general form created reminds the audience of the form of North America on the map. The points of destinations of
“meeting points” that are overlapped often are white, and the paths, in general, have different colors to give diversity to the work and emphasize each unique flight pattern. As indicated from the official site, the dataset of the patterns was plotted using a processing programming environment. 

Link

LO-07

Jonathan Harris’s A Silent Place


The Looking Outwards topic for this week is computational information visualization. I chose to write about Jonathan Harris’s “a silent place.” A silent place is a pictographic oracle consisting of rock drawings from the Utah desert.  When Harris visited this site in Utah, he was struck by the deep silence of the ancient images, which exist beyond interpretation— their meanings can be guessed at, but can never be known.each drawing appears for 227 seconds and reappears 227 minutes later in a cycle that continues indefinitely. Harris created a Magic 8 Ball with no words, speaking out of the silence, helping people see what they already know. I admire the fact that Harris thinks that nature can have this much power over emotions. I found this project really interesting due to the abnormal use of pictures on a website. The pictures were also very cool and presented very well on the website.

an example of a picture on this site