Link: https://impfdashboard.de/
Project: Visualizing the vaccination progress in Germany
Creators: Nand.io
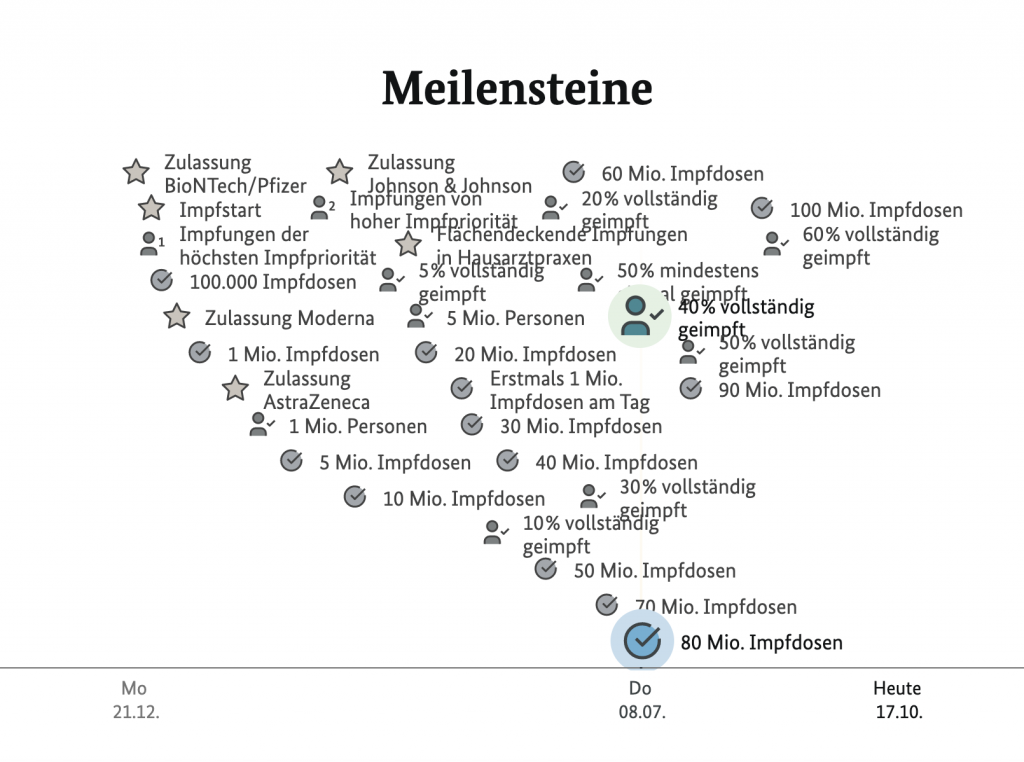
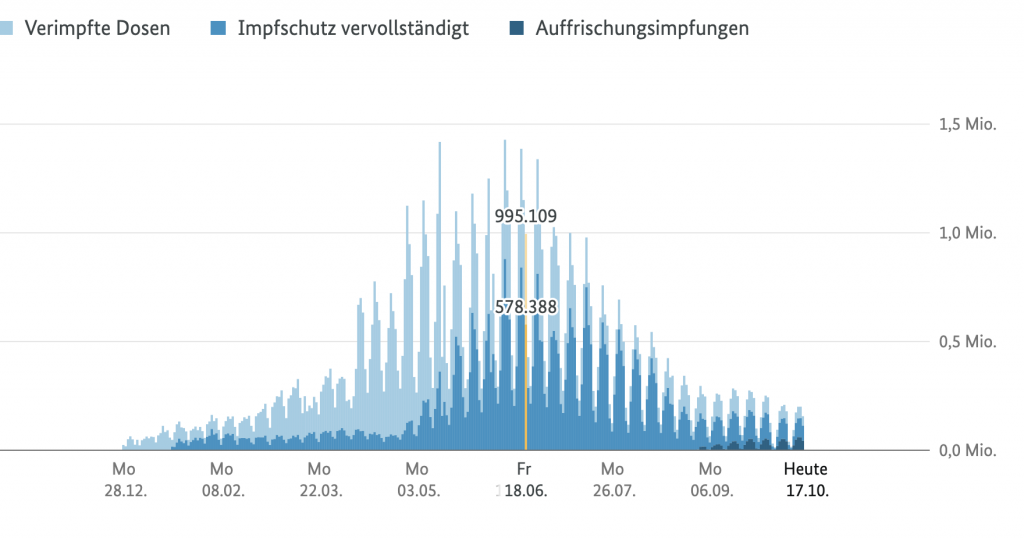
The project that I found interesting was one from Nand.io which visualizes vaccination progress in Germany. On the web page that they made, there are a plethora of interactive maps that the user is able to hover over and see the progression of vaccination rates. A part that I found extremely interesting was their tracking of different milestones within the pandemic (see below). The user is able to see a timeline with different milestones all piled on top of each other. They can then hover over different sections and see more information about them and when they took place. This is something I’ve never seen before in tracking covid cases or vaccinations which I think is really interesting to visualize. What I admire most about this project is that it is using data visualization for a very important purpose. I think especially now, being able to make progress tangible and visual can help people move forward and be hopeful for change.


![[OLD SEMESTER] 15-104 • Introduction to Computing for Creative Practice](wp-content/uploads/2023/09/stop-banner.png)