![[OLD SEMESTER] 15-104 • Introduction to Computing for Creative Practice](../wp-content/uploads/2023/09/stop-banner.png)
Randomness & Objects
Learning Objectives
- Use the noise() function to generate a random signal (e.g. the stock market value over a period of time).
- Determine when the stock market is rising and falling and color code this clearly.
- Make the stock market plot scroll to show it evolving over time.
- Create an array of objects to simulate a fish tank.
Participation
In this lab/recitation, you will write some p5.js programs that use the techniques you’ve learned in class so far. The goal here is not just to get the programs done as quickly as possible, but also to help your peers if they get stuck and to discuss alternate ways to solve the same problems. You will be put into breakout rooms in Zoom to work on your code and then discuss your answers with each other, or to help each other if you get stuck. Then we will return to discuss the results together as a group.
For each problem, you will start with a copy of the uncompressed template-p5only.zip in a folder named lab-07. Rename the folder as andrewID-07-A, andrewID-07-B, etc. as appropriate.
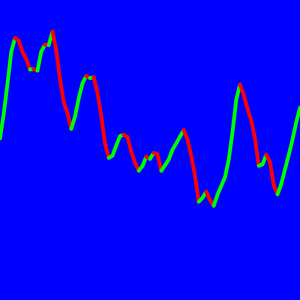
A. Simple Stock Market Tracker
Write a p5.js program that simulates a stock market tracker that show the stock market “price” as shown below. Note that you will be using the noise() function to generate the values, so you won’t get the exact same picture, but you will get something that looks like this in principle.

You should program this for any general canvas size, but the canvas size in this exercise will be 400 x 400.
Start by defining a global variable marketvalue for an array of market values, initially empty. Also define a global variable noiseParam initialized to 0 to use for the noise() function later and a global variable noiseStep initialized to 0.1 to use to update the noiseParam for each subsequent value you generate. See the Perlin examples from Lecture 15 for guidance.
For your setup function, create the canvas and set the stroke weight to 5. Next, run a loop that creates a new market value using the noise() function and store it in the next available position in the array. You should generate width/5 + 1 values. For a 400 x 400 canvas, you’d generate 81 values. To generate each value inside your loop:
- Generate a random value using the noise function with noiseParam as its argument. Store this in the variable n. Remember that n will be between 0 and 1.
- Use the map function to map n from the range 0 to 1 to the range 0 to height. Store this value in the variable value.
- Append value to your array marketvalue using the push function.
- Add noiseStep to noiseParam to prepare it for the next iteration.
For your draw function, set the background to blue and the stroke to white. Then write a for loop that draws a line between each pair of adjacent values in the marketvalue array. Each line will have a width of 5 pixels:
The first line will start at x = 0, y = marketvalue[0]
and end at x = 5, y = marketvalue[1].
The next line will start at x = 5, y = marketvalue[1]
and end at x = 10, y = marketvalue[2].
The next line will start at x = 10, y = marketvalue[2]
and end at x = 15, y = marketvalue[3];
and so on…
The last line will start at x = 395, y = marketvalue[79]
and end at x = 400, y = marketvalue[80].
(Look for the pattern here!)
(Once you have this working, experiment with noiseStep. What happens if you increase it to 0.5? What happens if you decrease it to 0.05? Why?)
B. Improved Stock Market Tracker
Once you have a working solution for problem A, copy this project into a new project for problem B. Modify the draw function in your p5.js program so that it shows lines going upward (or level) as green lines and lines going downward as red lines. Note that your canvas is upside-down (y increases downward), the values stored in your array will be treated opposite to what they are numerically. In other words, if the next value in the array goes up numerically, then your line plot will go down since y increases from top to bottom.
Once you have that working, try to make a moving stock market tracker! To do this, before you draw the market value lines in the draw function, remove the first value in the marketvalue array (hint: use shift) and then append a single new noise value on to the array like you did in setup.
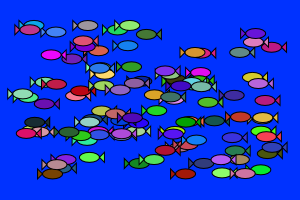
C. Fishes as Objects
For this final exercise, you will recreate your aquarium by creating an array of fish objects. You will then draw them as you did before, but you will access the data for each fish using array and object notation. This exercise is very similar to the one done in lecture 16 for Many Boxes.
To get started, start a new sketch with the following code from our previous lab:
Start by replacing the original four arrays with just one array named fish to represent an array of fishes, initially empty.
In the setup function, update the body of the loop so that you create a new object for the ith fish and then you set the x, y, dx and c fields for that fish to the indicated random values. (Look at the example for lecture for the general idea!)
in the draw function, update the body of the loop so that you call the function draw_fish with the ith fish, fish[i]. You don’t need to pass all of the values now (x, y, dx and c) since they are contained in the fish object! For the rest of the code, update the references to the x and dx values, remembering that these are stored in fish[i] now. So instead of writing x[i], you would write fish[i].x to get to its x value.
In the draw_fish function, replace the four parameters with just one, f, representing a generic fish. Remember that the draw function will call this function with fish[i], a specific fish. For this function, we only need a general name to represent that fish, f. Then update the code in this function to access x, y, dx and c through object f using dot notation.
Once you’re done, it should run the same as in lab 6!
Handin
At the end of the lab, zip the lab-07 folder (whatever you got done) and submit it to Autolab. Do not worry if you did not complete all of the programming problems but you should have made it through problems A and B in some form, and you should have reached problem C. If you did not complete all of the lab exercises, be sure to try to complete them in the next day or so since these will help you with the next deliverable!