![[OLD SEMESTER] 15-104 • Introduction to Computing for Creative Practice](https://courses.ideate.cmu.edu/15-104/f2021/wp-content/uploads/2023/09/stop-banner.png)
sketch
//Anthony Pan
//Section C
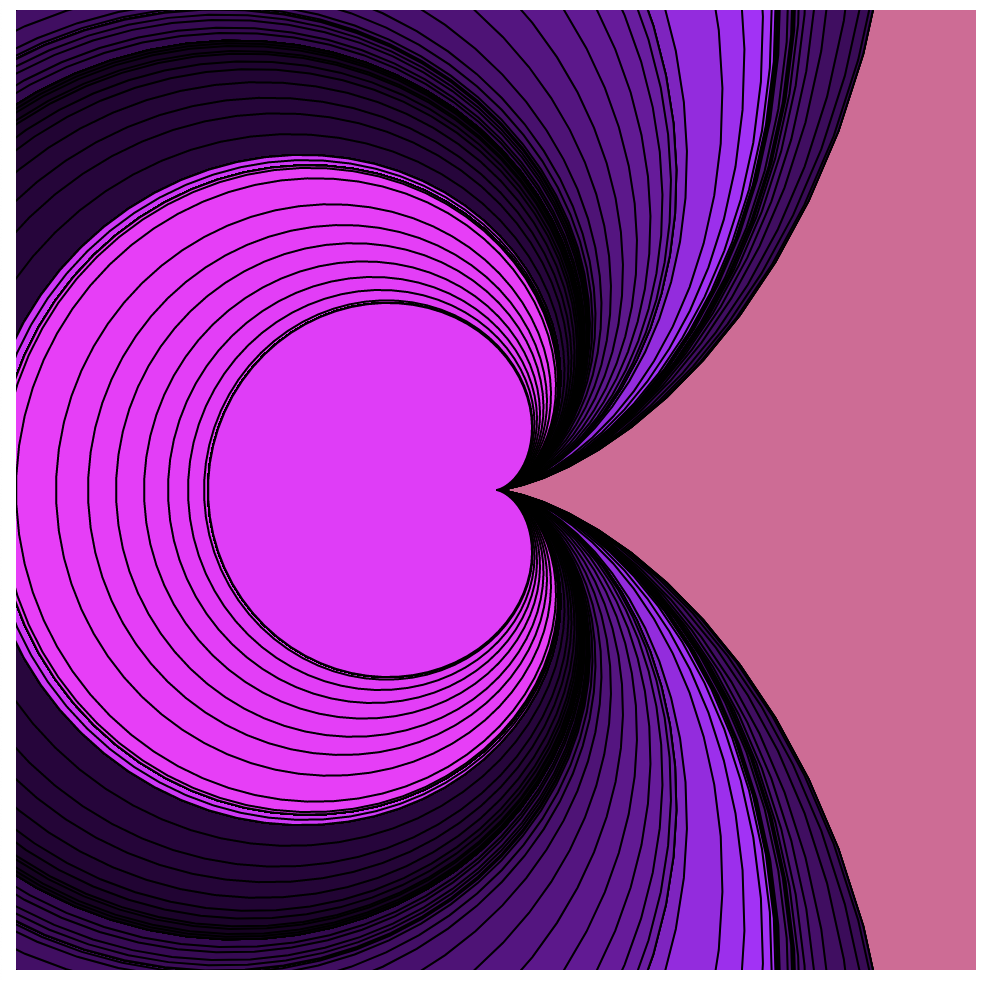
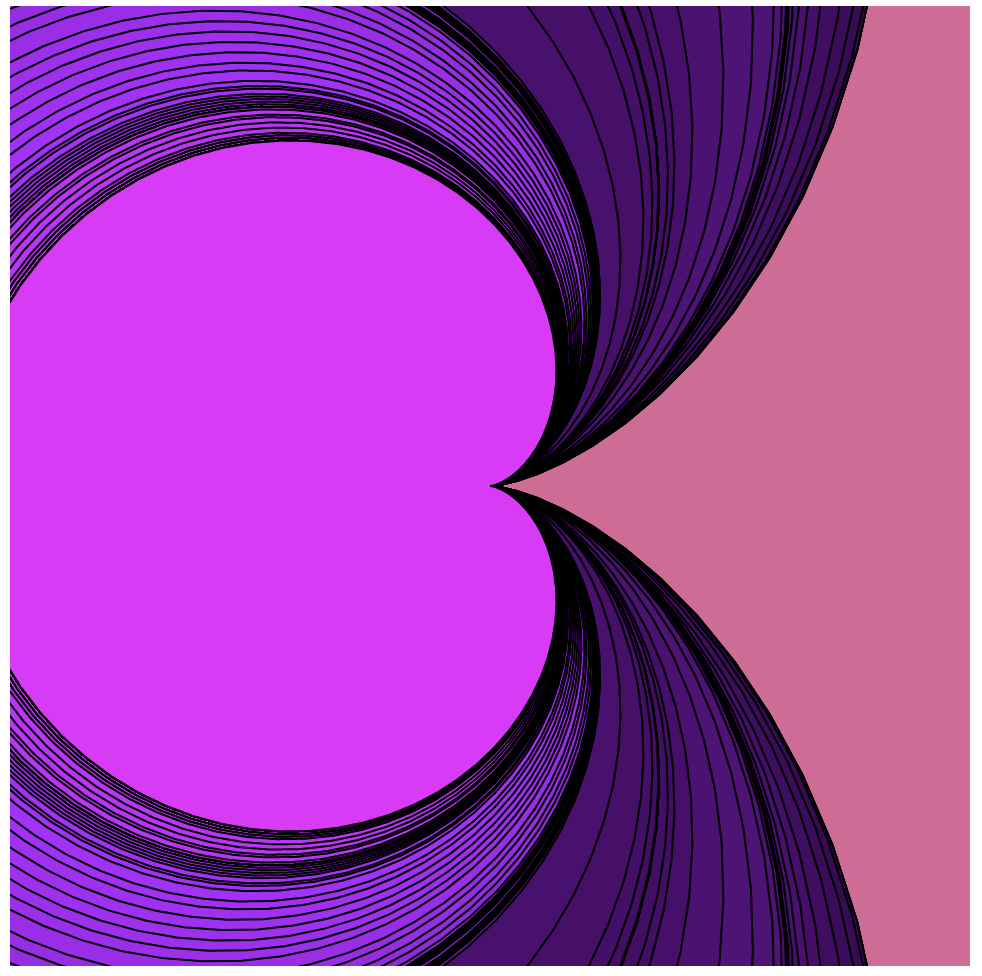
//Cardioid Curve Interaction
//polar coordinate equation r = a*(1-cos(theta))
//parametric equation
//x = a * cos(t) * (1 - cos(t))
//y = a * sin(t) * (1 - cos(t))
//mouseX change colors
//mouseY changes how many are drawn
function setup() {
createCanvas(480, 480);
background(220, 100, 150);
}
function draw() {
//var x1 = 0
//var y1 = 0
push();
//drawRect(x1,y1); //draw another shape
translate(width/2, height/2);
drawCardioidCurve();
}
function drawCardioidCurve() {
var x;
var y;
var a = 80;
var h = mouseX; //mouseX interaction
var h1 = map(mouseY, 0, 480, 0, 256); //mouseY interaction
fill((h1 * 0.7)%256, 0, h1);
beginShape();
for(var i = 0; i < 101; i++) {
var theta = map(i, 0, 101, 0, TWO_PI);
x = (h + a) * cos(theta) * (1 - cos(theta));
y = (h + a) * sin(theta) * (1 - cos(theta));
vertex(x, y);
}
endShape(CLOSE);
}
For this project, I wanted to create a curve that would be drawn multiple times as the user moved mouseX. I chose to create a heart using the cardioid function and chose purple/pink as my color for the heart. I wanted it to feel like you were drawing hearts repeatedly that would change color and dimensions based on the mouseX and Y positions.
For the process, I did something very similar to the technical assignment this week, utilizing an equation to draw the different points on the curve rather than the noise function.