![[OLD SEMESTER] 15-104 • Introduction to Computing for Creative Practice](https://courses.ideate.cmu.edu/15-104/f2021/wp-content/uploads/2023/09/stop-banner.png)
// This program displays a grid of Epitrochoid curves with increasing nPoints and cusps.
// The canvas sets up with a 5x5 grid;
// When the mouse is pressed, more curves are drawn.
// Pressing the spacebar deletes one row and column.
var c; // color
var density = 5; // number of curves in each row and column
var nPoints; // number of points used to draw each curve
var cusp; // number of cusps on each curve
var mode = 0 // default mode uses Epitrochoid formula, other mode uses an edited Epitrochoid-like formula
function setup() {
createCanvas(480, 480);
}
function draw() {
background(200, 200, 255);
// draw a grid of curves based on density value:
for (var k=0; k<density; k++) {
cusp = k+1; // number of cusps increases from left to right
for (var j=0; j<density; j++) {
push();
translate(k*width/density+240/density, // keeps grid centered regardless of density changes
j*height/density+240/density);
nPoints = (j+1)*density // number of nPoints increases from top to bottom
//color based on grid and mouse location:
let r = map(j, 0, density, 0, 255);
let g = map(k, 0, density, 0, 255);
let b = map(mouseX, 0, width, 0, 255);
c = color(r, g, b);
// check which mode we are in and draw curves:
if (mode == 0) {drawEpitrochoidCurve(nPoints, cusp, c)}
else {drawEpitrochoidyCurve(nPoints, cusp, c)}
pop();
}
}
// labeling for easier understanding of the grid pattern:
textFont('monospace');
text('click mouse for more curves, press spacebar for fewer curves', 20, height-12);
text('press "w" for weird curves, press "r" for default curves', 20, height-3);
text('n u m b e r o f c u s p s ----- >', 5, 10);
text('n P o i n t s', 5, 30, 1, 150);
push();
rotate(radians(90));
text('----- >', 140, -5);
pop();
}
// code adapted from sample in project description:
function drawEpitrochoidCurve(nPoints, cusp, color) {
// Epitrochoid:
//https://mathworld.wolfram.com/Epitrochoid.html
var x;
var y;
var a = 15;
var b = a / cusp;
var h = map(mouseY/8, 0, height, 0, a*5);
var ph = -mouseX / 40;
fill(color);
// shape of curve:
beginShape();
for (var i = 0; i < nPoints; i++) {
var t = map(i, 0, nPoints, 0, TWO_PI);
x = (a + b) * cos(t) - h * cos(ph + t * (a + b) / b);
y = (a + b) * sin(t) - h * sin(ph + t * (a + b) / b);
vertex(x, y);
}
endShape(CLOSE);
}
// code adapted from sample in project description and edited further:
// these curves do not interact with mouseY:
function drawEpitrochoidyCurve(nPoints, cusp, color) {
// Epitrochoidy: not quite an Epitrochoid, but follows a very similar formula
var x;
var y;
var a = 15;
var b = a / cusp;
var ph = -mouseX / 40;
fill(color);
// shape of curve:
beginShape();
for (var i = 0; i < nPoints; i++) {
var t = map(i, 0, nPoints, 0, TWO_PI);
x = (a + b) * cos(t) * cos(ph + t * (a + b) / b);
y = (a + b) * sin(t) * sin(ph + t * (a + b) / b);
vertex(x, y);
}
endShape(CLOSE);
}
// add one more row and column each time the mouse is pressed:
function mousePressed() {
density +=1;
}
//delete a row and column when the SPACEBAR is pressed:
function keyPressed() {
if (keyCode == 32) {
if (density == 0) {density = density } // dont let density variable go below 0
else {density -= 1 }
}
if (keyCode == 87) {
if (mode == 0) {mode = 1} // pressing 'w' switches to 'weird' mode
}
if (keyCode == 82) {
if (mode == 1) {mode = 0} // pressing 'r' switches back to default 'regular' mode
}
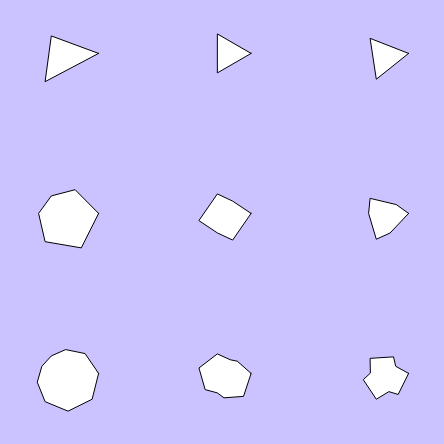
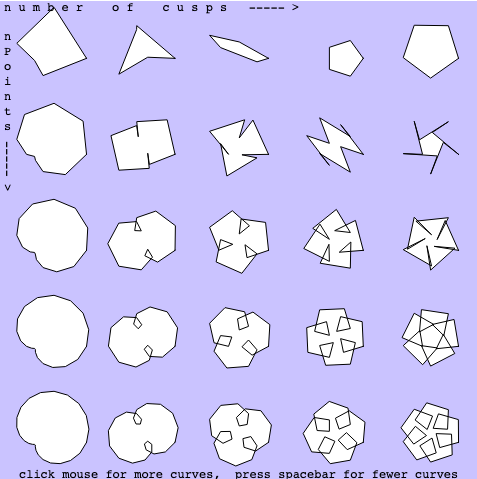
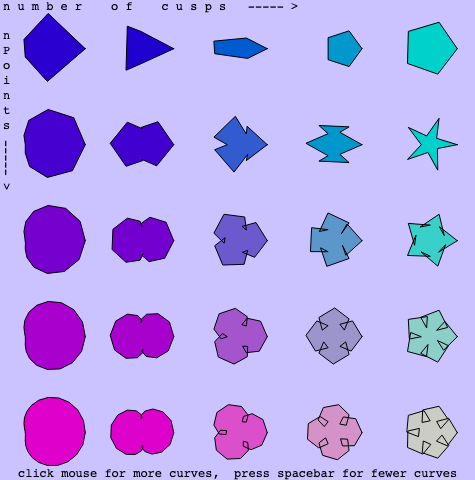
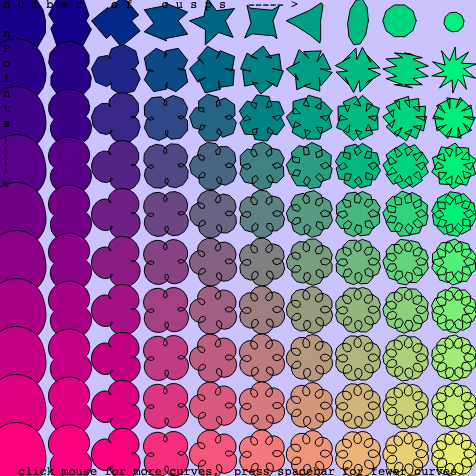
}After deciding to use the Epitrochoid curve formula, I realized that the sample in our project description is a very similar curve. Using the sample formula, I adapted the code until I liked what was being drawn on the canvas. Then I made a grid of curves and built them using various nPoint values and cusp values. As you can see in the drawing, as the curves are drawn from left to right, there are more cusps; and as they are drawn from top to bottom, there are more nPoints. Similarly to the sample code, my project uses mouseX and mouseY to interact with the angle and width of the curves. Additionally, the mouseX and mouseX variables are used to determine the fill color of each curve. When the mouse is clicked, the grid gets denser; when the spacebar is pressed, the density decreases. After playing around with the formula, I decided that I also wanted to include a mode for Epitrochoid-like curves that are not technically following the Epitrochoid formula. If you press ‘w’, the ‘weird’ mode turns on and the curves look strange and interesting. Pressing the ‘r’ key puts the program back into the default ‘regular’ mode. Below are a few screen shots that document some of my proccess: