![[OLD SEMESTER] 15-104 • Introduction to Computing for Creative Practice](../../../../wp-content/uploads/2023/09/stop-banner.png)
Hannah Wyatt
In Stefanie Posavec’s piece “art.park.data” she combines the unpredictability of childhood experience and nature with statistical/graphical representation. Each child was given a “Raspberry Pi” device, which aided in recording various data sets in the park: temperature, humidity, types of plants spotted, sounds heard, emotions, and others. The children were then tasked to supply this data per each latitude/longitude coordinate in order to create the mural.
The artwork, a 32.5m long data visualization displayed for the East London Canvas, is impressive to me because it effectively incorporates an aspect of the human experience with statistics. It also presents the data in an aesthetically pleasing way, with complimenting colors and shapes. While data is often confined to graphs or charts, this artwork offers a new perspective into data presentations, encouraging the observer to connect with outside ideas more effectively.
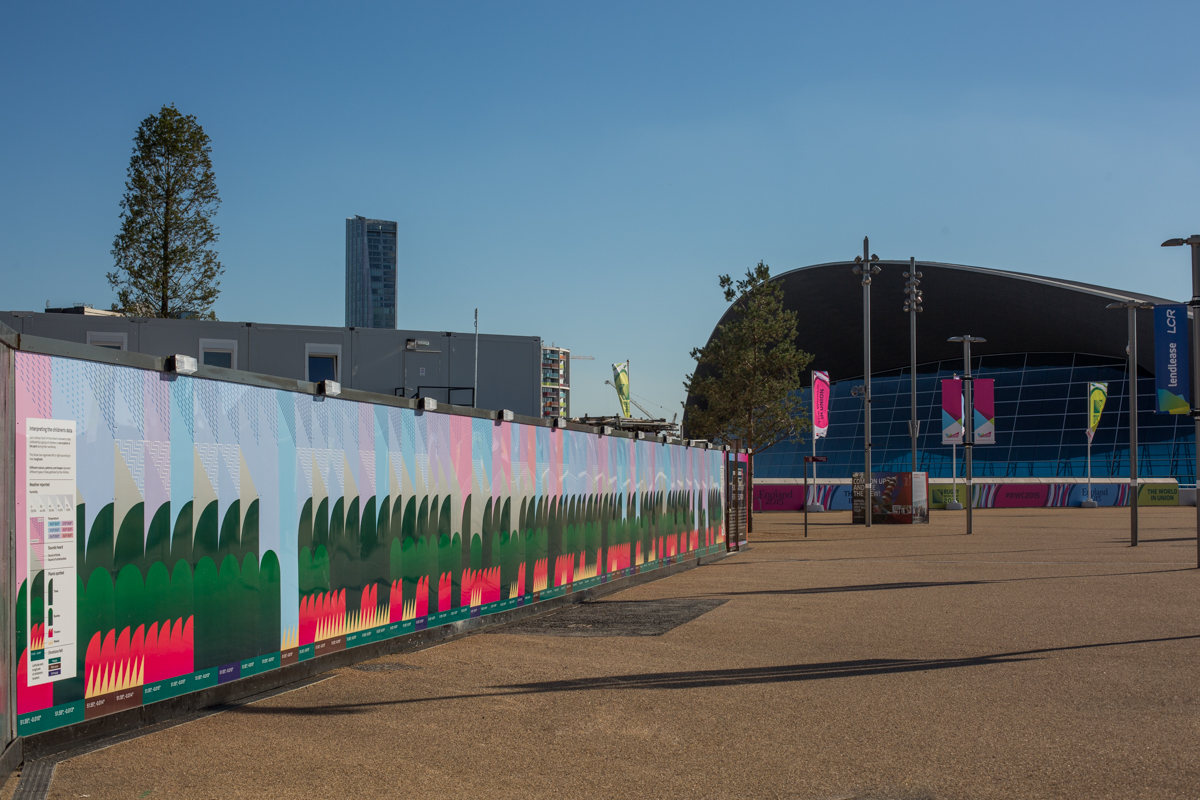
Art.Park.Data in the East London Canvas