![[OLD SEMESTER] 15-104 • Introduction to Computing for Creative Practice](../../../../wp-content/uploads/2023/09/stop-banner.png)
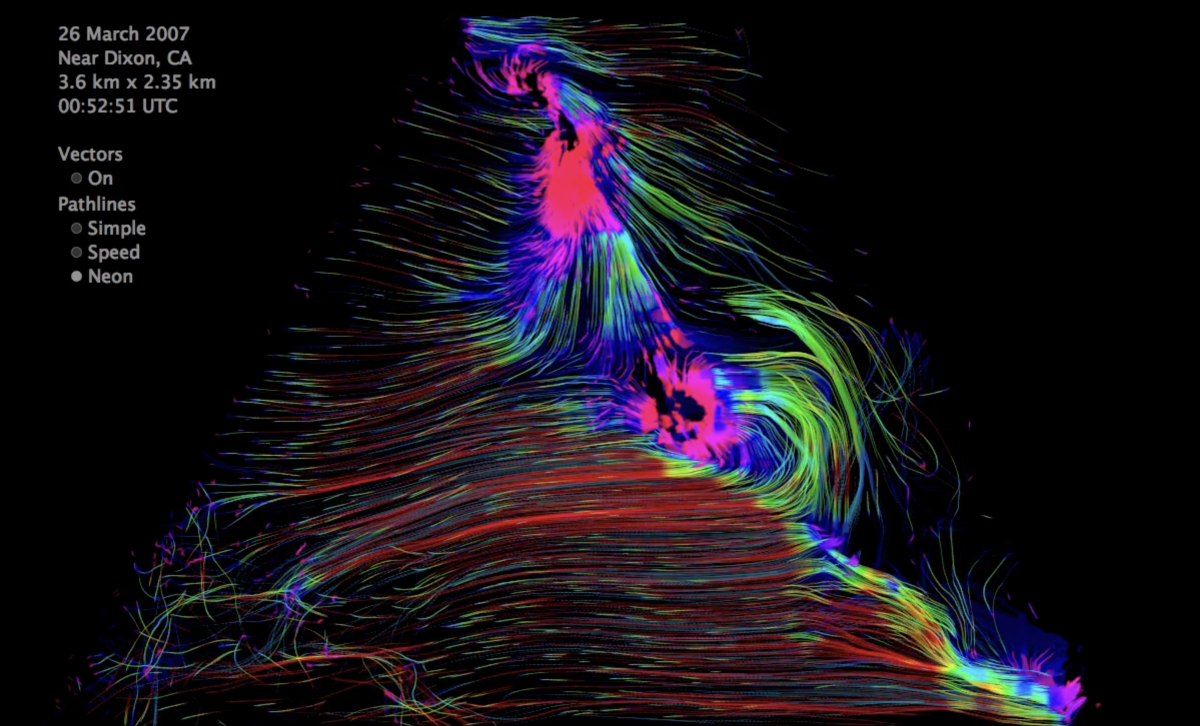
Jen Lowe, an artist and researcher, through her creative technology studio Maximal Expression, creates artistic data visualizations and looks at new ways to represent data that could open up brand new paths in data visualization. For example, her work “early particle flow lidar wind visualization,” is an incredibly smooth wind flow visualization. From the current wind flow diagrams in Architecture, which are static and more general wind visualizations, Lowe’s work opens up a new world for wind flow diagrams. The brightly colored work was made by taking raw, remotely sensed lidar data, filtering it, and putting it through an algorithm that creates wind vectors. The switch from static to animated flow fields inspires lots of new possibilities, personally, about integrating dynamic data visualizations with architecture to make it easier to read. I love how smoothly the colors and lines change, different from the usual static data visualizations. Lowe’s creativity in data visualization is seen all throughout her projects, but this one specifically sparked my interest due to its possible implementations in architecture.
Blog 07