![[OLD SEMESTER] 15-104 • Introduction to Computing for Creative Practice](https://courses.ideate.cmu.edu/15-104/f2022/wp-content/uploads/2023/09/stop-banner.png)
Looking Outwards 07
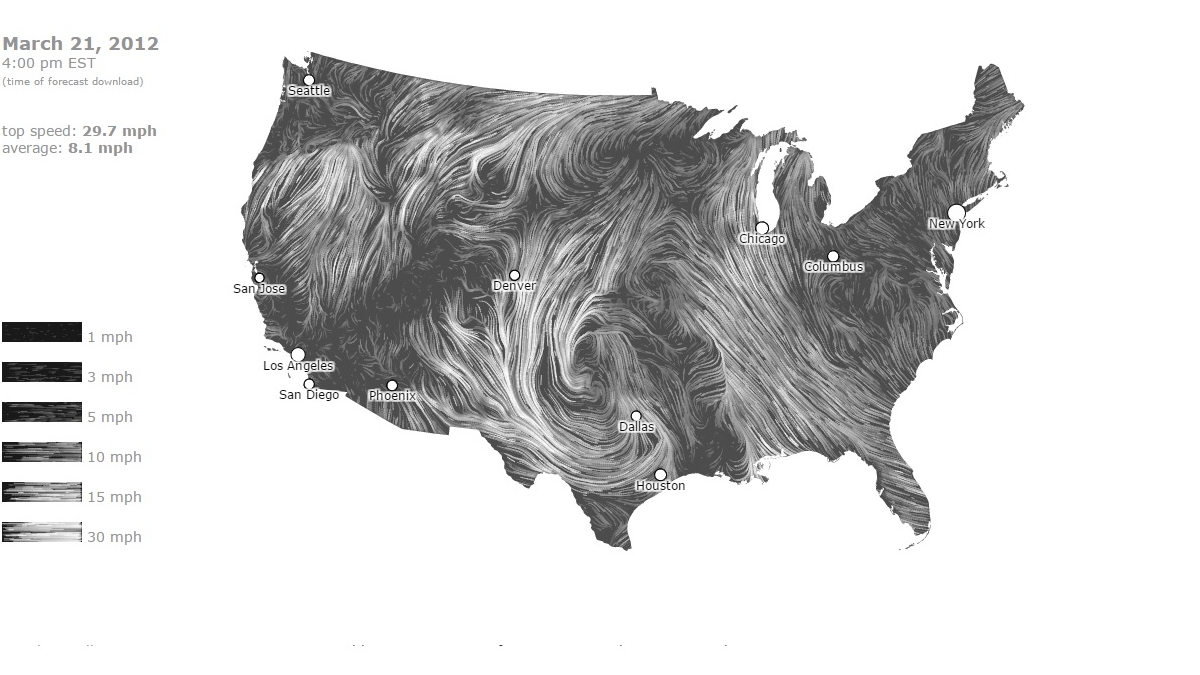
Wind Map.
I find this project extremely intriguing because of the many uses it provides that even the creators themselves have not anticipated. The Wind Map, created by Fernanda Viégas and Martin Wattenberg, shows real time wind data that comes from the National Digital Forecast Database. The technique includes using “comet-like trails to show motion”, and is derived from Edmund Halley in 1686. The project itself is entirely implemented in HTML and JavaScript.
The creators intended this project to be an emotional approach and artistic exploration that shows people where and when hurricanes and wind storms happen. I think it is fascinating that such a beautifully crafted project is constantly updating so people can relate and send hopes to areas with dangerous wind activity. The aesthetics of this project are extremely captivating: during times when the wind is calm, the make also looks serene and meditative. However, when there are severe hurricanes, large white strokes illustrate very scary movement that resembles lightning and chaos.
Furthermore, I am more fascinated that people have found unique ways to utilize this map. For example, bird watchers have used it to examine bird migration and cyclist have used it to plan for their trips. The use of a project like this can vary from the research level (ex. Architects studying site conditions), to a local or personal level (ex. Planning for a family trip). This is extremely captivating for me.
Fernanda Viégas