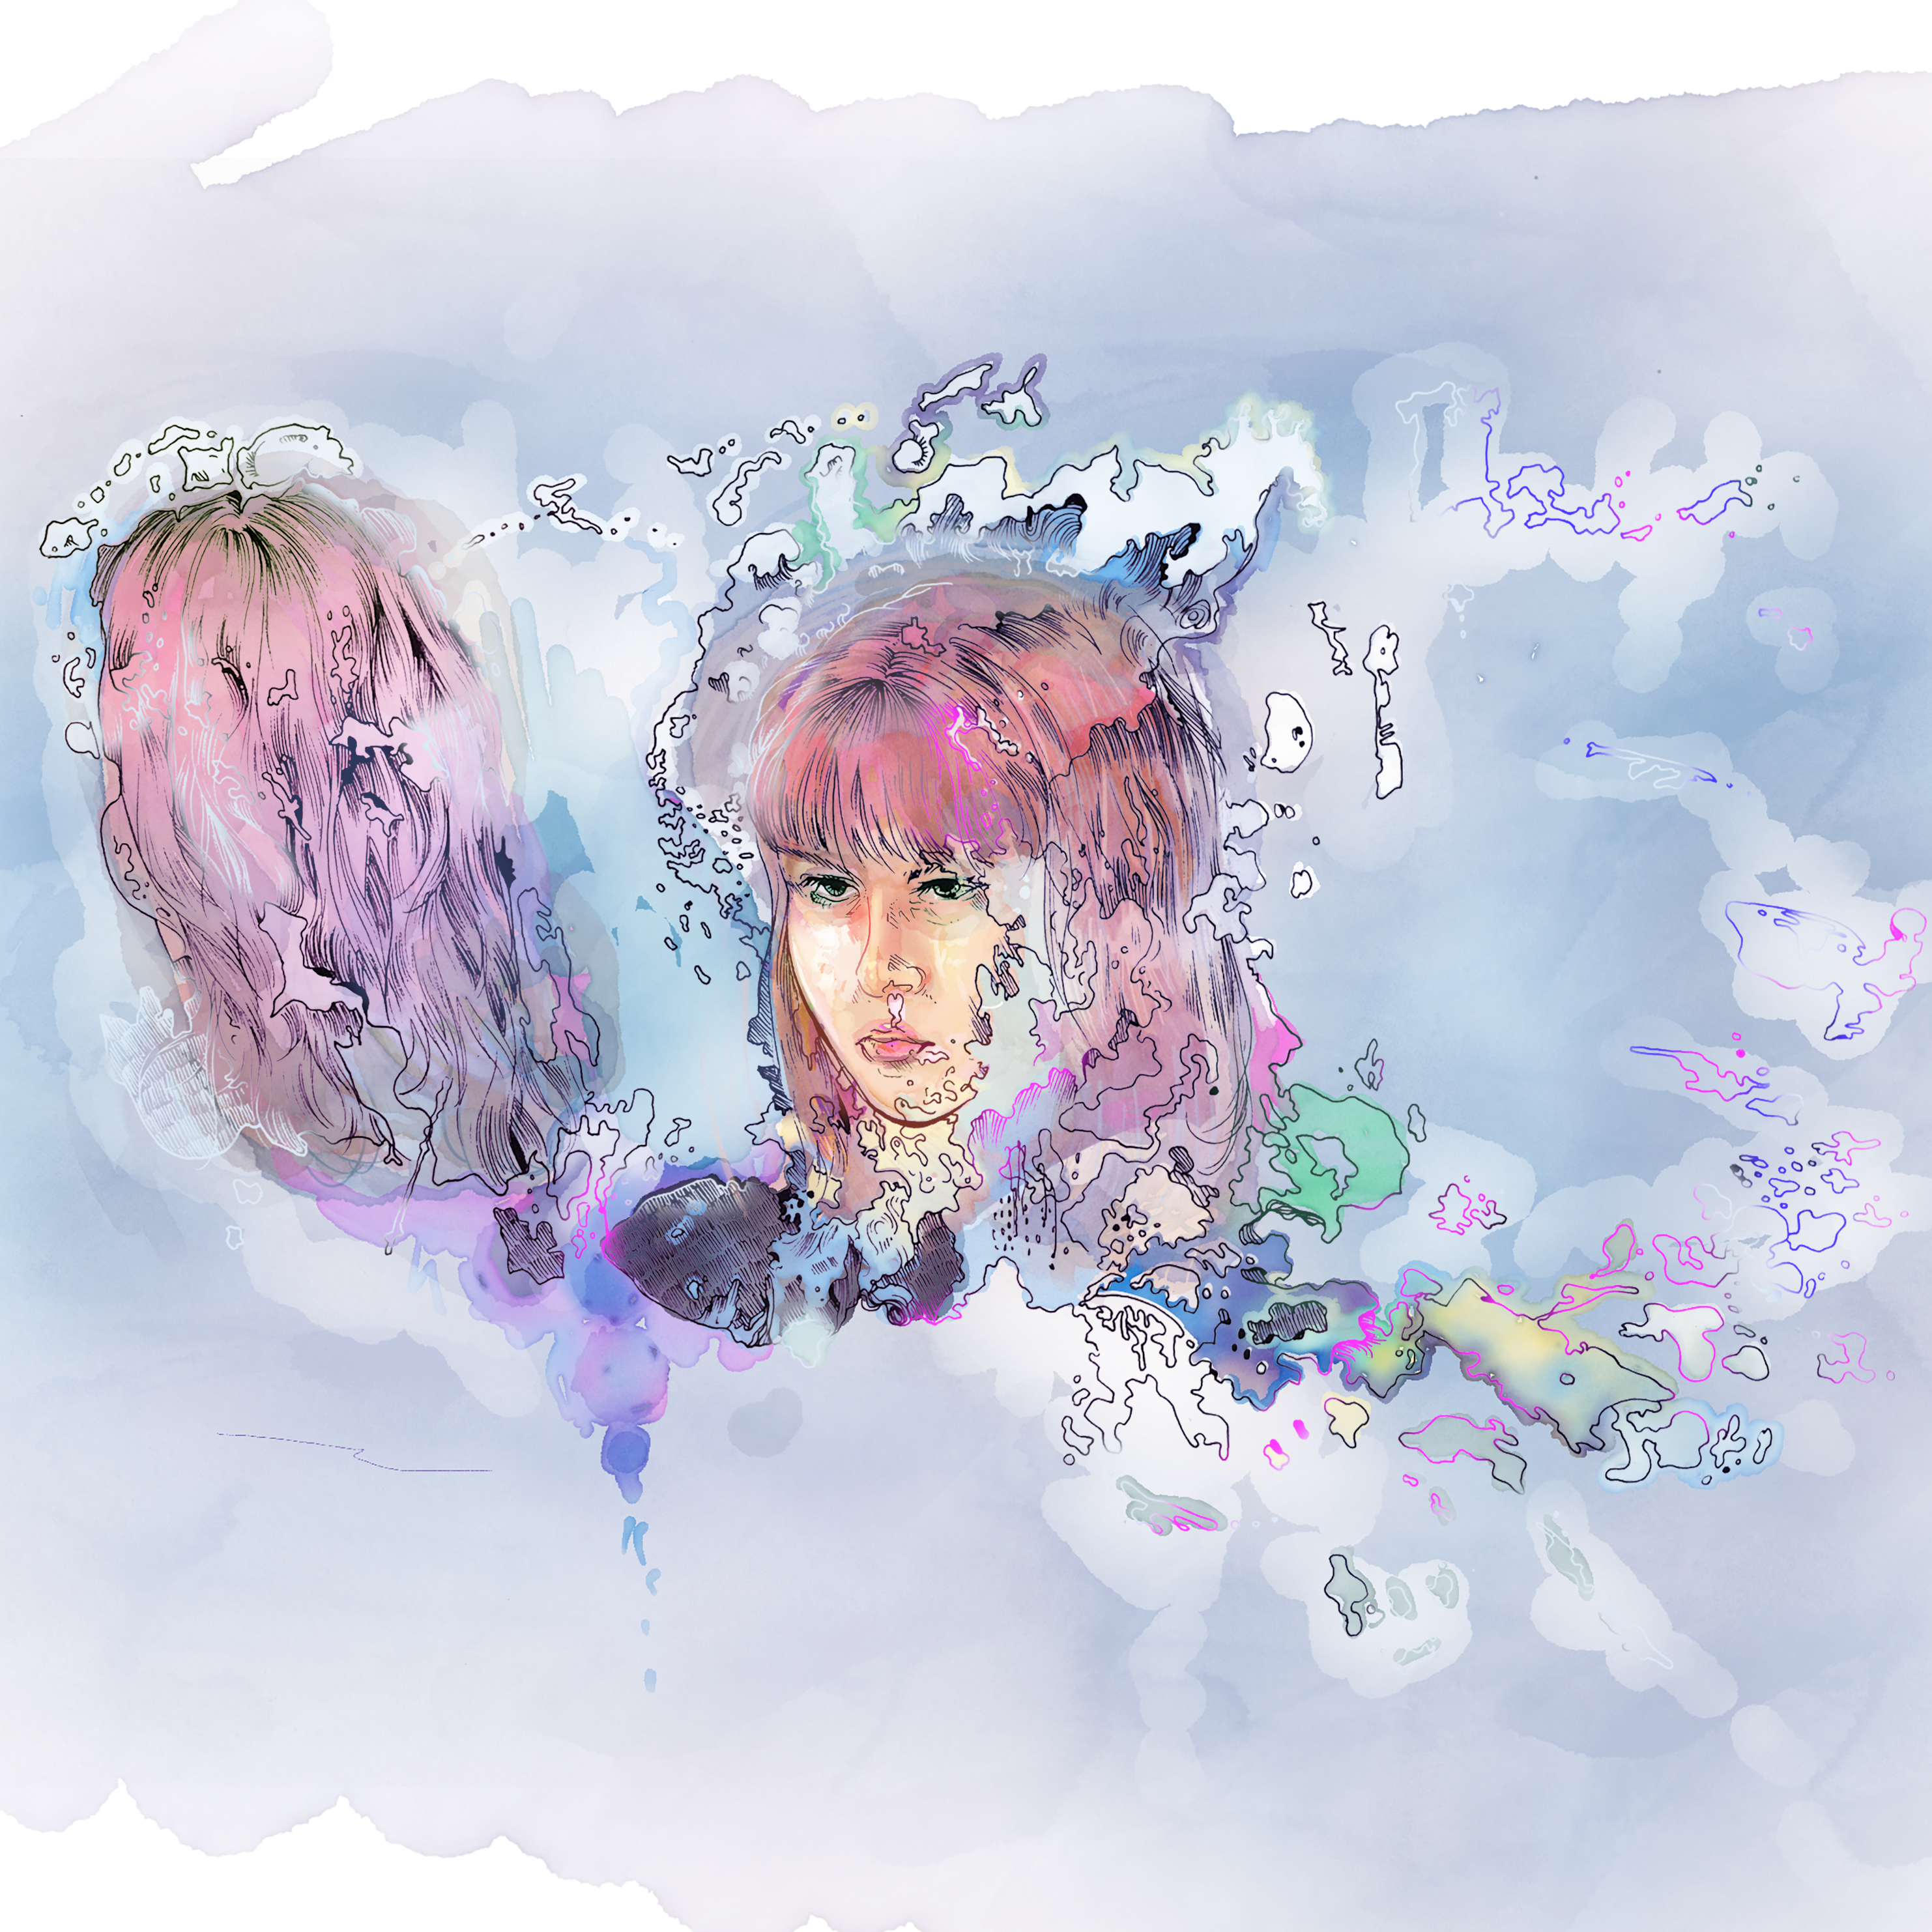
In my work, I want to depict the degradation of memories over time despite the seeming permanence of technology. Out of Memory is intended to turn a series of technical failures into something meaningful and aesthetically pleasing.
Part of the human condition is to have emotional attachments to mortal beings and ephemeral situations, which compels us to avoid loss by all means possible. Our collective fear of loss begets unique features of the human psyche, like the fear of dementia and obsession with documentation. Now more than ever, photography is seen as a tool for ‘capturing’ memories in ‘high fidelity,’ ‘lossless’ formats. But unless we were to create a simulation of equal size to our universe, a virtual space will always be a compressed version of its real-life counterpart. Like the human brain, which transforms memories with every re-encoding and imbues them with the context of their recollection, there is no perfect way to digitally recover a memory. Having experimented with photogrammetry over the course of my time in Experimental Capture, I realized that this method is a good visual and conceptual representation of my ideas about memory.
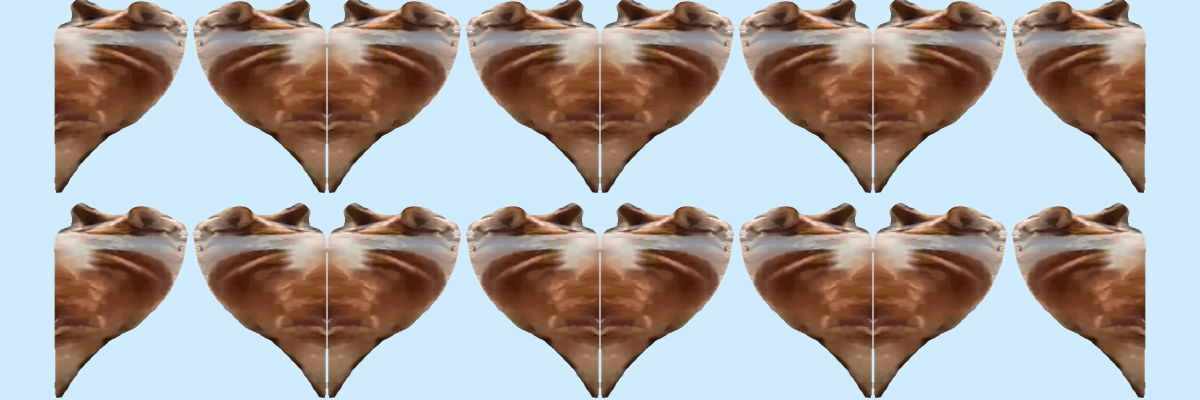
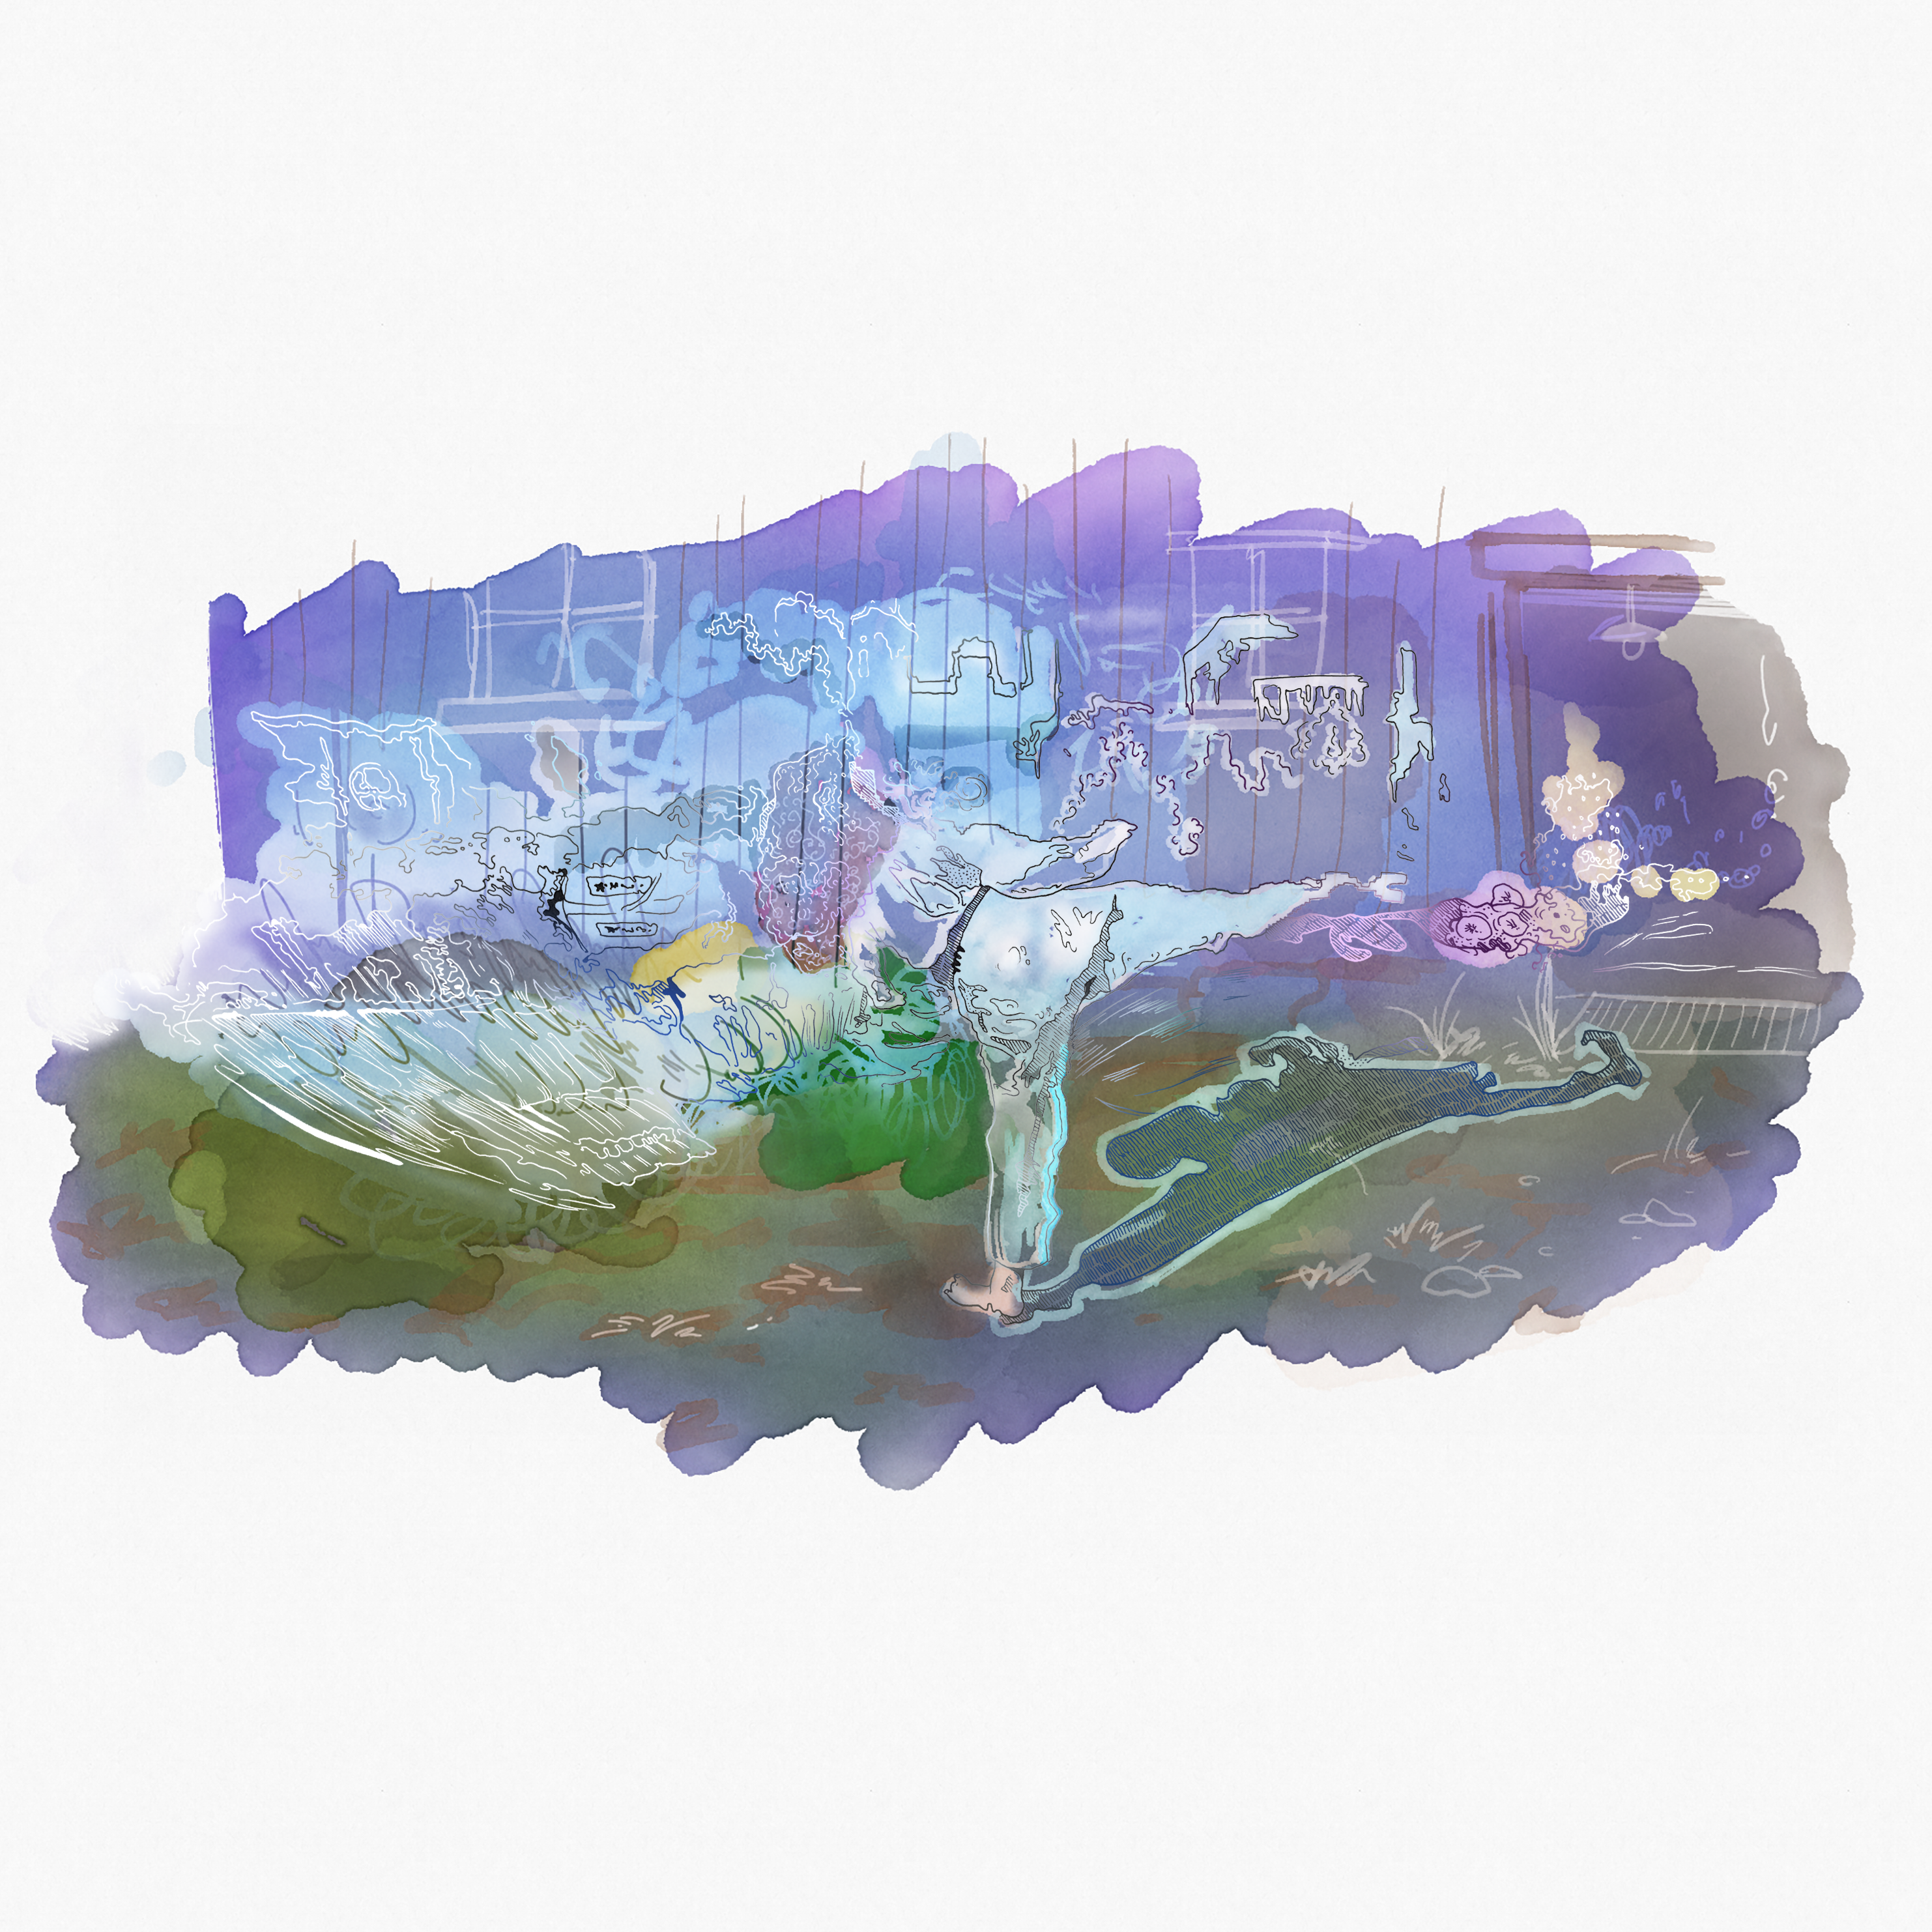
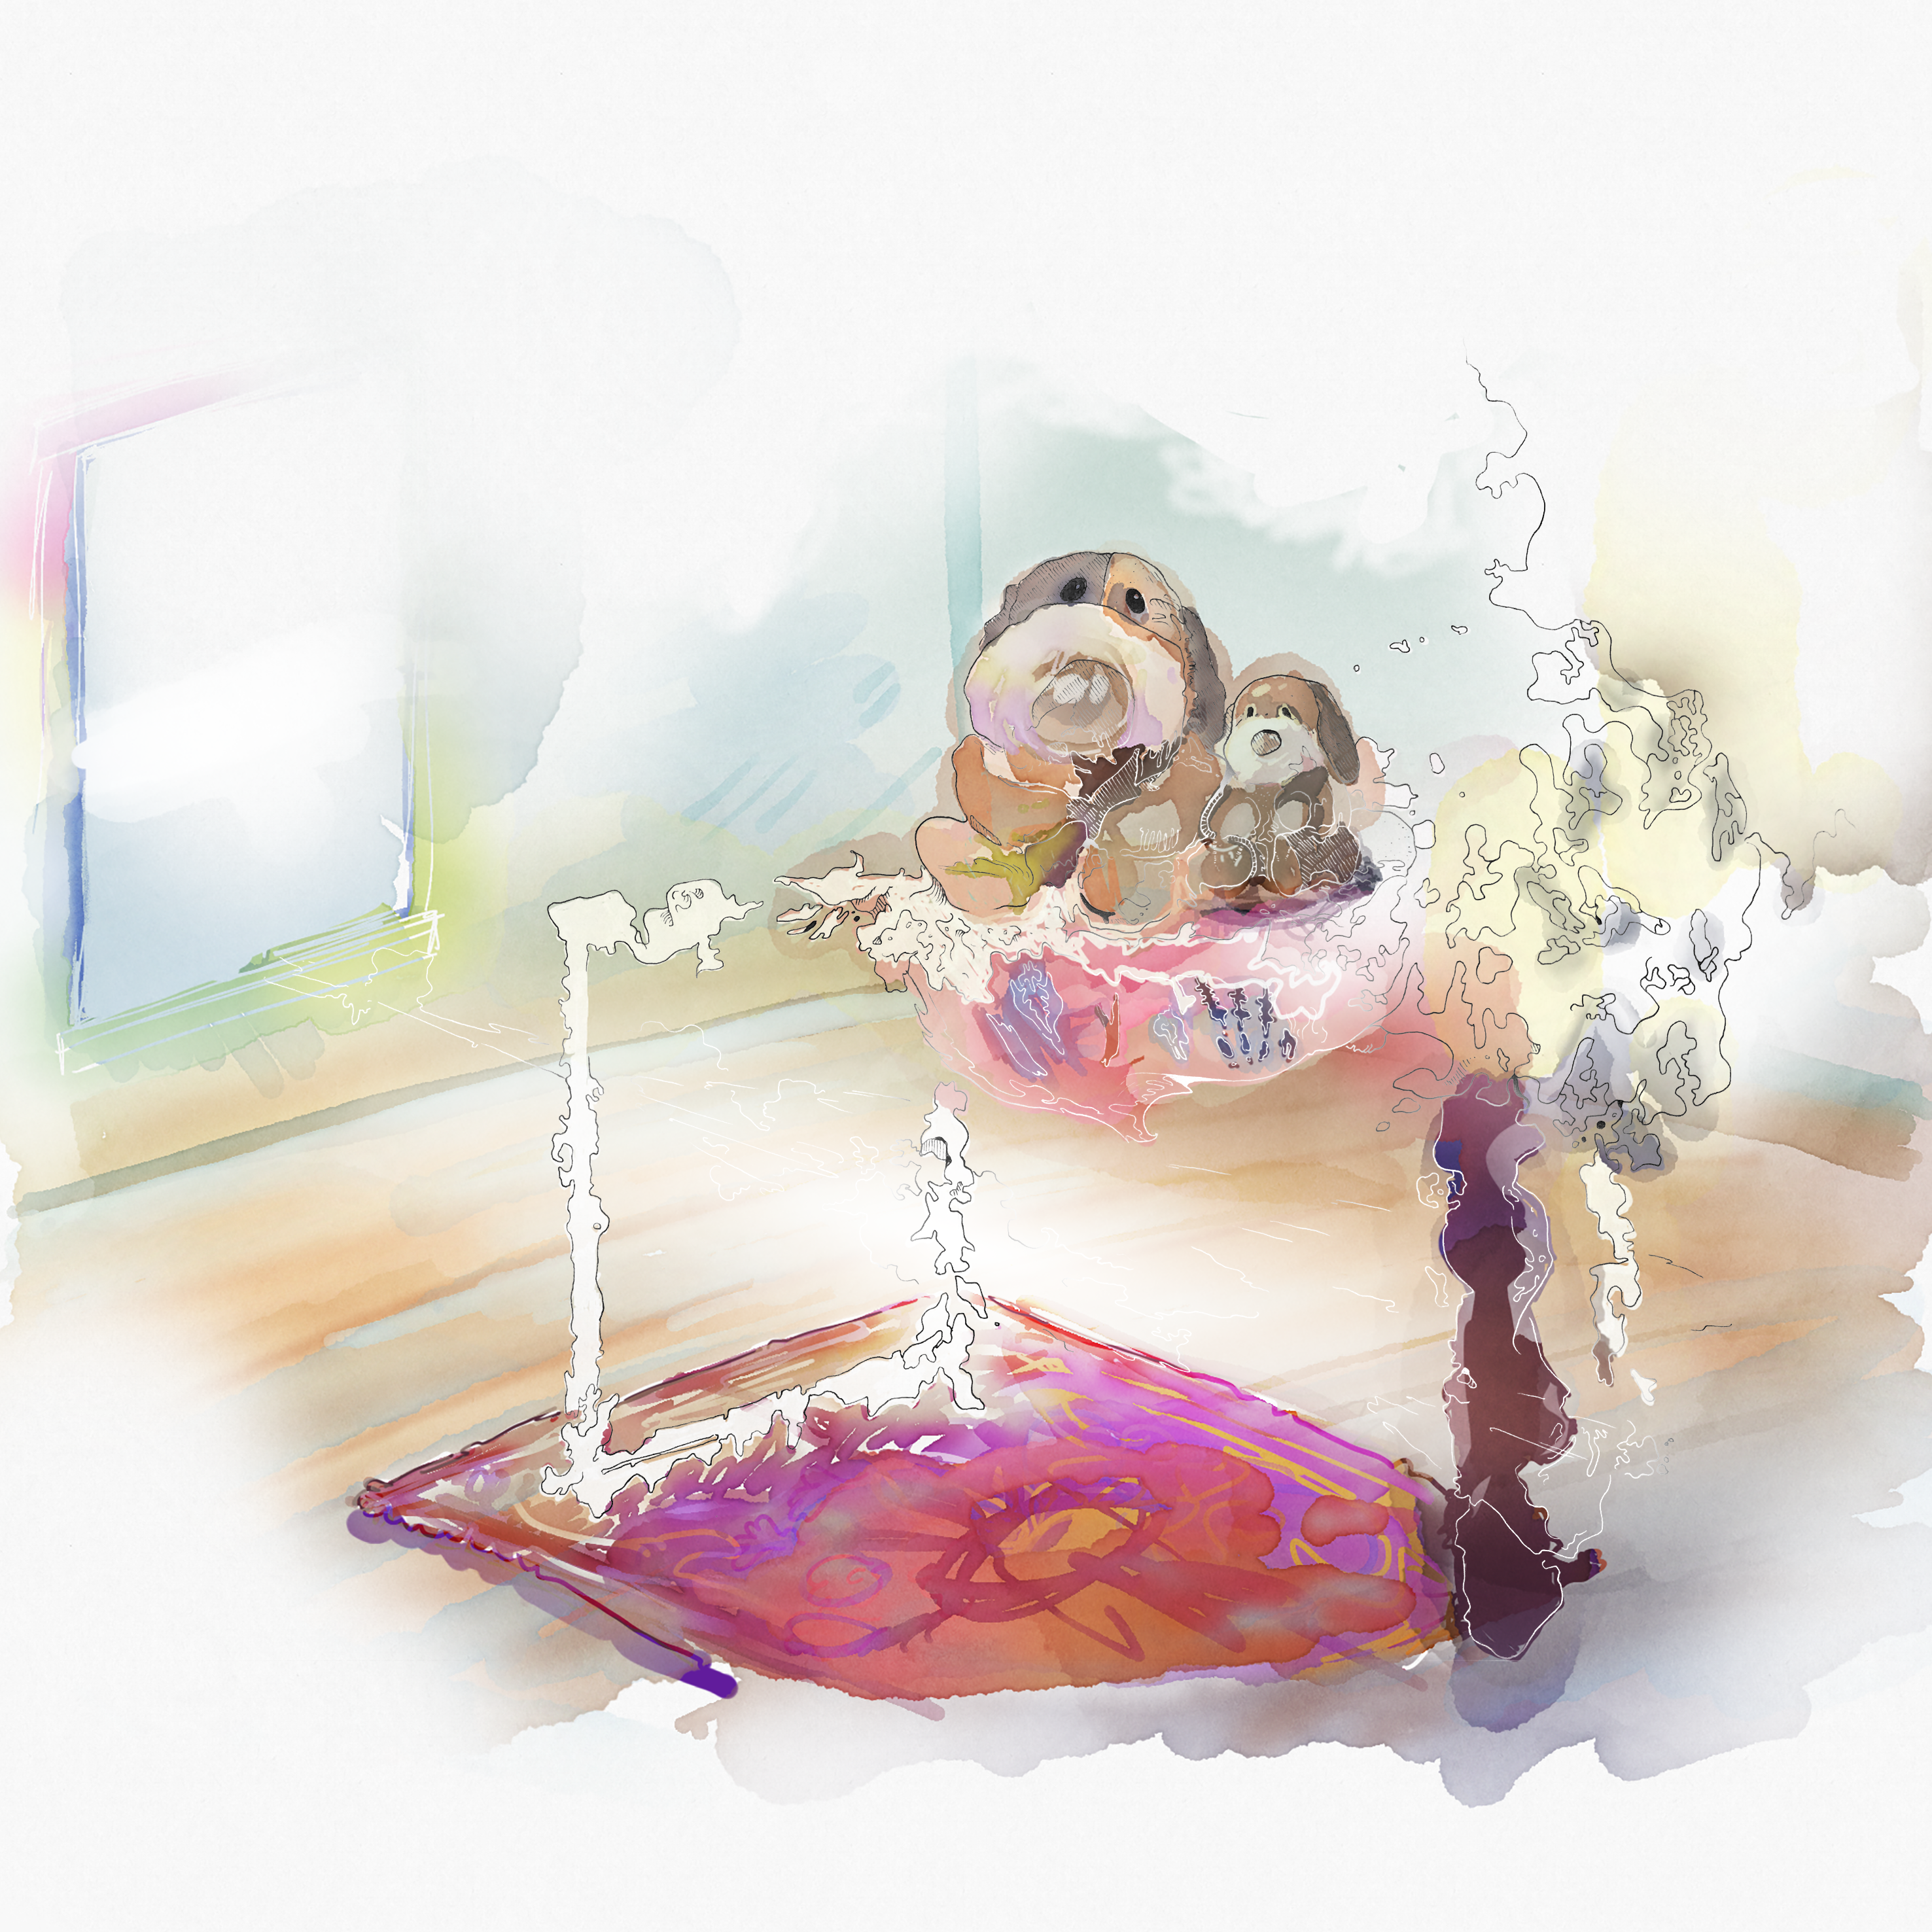
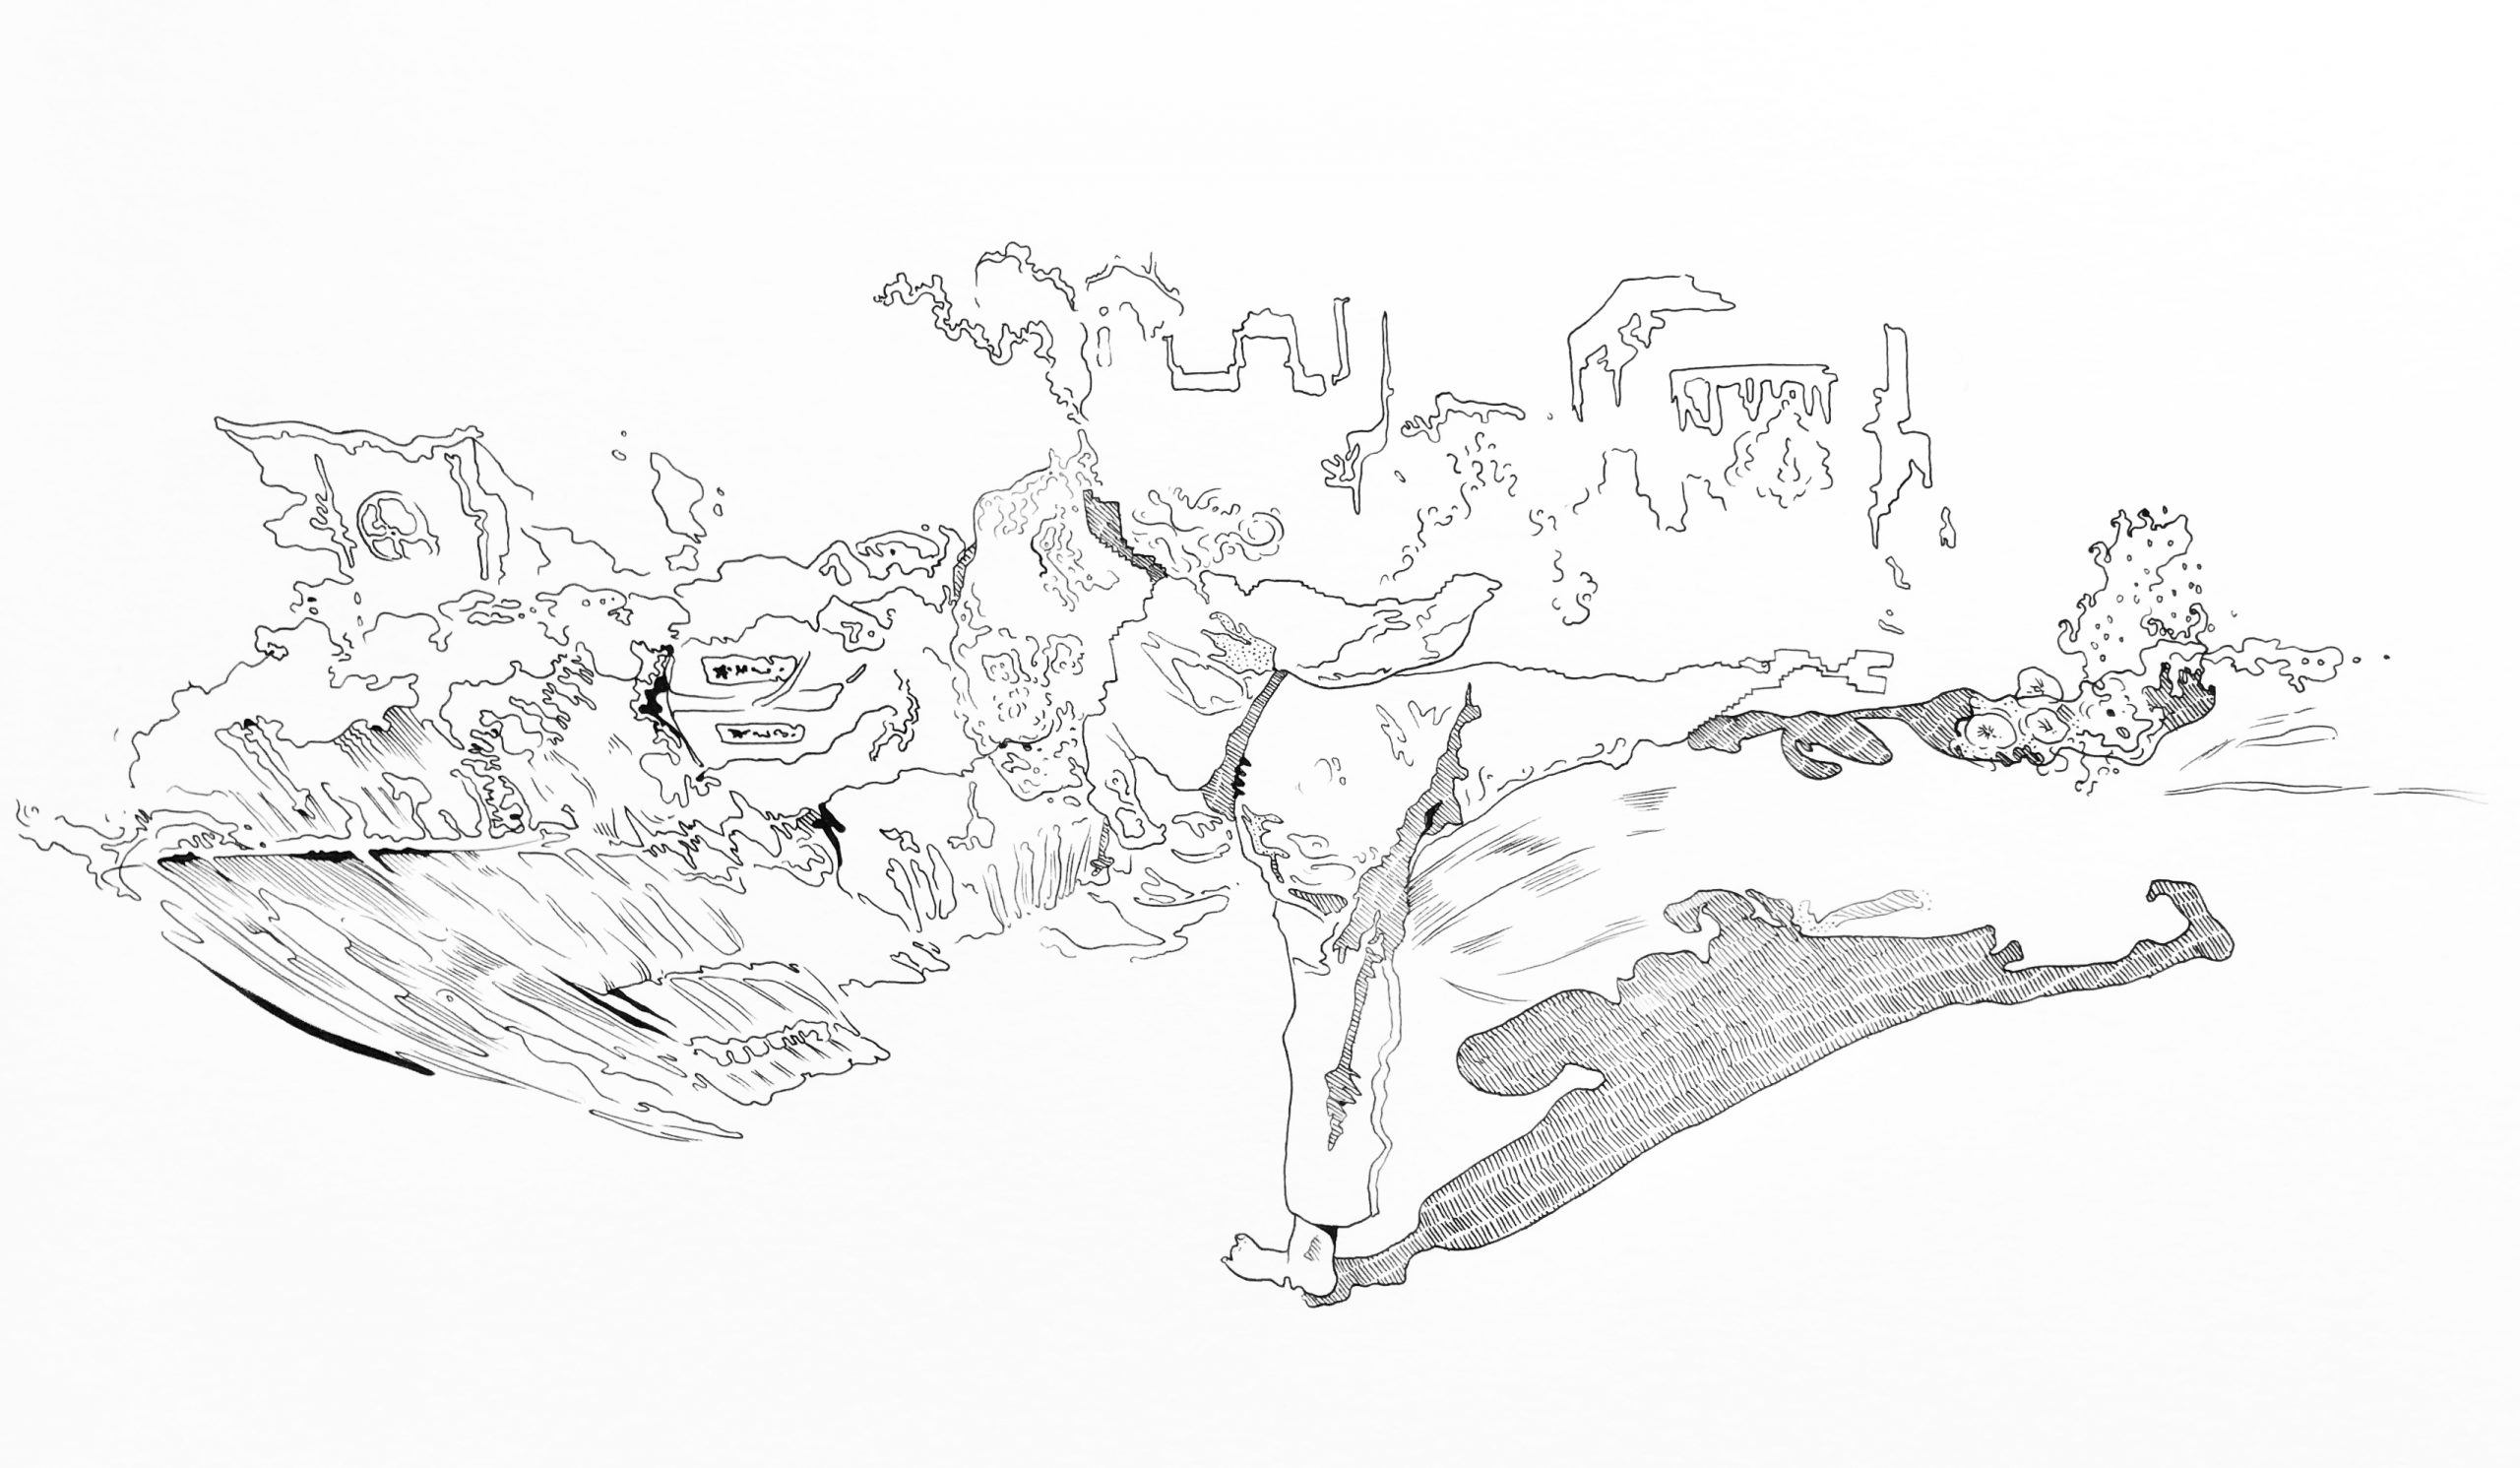
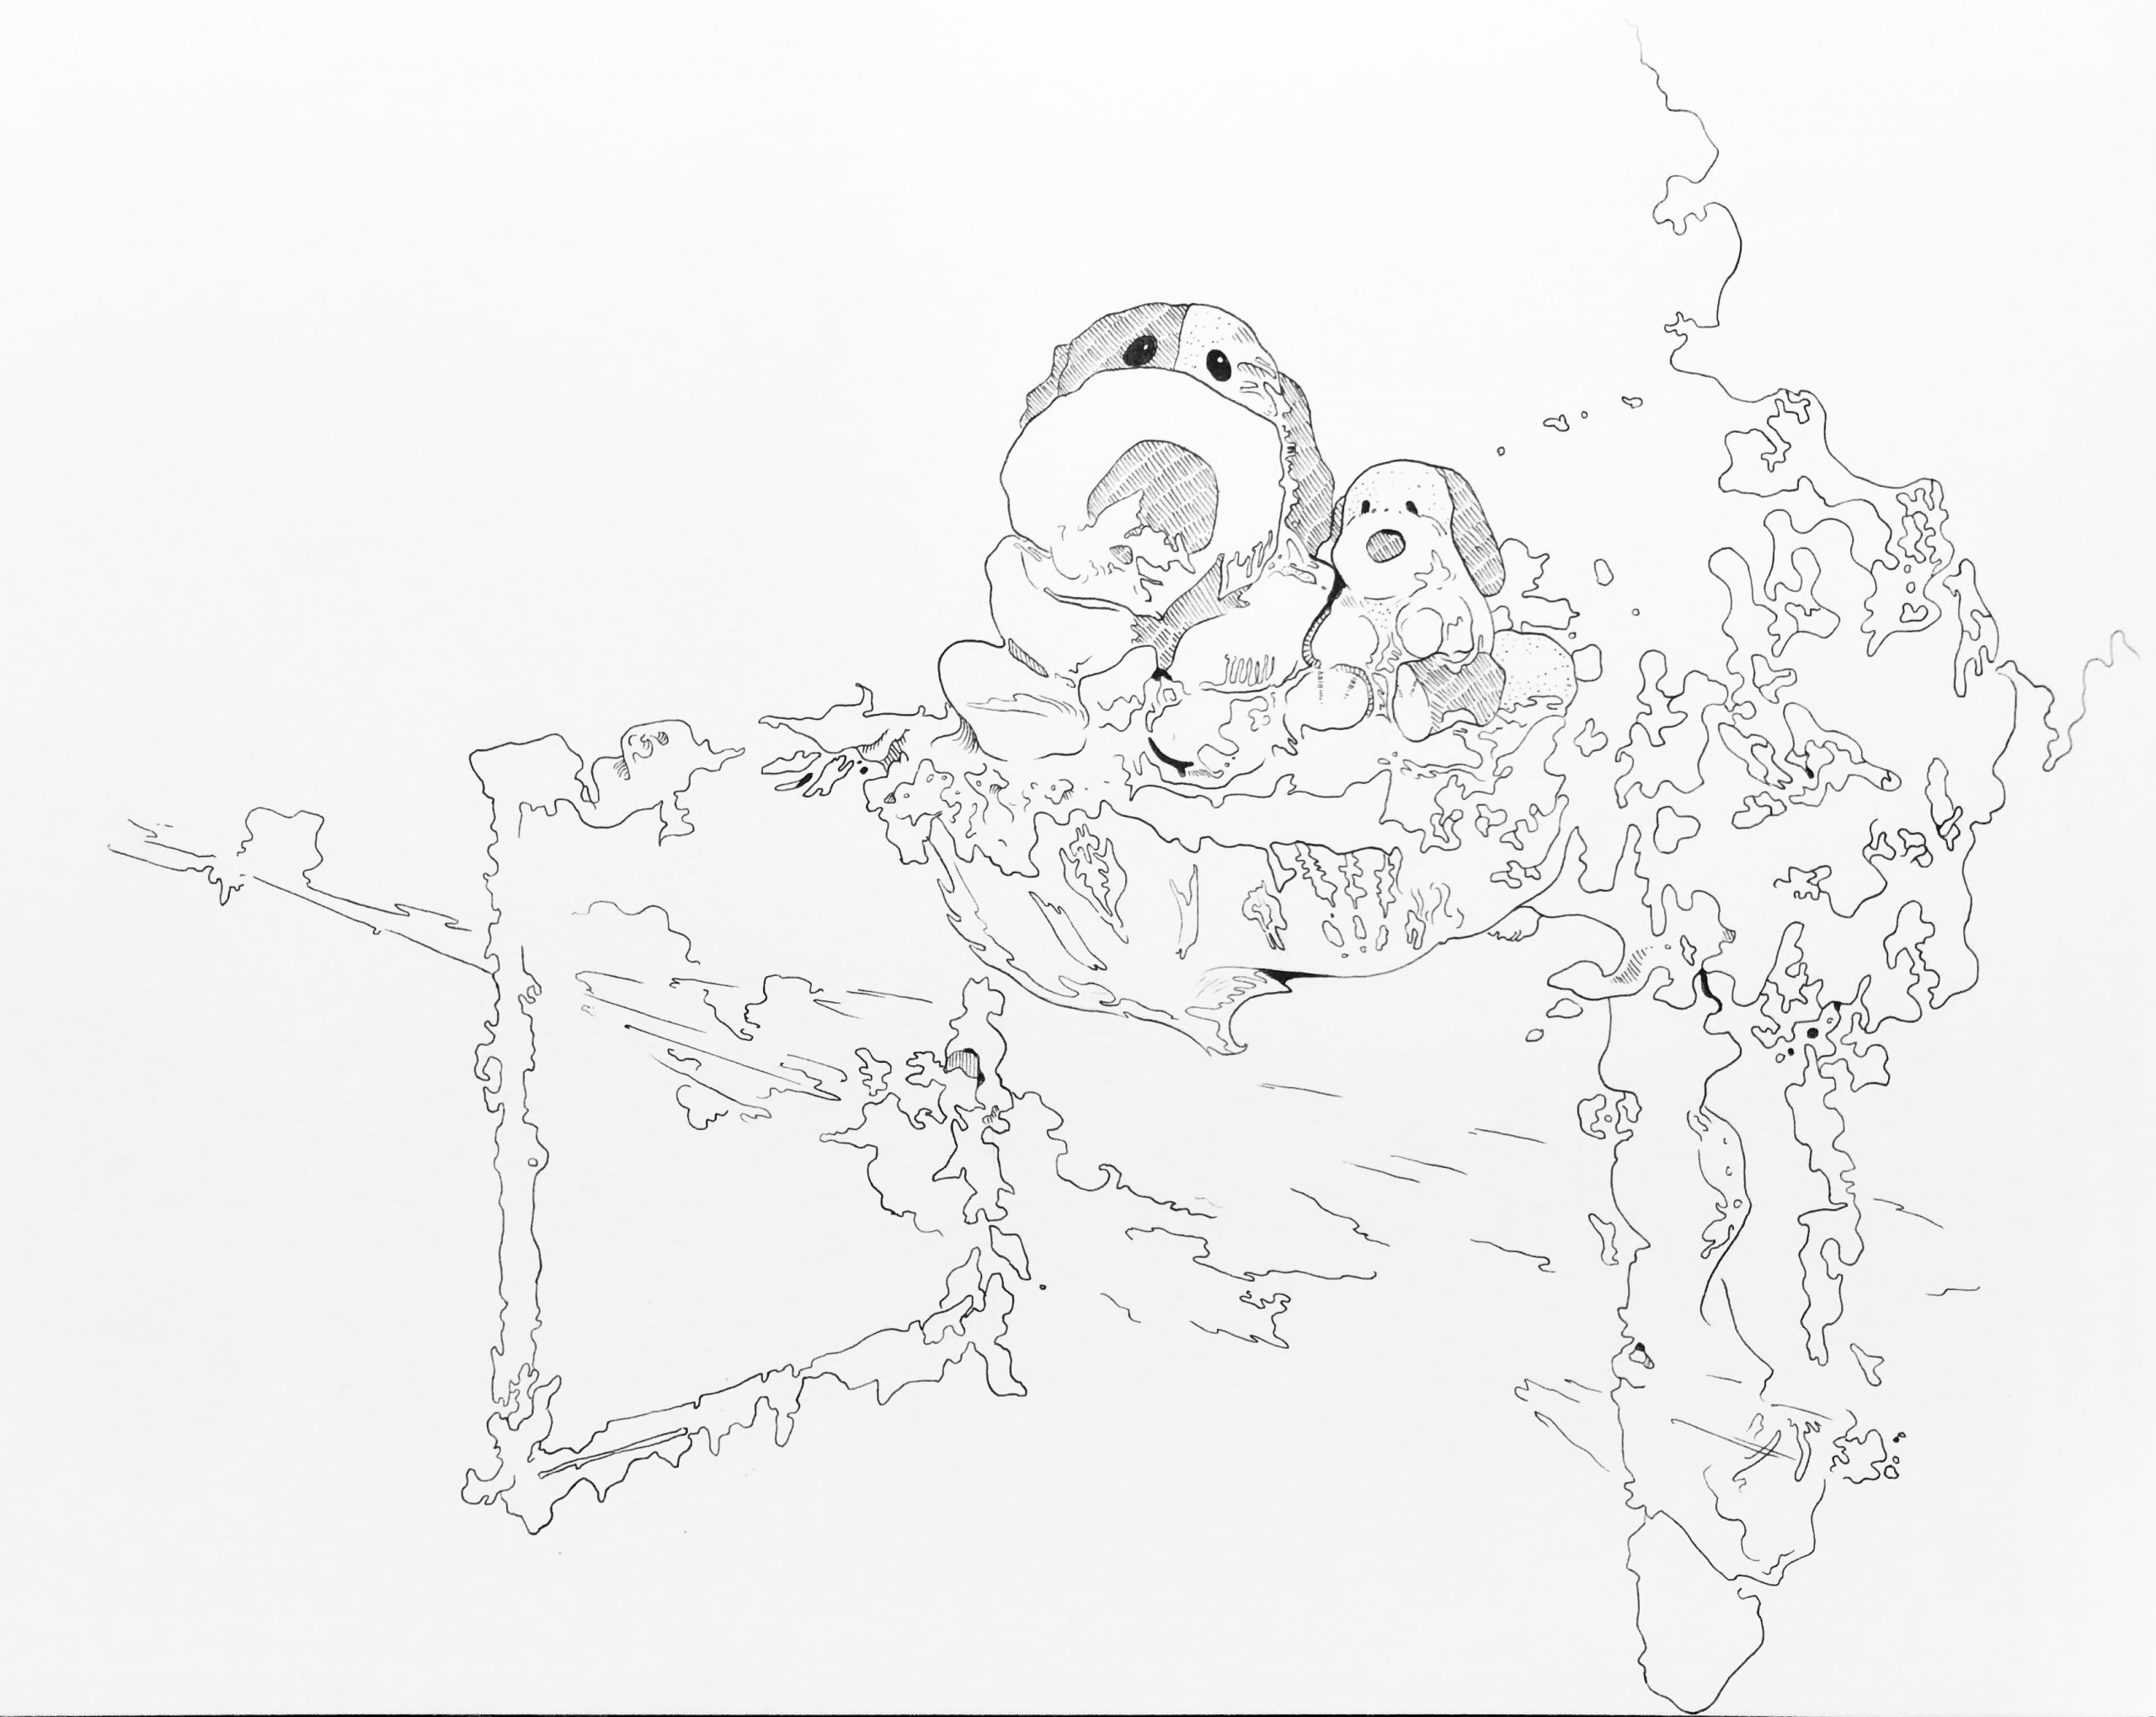
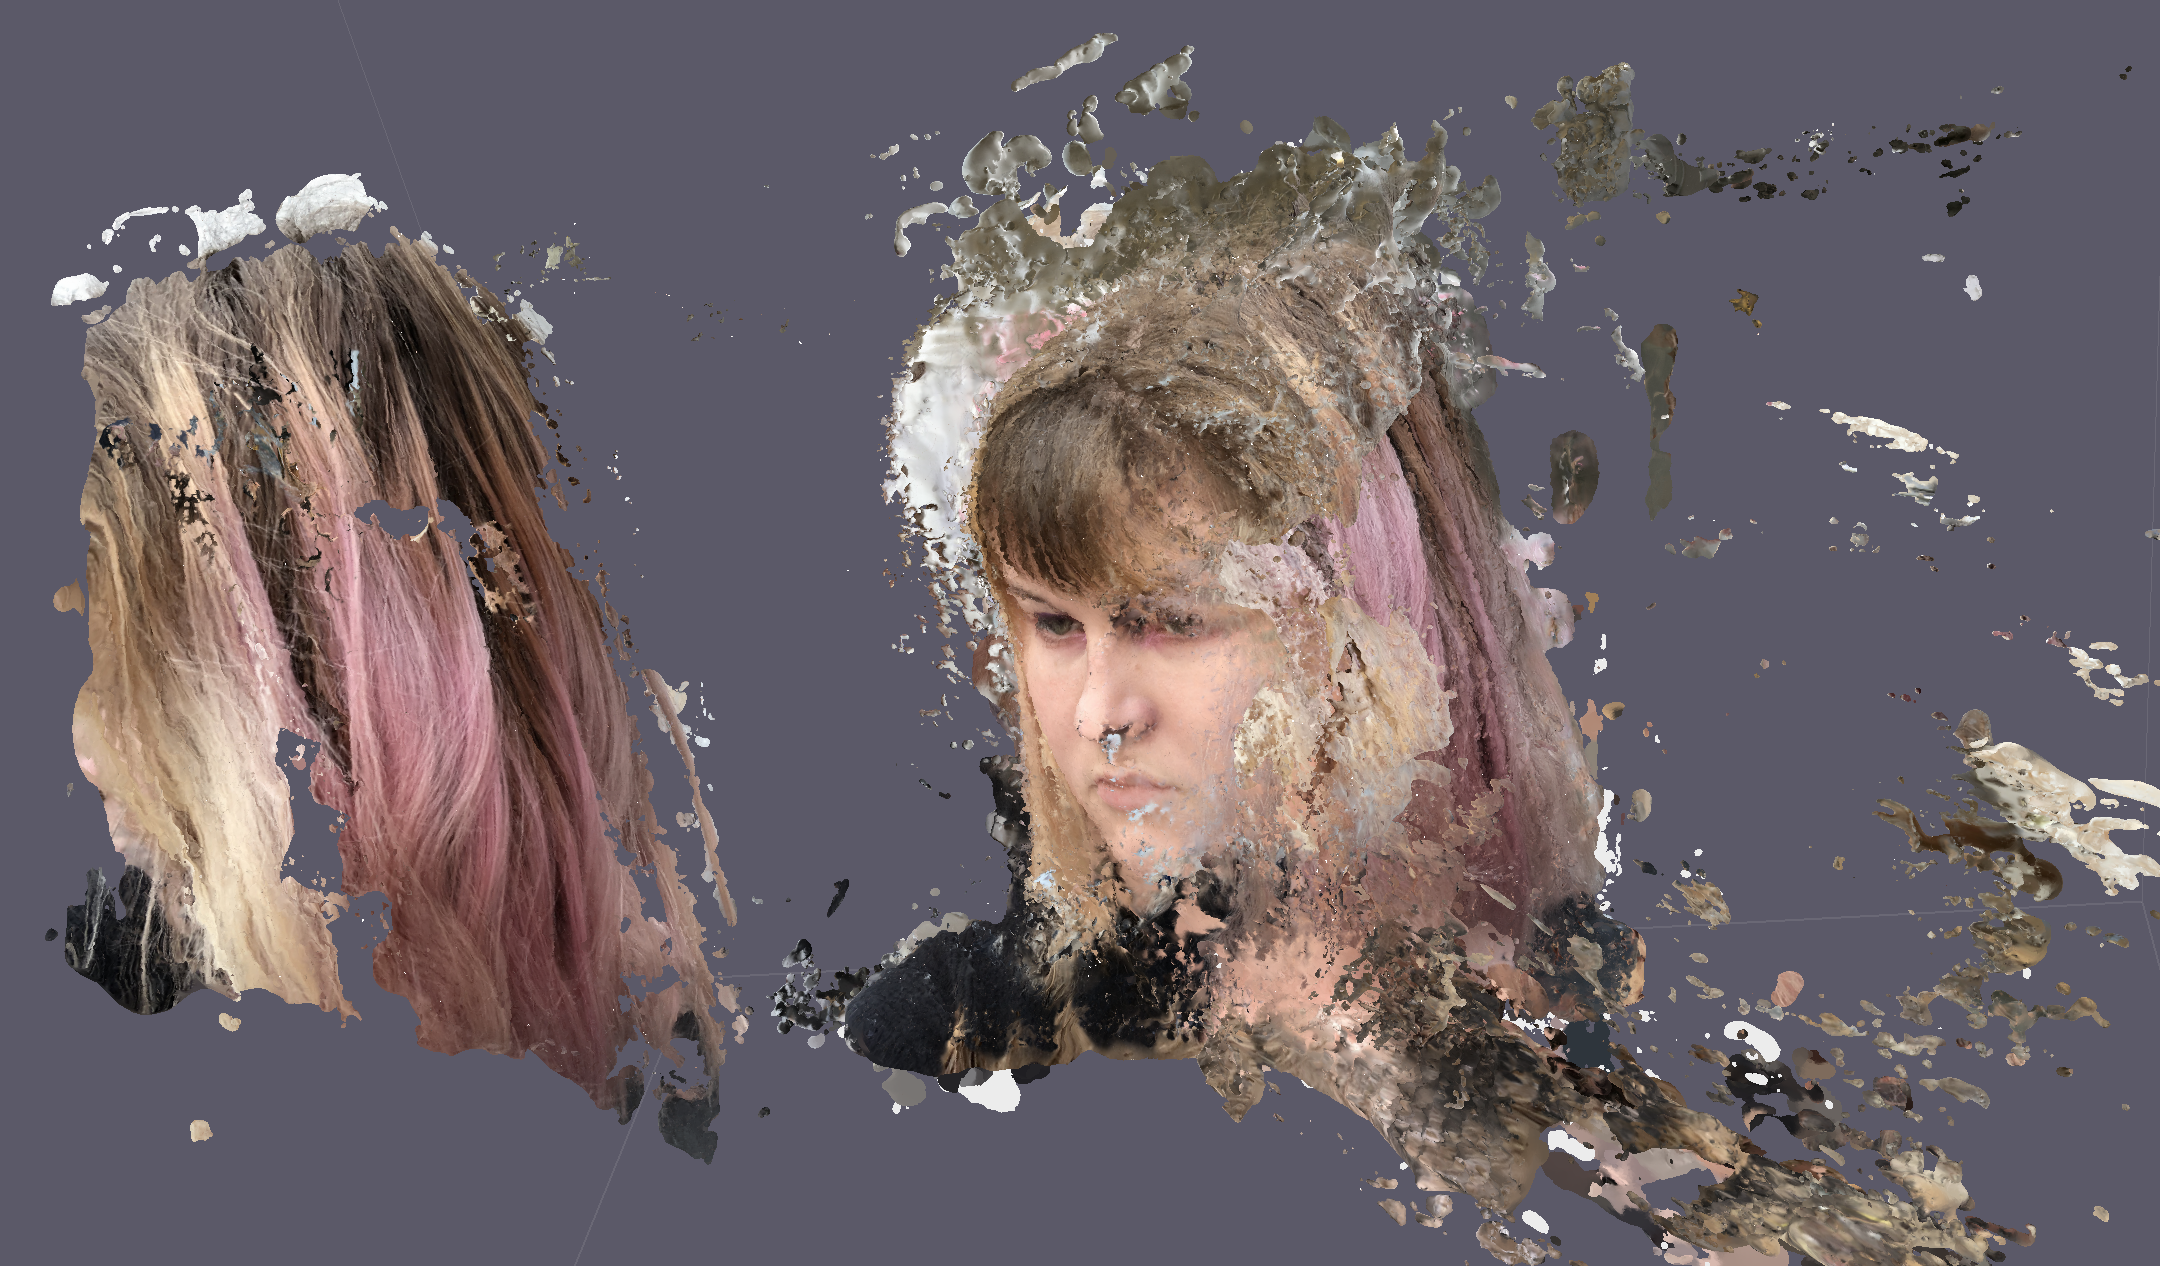
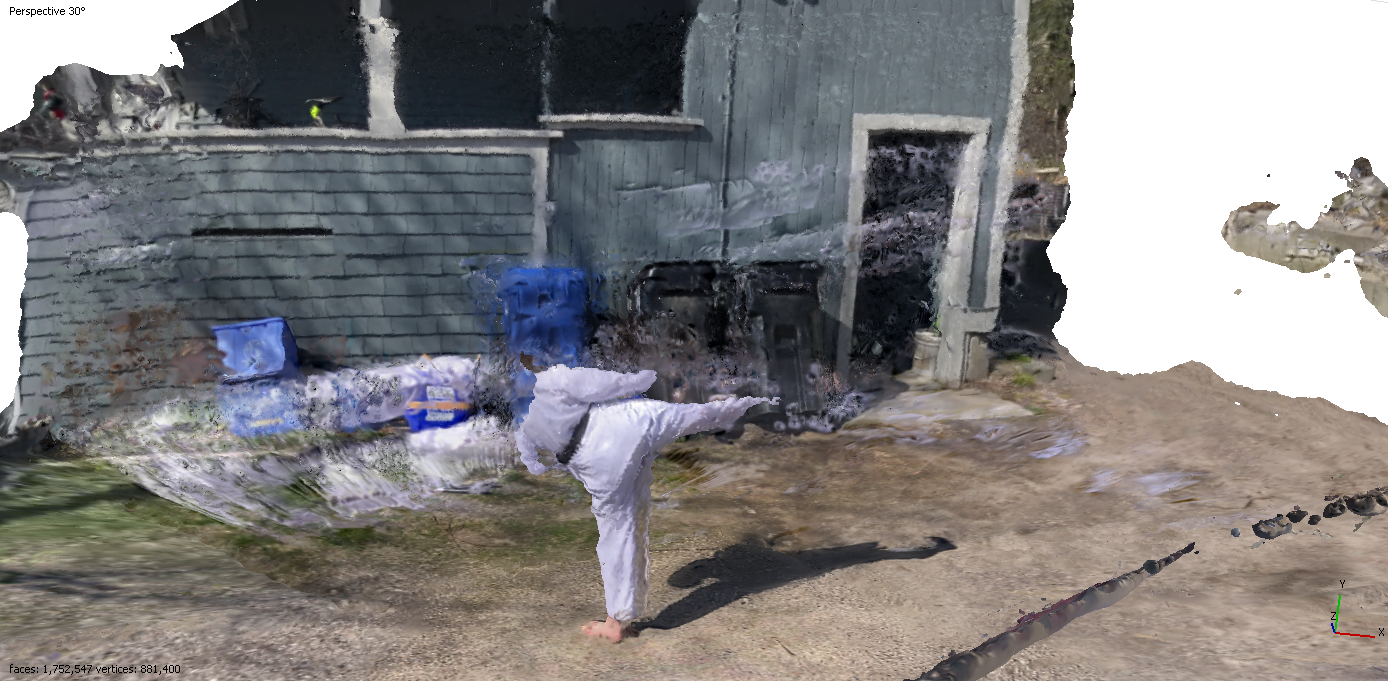
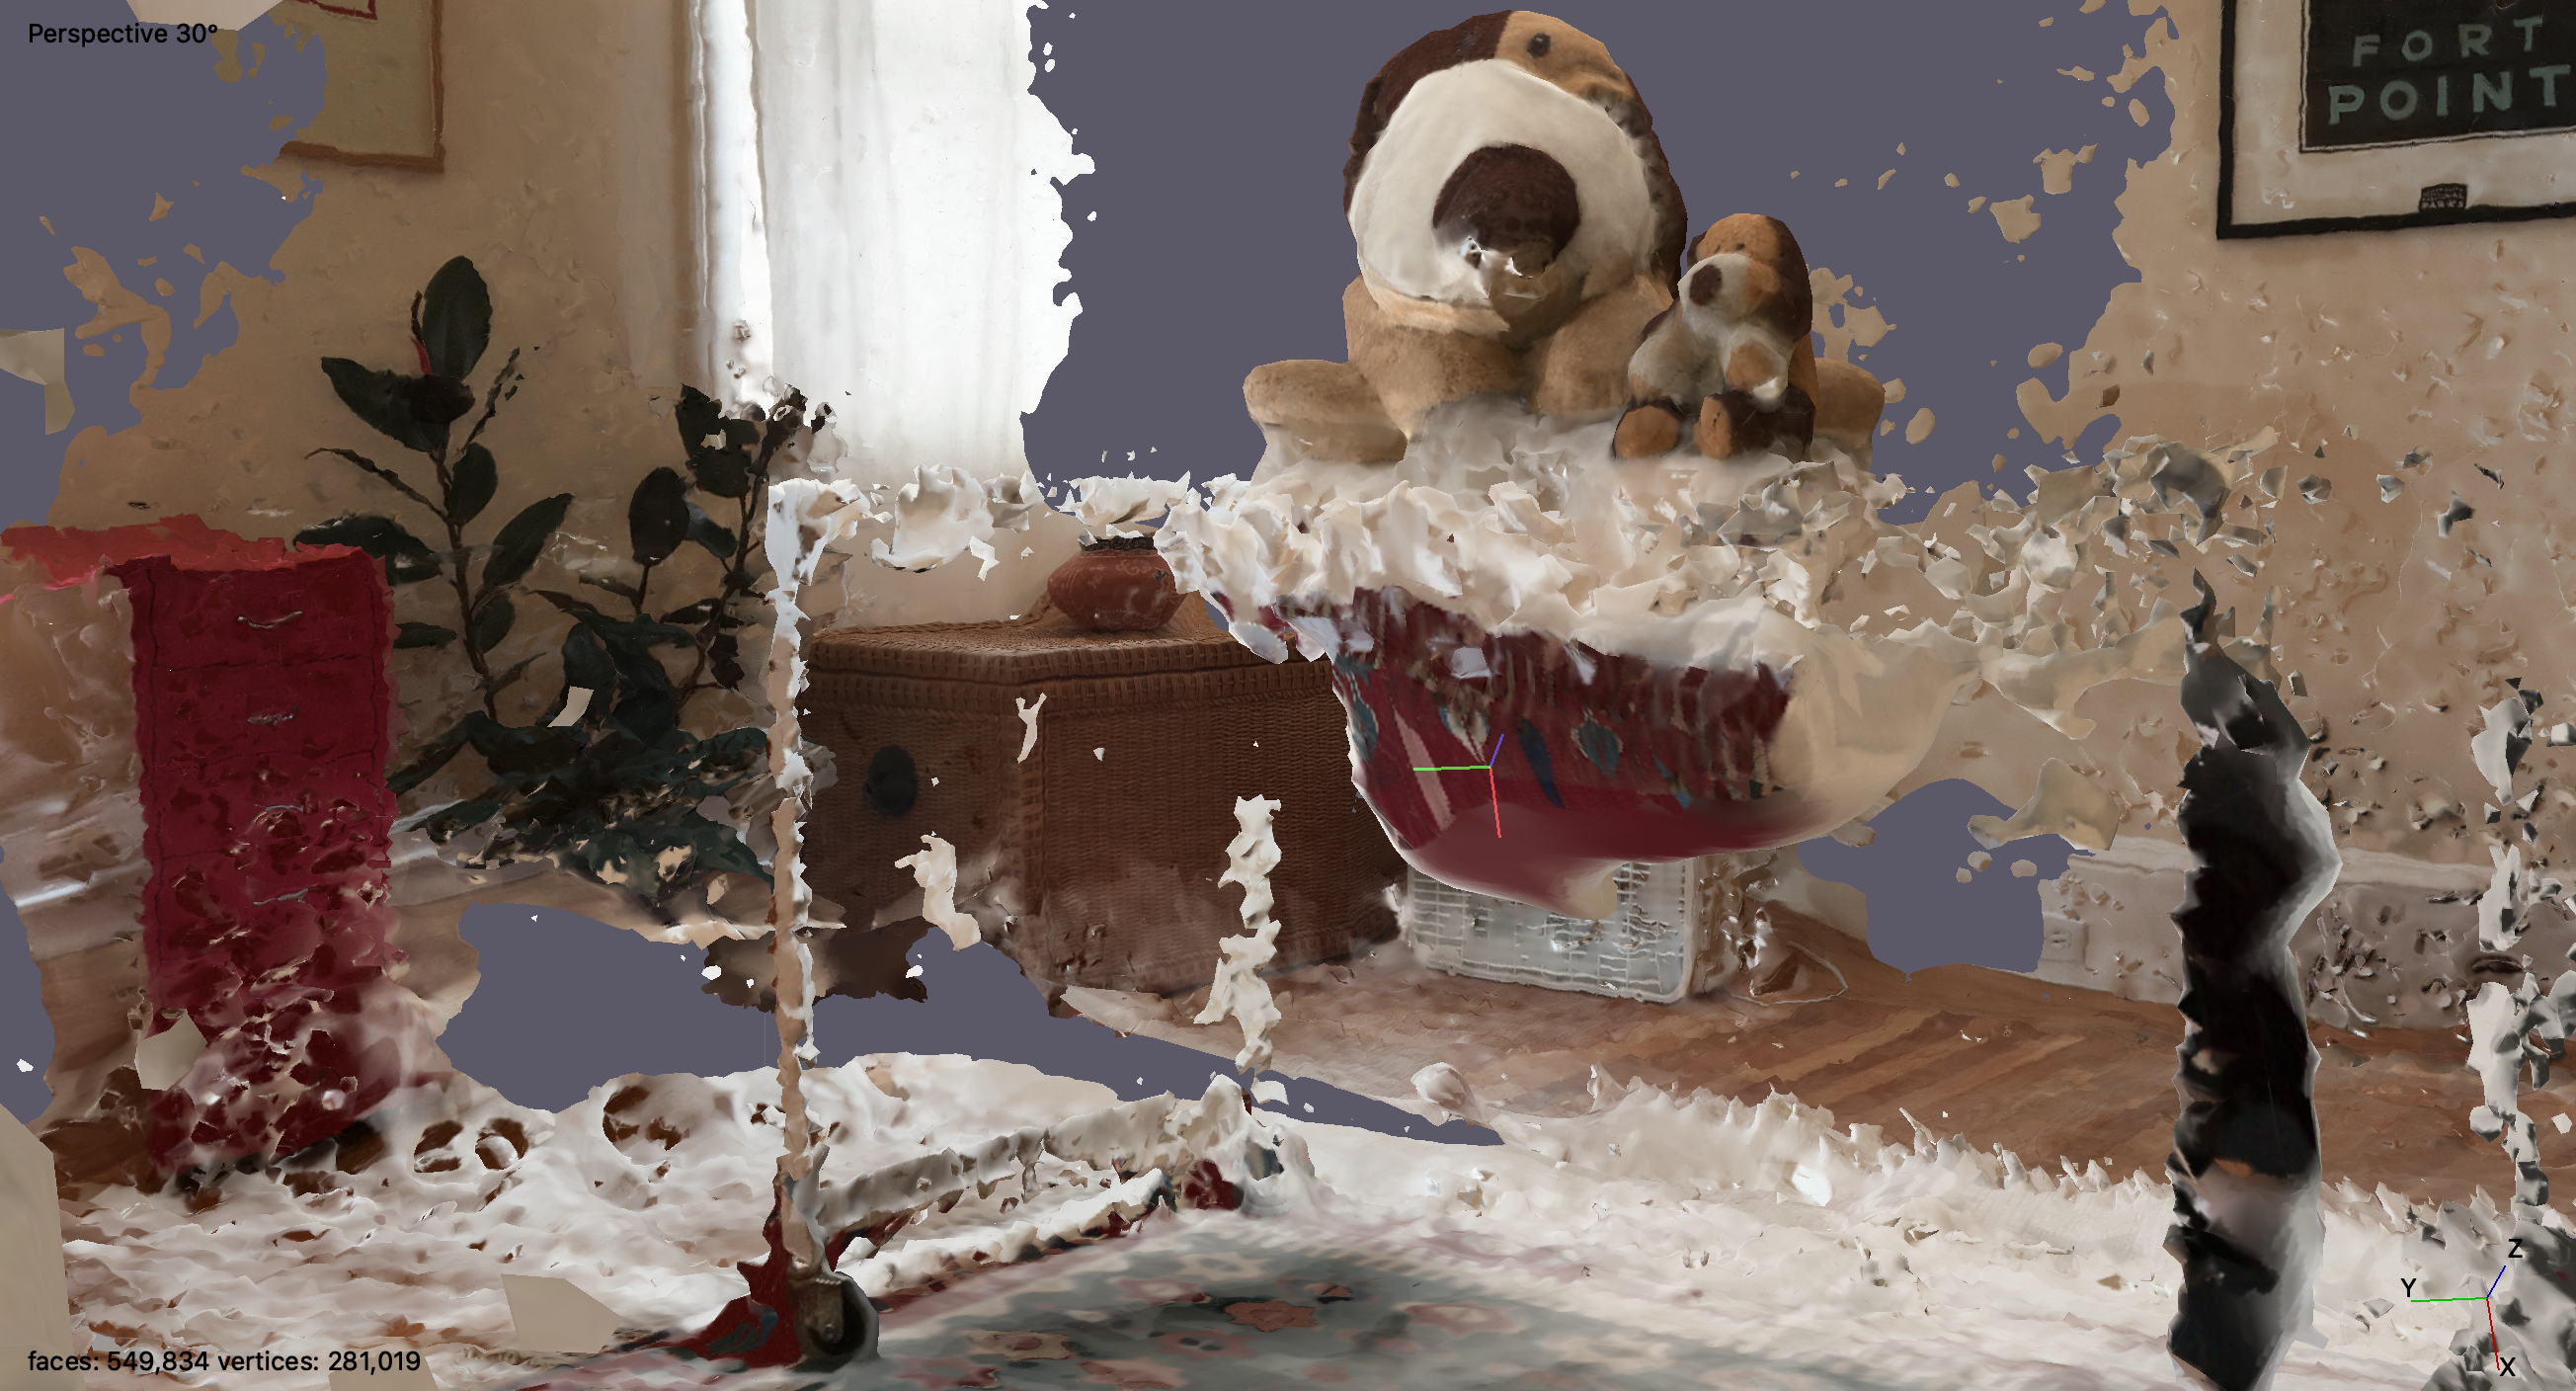
The three subjects I illustrated in this project are intended to represent three facets of emotional connection: the construct of the self (Self Portrait,) relationships and environments (The Late Spring,) and personal/family histories (Light room.) The first is an attempt from back in February to make a 3D model of myself using photogrammetry. Due to my imperfect technique, the model was full of aberrations and my head split into four. The second image documents my attempt to model my housemate striking a Tae Kwon Do form in the backyard of our house in Vermont, a place I never would have stayed for so long if it weren’t for the pandemic. The third shows the favorite stuffed animals of my little brother, who died when I was 9, posed in what used to be his bedroom. The room has since been renewed by years of my other little brother’s life there and neutralized by generic guest room decor once he moved out, but the emotional presence remains. The room is full of bright, reflective surfaces that caused the model to glitch and shafts of light to take physical form.
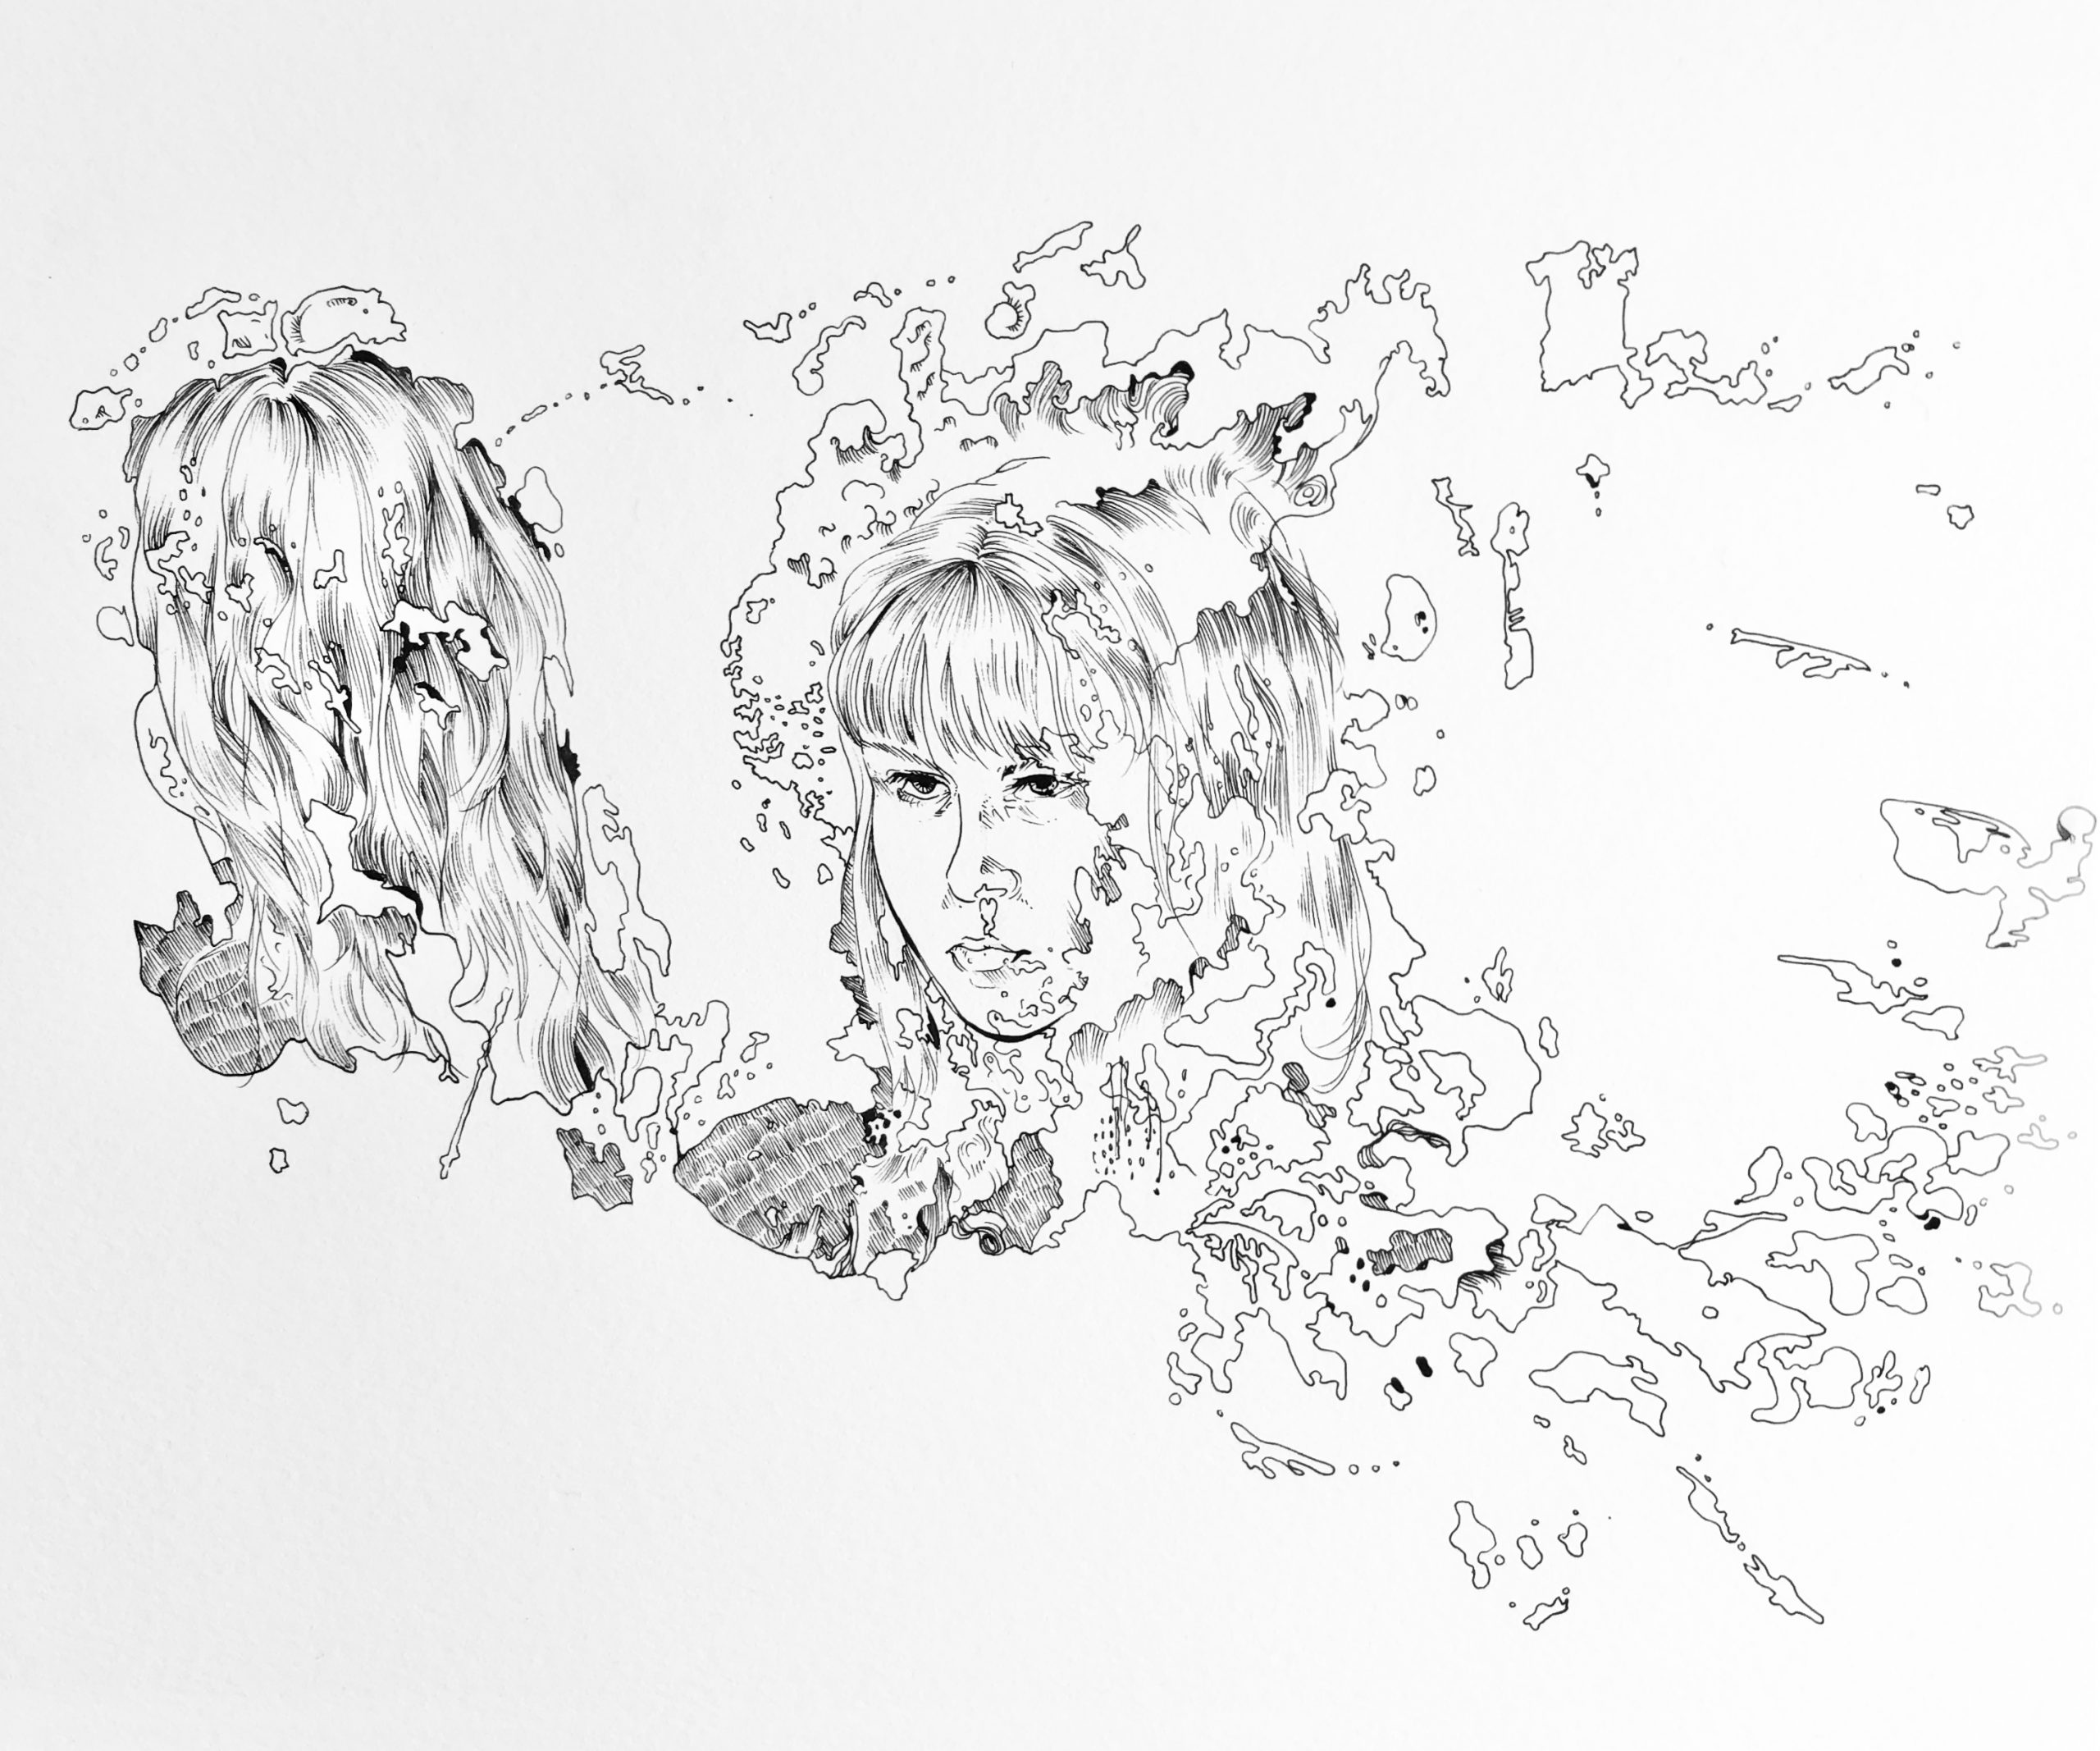
Below, you can see the original, uncolored pen drawings I made from the photogrammetry. Below that are screenshots of the photogrammetry models themselves.
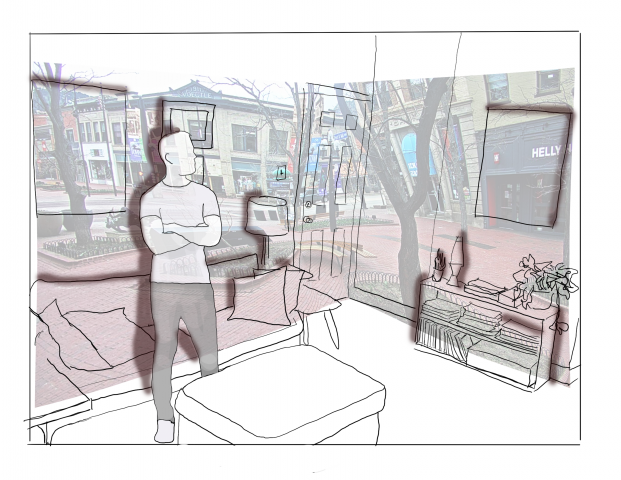
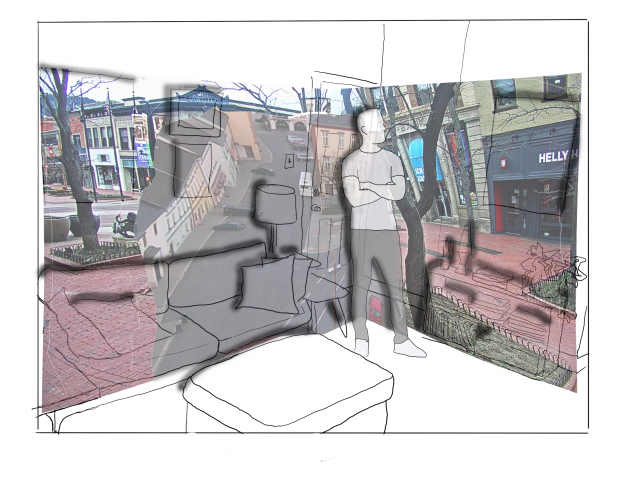
Here & There is small series of scenes depicting domesticity during quarantine. The avatars in the scenes embody the hope, dream, and opportunity of other places, speeding through locales that contrast to the stillness and current constraints of home life.
Using a Kinect Sensor, TouchDesigner (a visual programming language), and access to IP Cams I built a system that transformed a person to become a mediated avatar, that through it’s body displayed other parts of the world.
____________________________________________
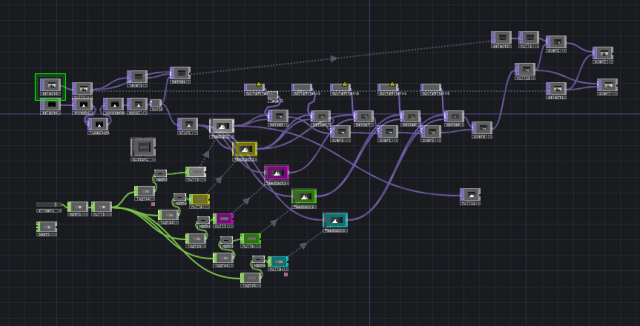
This project has taken a few turns – I originally pitched a sort of digital camera obscura effect that would use the motions of my body in my space to digitally reveal other places; think body paintbrush. What I attempted to build was a system that would use layers of feedback on top of itself while still clearly being able to see each layer. I had hoped the use of a projector would aide in the layering effect allowing most of the visual content to conform to the geometry of my room. Unfortunately TouchDesigner does not support projector output on the free license.
Original Pitch fig.1Original Pitch fig.2
feedback testingfeedback layer testingA very complicated network
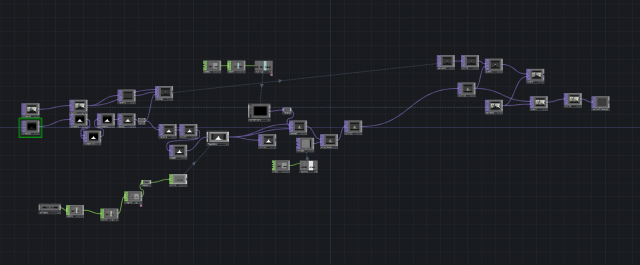
The next iteration was to focus more on the computer vision aspect of the piece and implement hand tracking that I would be able to paint objects surfaces in my room that would reveal portals to other places. The triggering and isolation specific content proved difficult, was working on gesture recognition in TD that would trigger the effect on whether my hand was open or closed. I am confident with more time and development I still could realize this system.
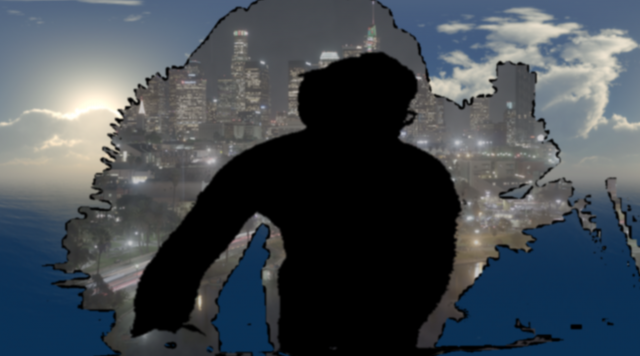
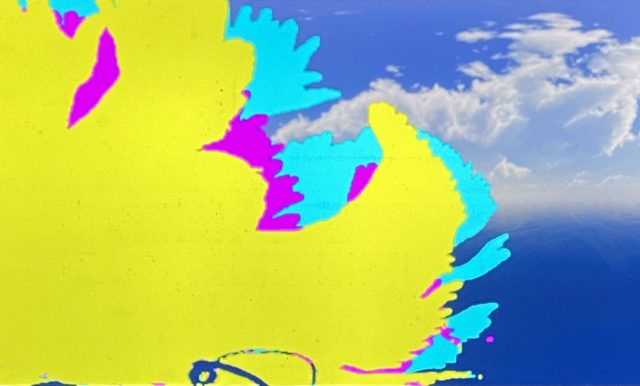
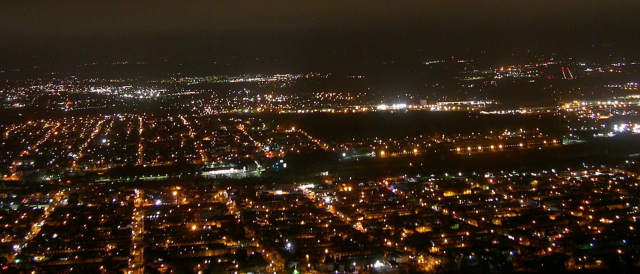
This led to the current incarnation that flipped the layers. Instead of layering behind my body I opted to cover my body entirely rendering myself something entirely mediated.
Final iteration of networkScreenshot of IP CamScreenshot of IP Cam
Further work on this project would expand the series to stage more scenes, as well develop a more fool proof overlay of the body and limit artifact.
This project was the first time I worked with the Kinect sensor and much of the R&D was seeing what could be accomplished in TD and how best to maniuplate the sensor data. There are countless of things to explore with it and Im excited to see what else I can build with it and continue to build off this project.
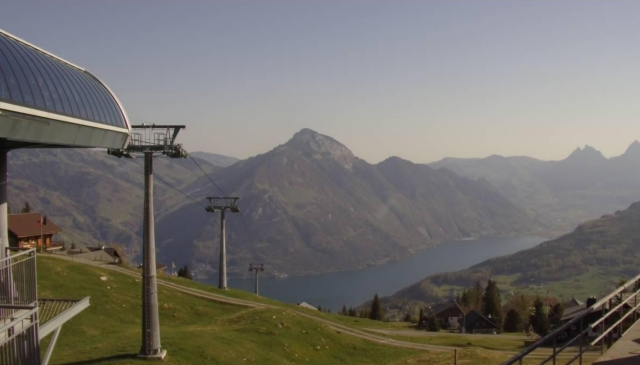
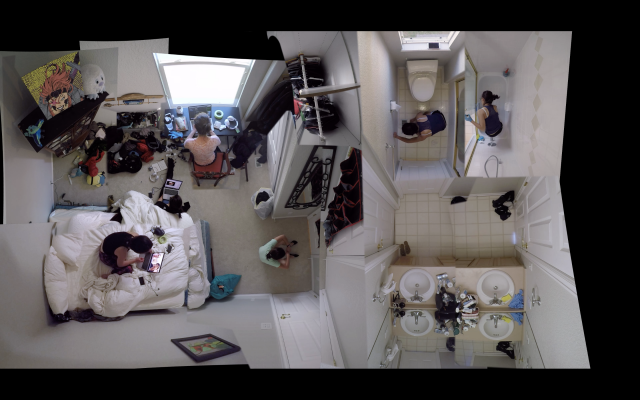
Time in Quarantine spend in two save havens, one at school in Pittsburgh then a move to Denver.
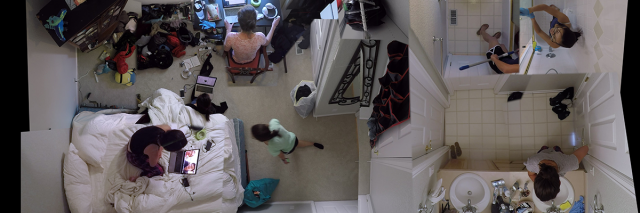
Room in Time: Denver
Room in Time: Pittsburgh
During the beginning of quarantine, I was confined to one room, my dorm room. During this time, I documented my movements around the room for days and complied them into a single time-lapse video. I could be seen working, frantically packing, eating, watching movies, and zooming. Then after a few weeks I had to move to Denver where I am currently staying with my boyfriend and his family. Here I was able to roam in a house with a backyard, multiple room, and different floor levels. However, even though I had more space I was still more or less confines to a single room to do my living. Everything was clean and neatly arranged with not a single candle or book out of place. I felt that my room was the only place where I could live in the house without anxiety of messiness. I did the same type of video in Pittsburgh except this time in Denver. I feel what is most interesting is my restricted movements in Denver, I’m no longer flying everywhere around the room, but I’m seated in only a few places and found to be cleaning the bathroom rather than making a mess. I also think that the colors in the Denver time-lapse compared to Pittsburgh also adds to the feeling of restriction and more confinement.
DOCUMENTATION:
Putting Up the Camera:
Unlike the the dorm room in Pittsburgh this time I had access to a GoPro! I was able to tape the GoPro to the camera using painters tape.
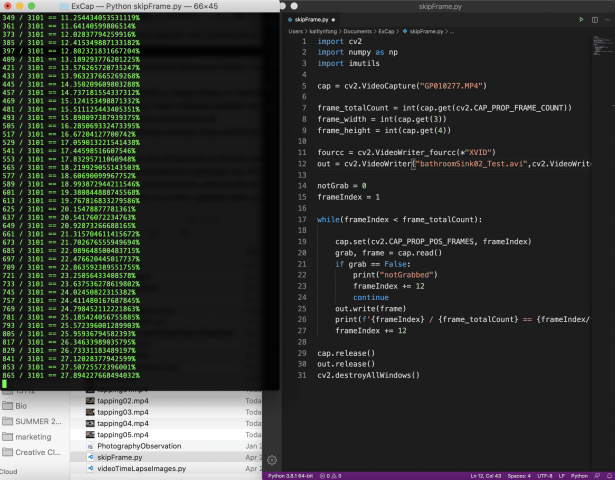
In order to match the type of style of the previous video I wanted to make the footage into a time-lapse foot by keeping only the 24th frame. I creates a small code using python OpenCV to go through the GoPro footage.
Deleting Frames:
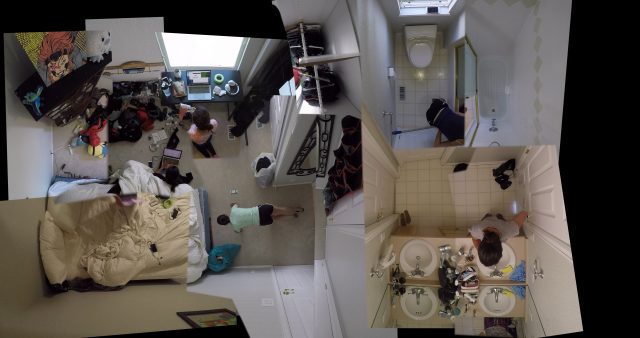
Once I got all the footage cut I was able to create a 4k video using a compilation of several 1080 videos. This proved to be extremely difficult for my laptop but with lots of patience we both got through it. Unlike the Doom time-lapse I took careful efforts to make the different video seem together a bit better.
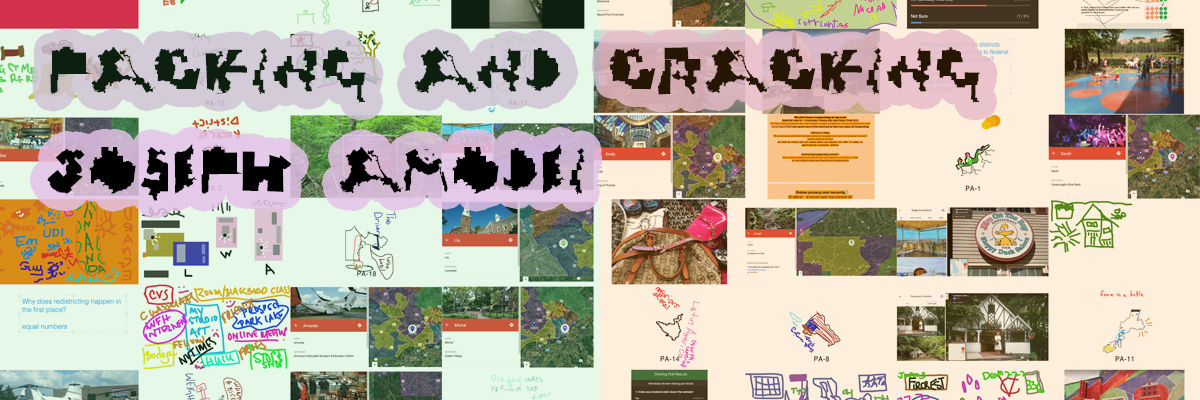
Packing and Cracking is a interactive mapmaking event (now online!) about gerrymandering: the pervasive practice of politicians choosing their voters rather than the other way around.
Project Description, Process, and Reflection:
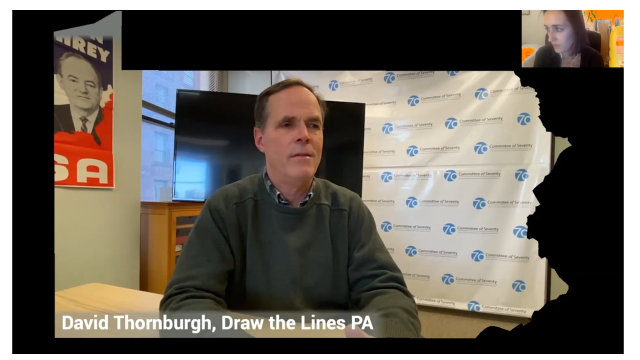
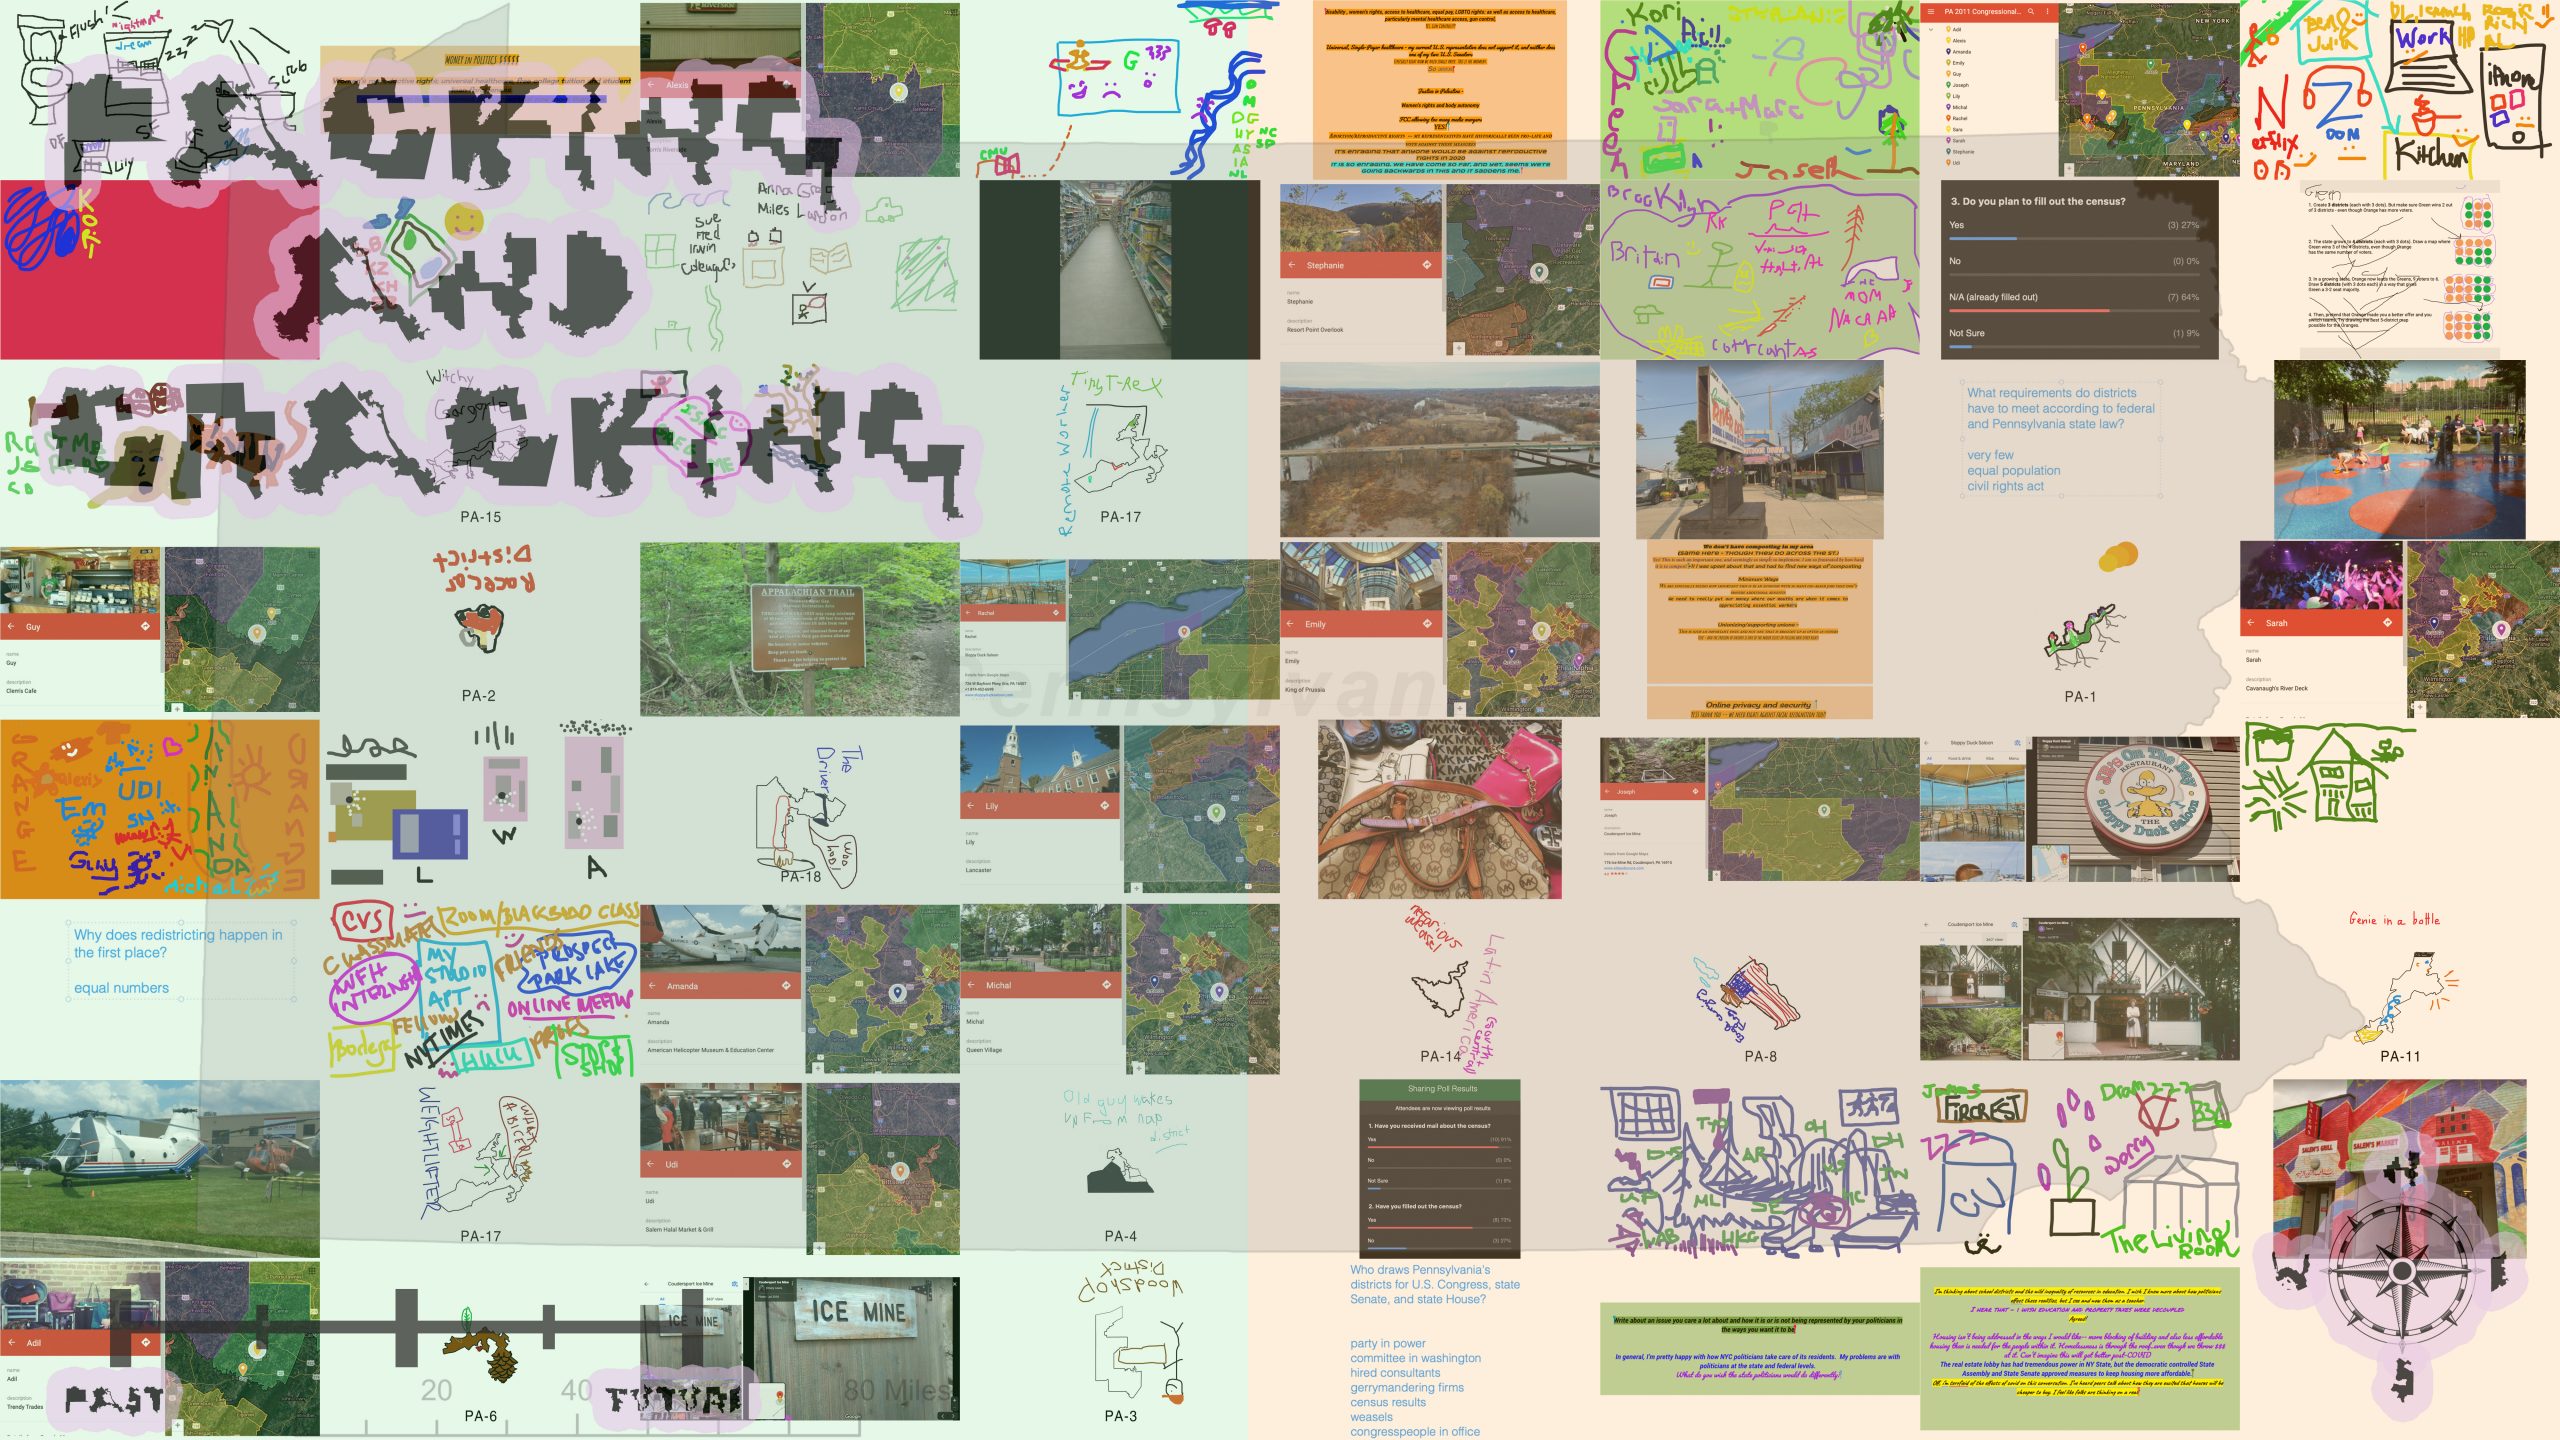
Do we choose our politicians, or do our politicians choose us? Packing and Cracking is an interactive mapmaking event (now online!) about gerrymandering: the pervasive practice of politicians choosing their voters rather than the other way around. Through participatory drawing and map-drawing games, Packing and Cracking uses critical cartography, historical accounts of the first gerrymanders, and interviews with people dealing with gerrymandering today to show how easy and disenfranchising gerrymandering can be and ask what, if anything, we should do about it.
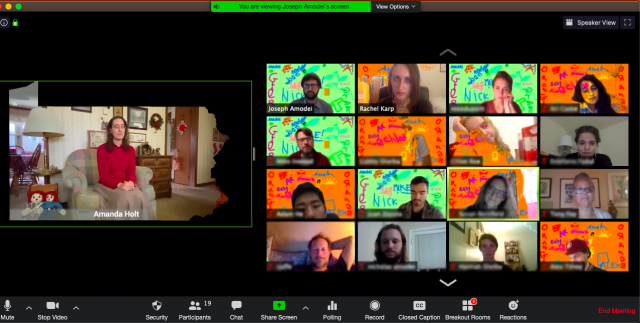
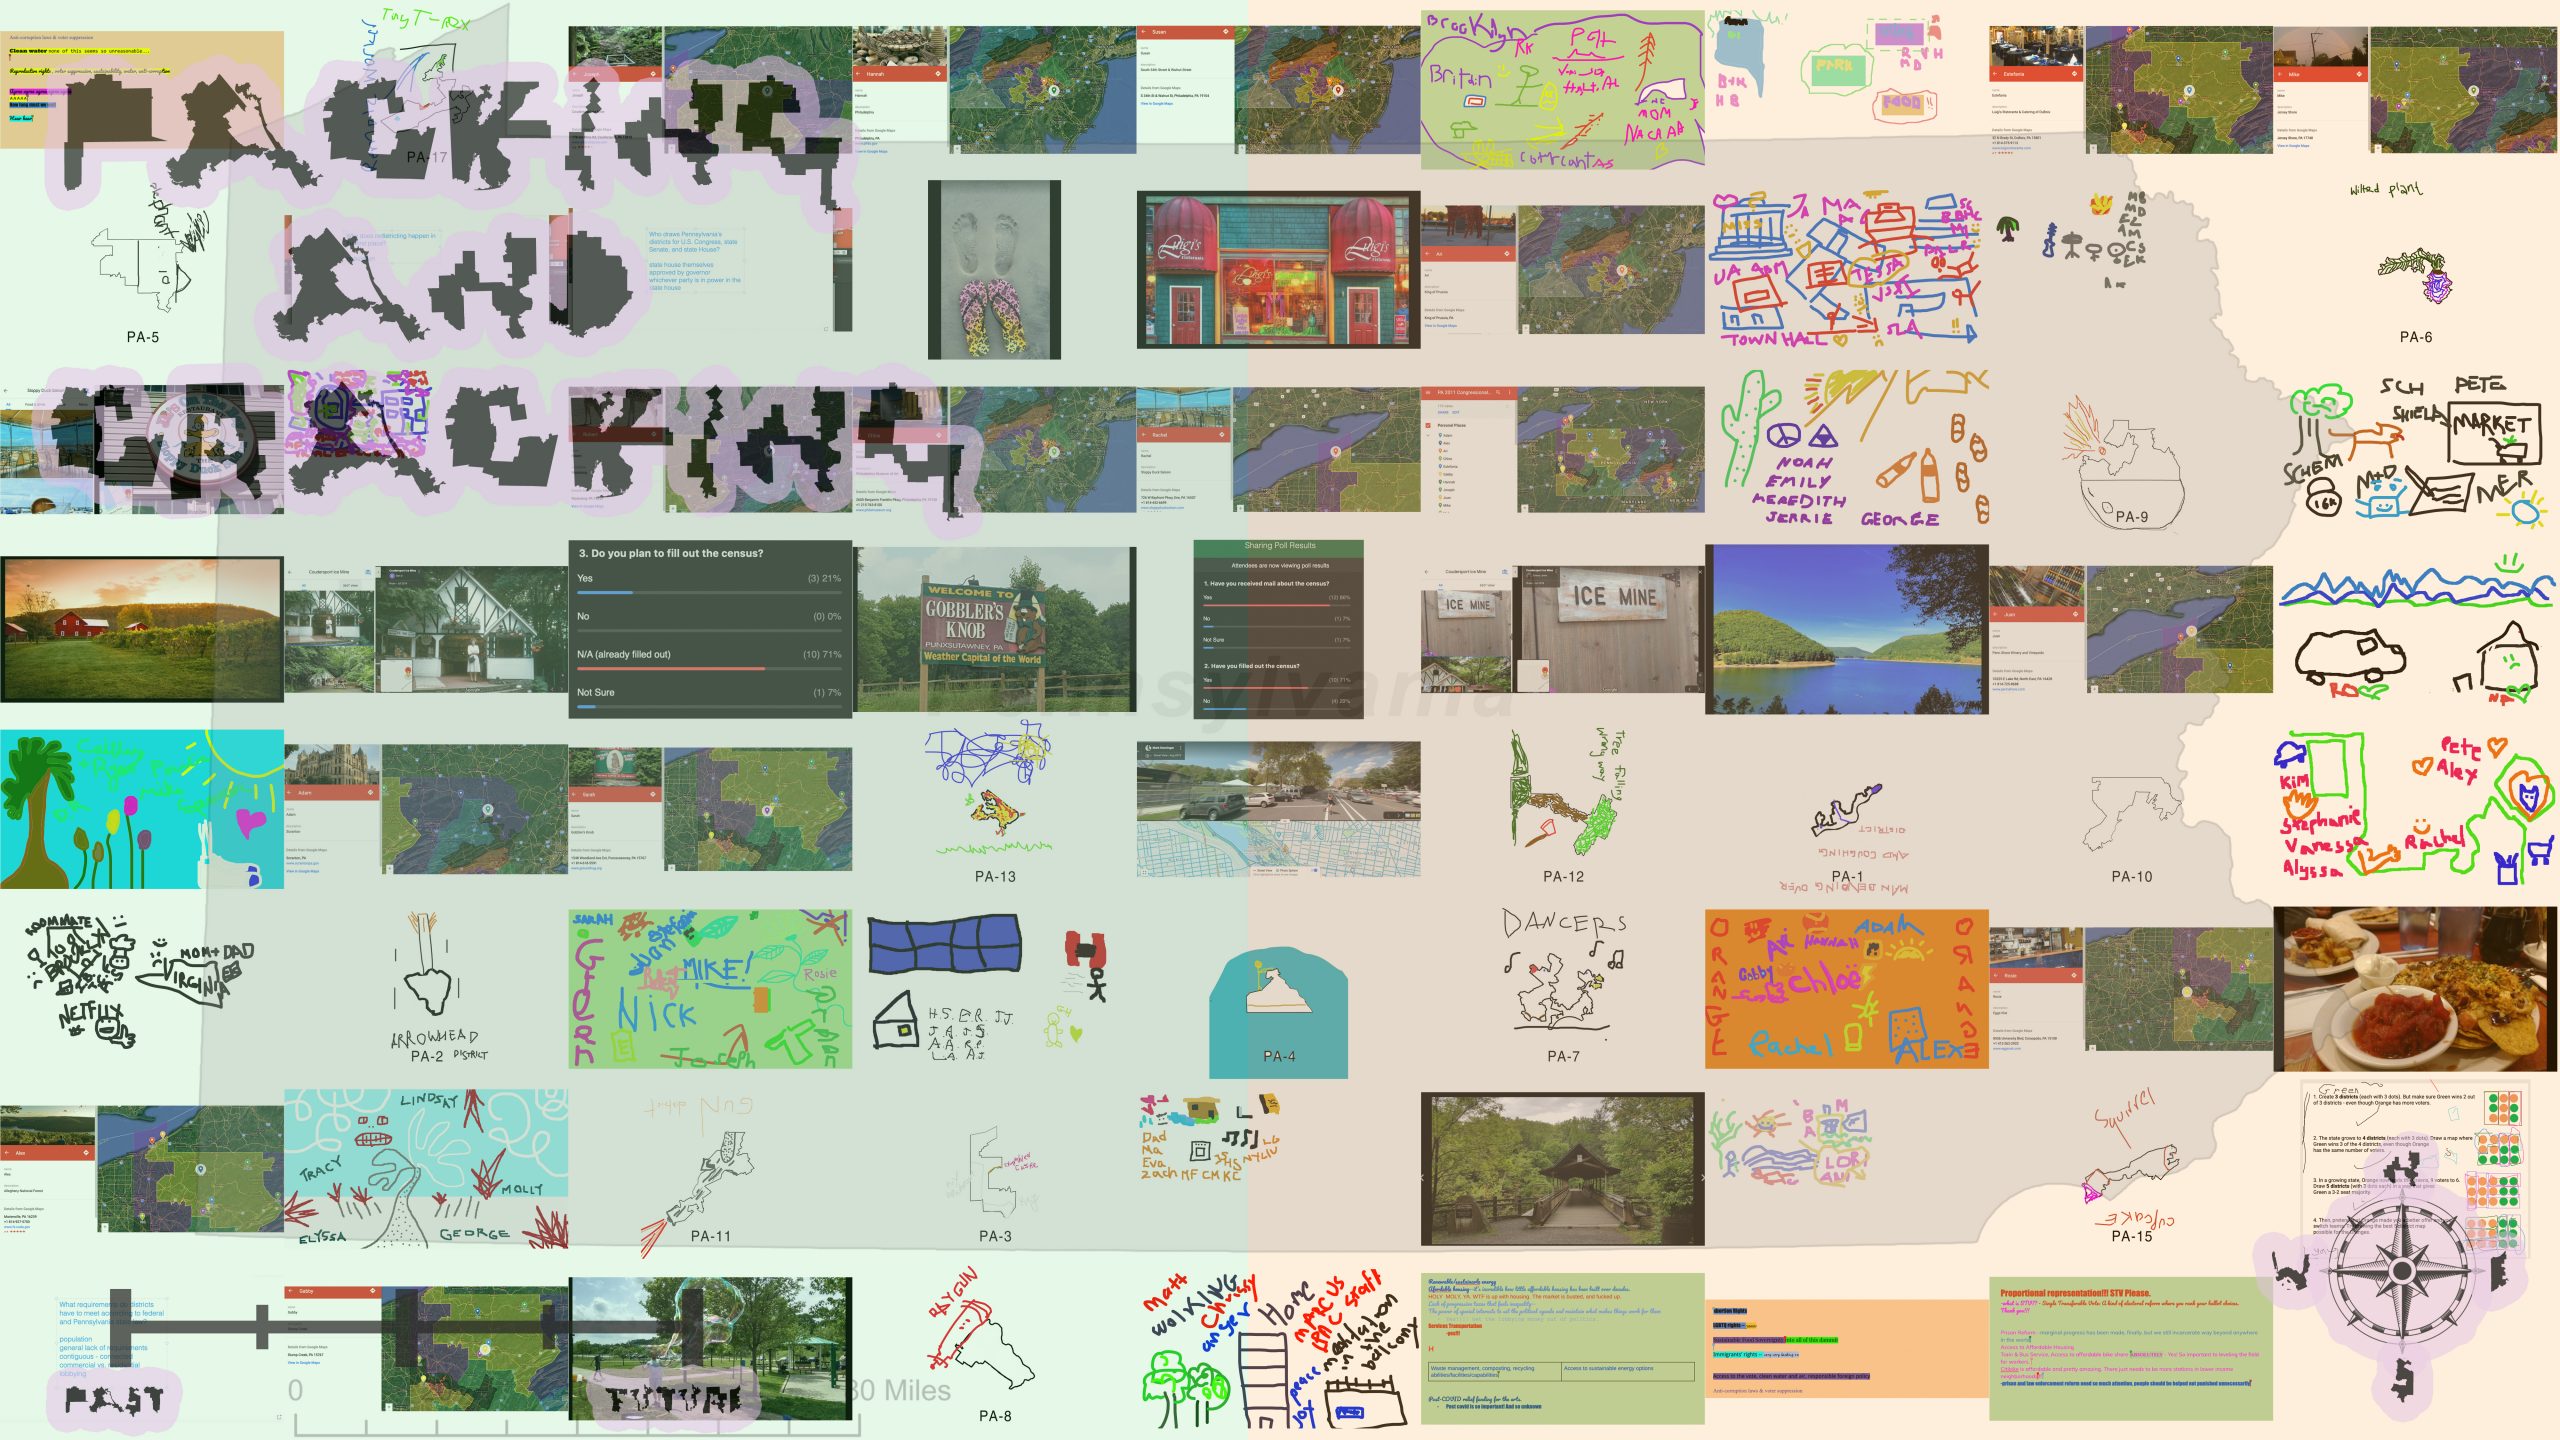
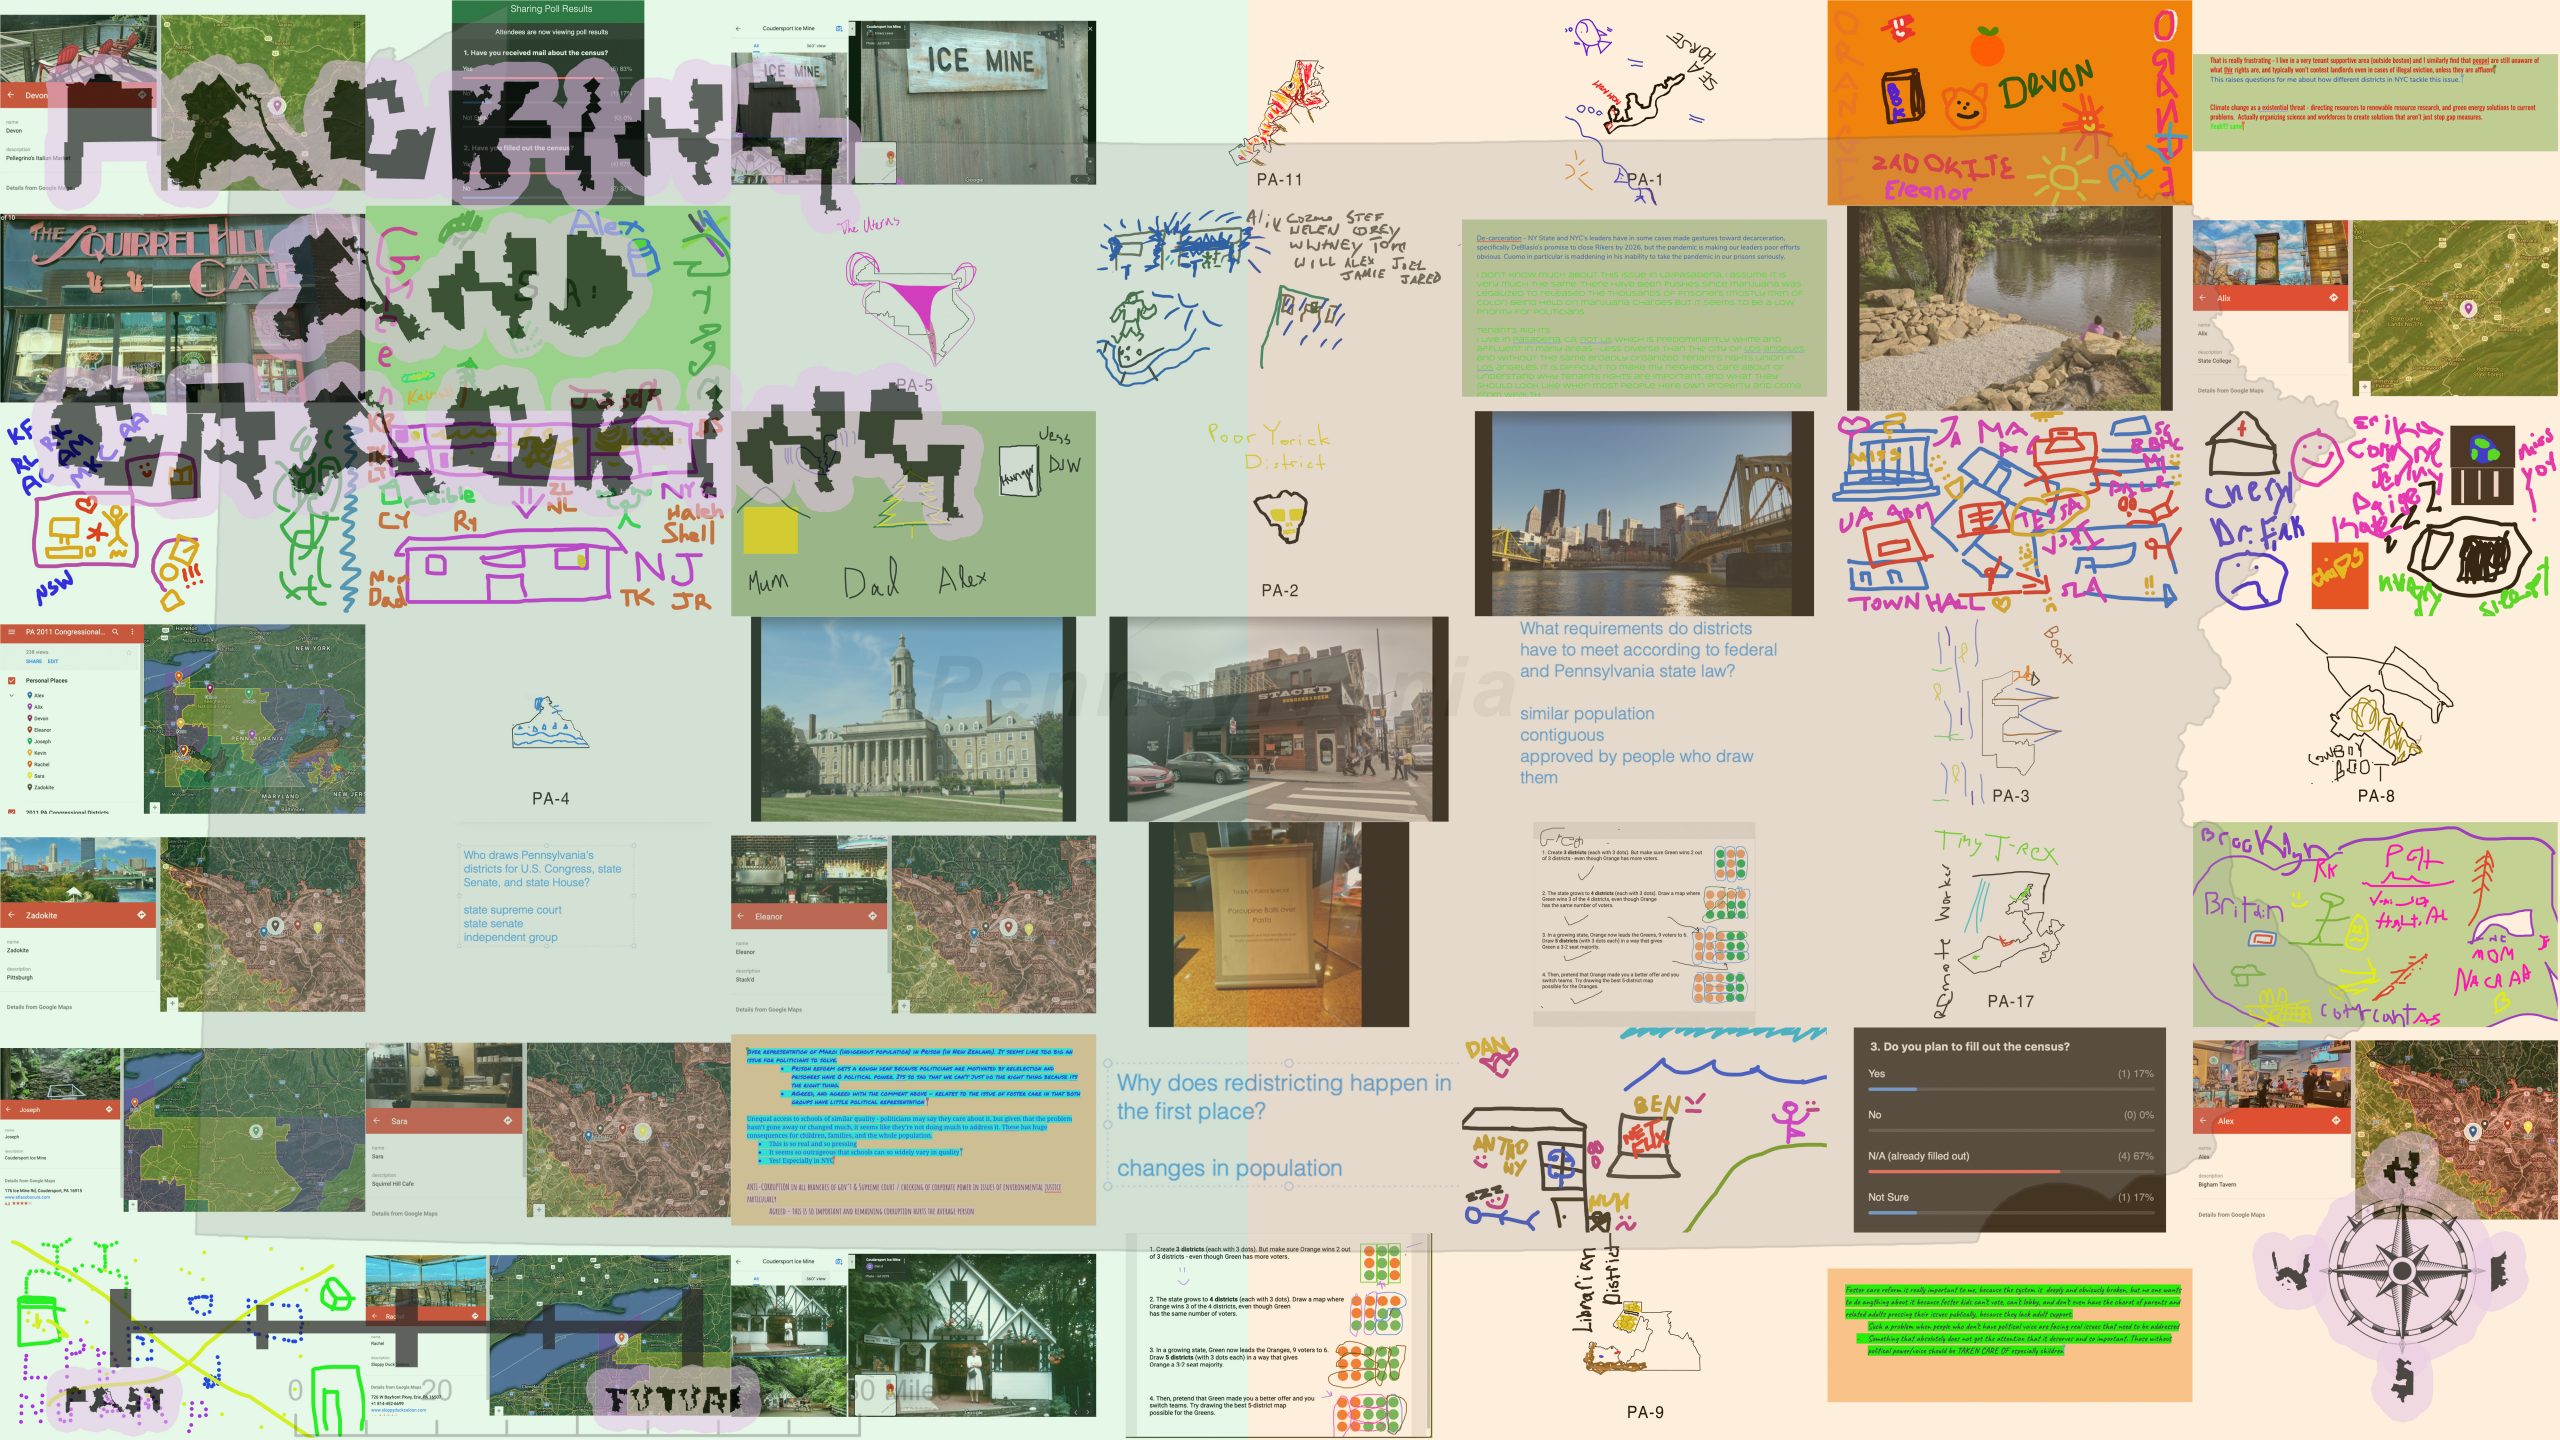
The scope of this project is greater than this class (and is also more than I had time to effectively present about in class last Thursday) – nonetheless I want to focus on the maps created as they are visualizations from an experimental capture data set. The data set being the participants in the theatrical event and the images that they made over the course of those 90 minutes on 4/22/20, 4/24/20, and 4/26/20. The objects created and documented below are meant to be for those specific people who were participants in the event. They are an archive of their and their fellow participants experience presented in both a shuffled and collaged shareable format (the 2D maps) and in a way that allows for them to take more hands on time to go through the digital detritus that they created while attending packing and cracking (the 3D interactive website ‘map’).
I will try to provide a little clarity as to what the images came from for the purpose of documentation of this project. The objects that comprise the maps are:
Personal maps showcasing the places, events, people and feelings the participants experienced in the past month. They are given 2 minutes for each of the four topics and encouraged to think about these categories in an expansive way. The drawings are created via the networked drawing website, aggie.io
District backgrounds that are created as a group. This was from when the audience was split into the ‘orange’ and ‘green’ district.
Poll results from throughout the zoom experience.
Images of responses from round-robin-style question moments.
Worksheets done as a collaborative district looking at drawing districts and district lines.
The weird shapes created from the outlines of heavily gerrymandered districts (also done on aggie.io).
Images from round-robin writing about issue that audience members care about.
Images of google map locations that participants went to as they got to know Pennsylvania.
Images of those same places with district lines inserted on top of them.
These objects are the ephemera from many of the games and serve as a visual reminder of the things learned and created in the experience, but also as an object in total that points to the hope that might come out of taking the time to learn about gerrymandering. Below is an excerpt from the performance script of Packing and Cracking where the map is revealed at the end of the show. This reveal that the images have been collected and made into a map is a surprise. The images are collected throughout the performance in a combination of automated and manual ways and are processed for quick map creation so that everythings is ready to be presented as part of the performance.
———————————————————–
Excerpt below:
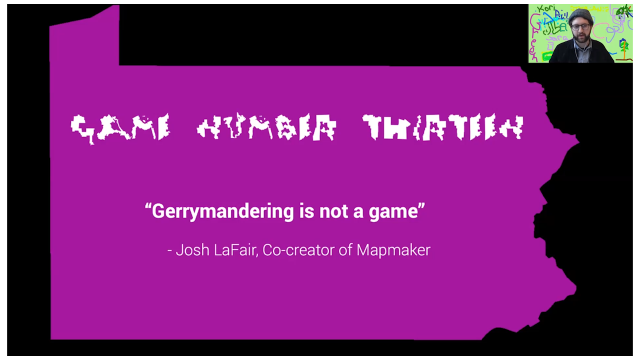
RACHEL: Gerrymandering is not a game, but tonight, we played a lot of games to learn about it, and redistricting, and maps, and each other, and maybe ourselves.
JOSEPH shares the final map.
JOSEPH: Here’s a map of everything that we made.
JOSEPH shares a link to it in the chat.
JOSEPH (cont.): And here’s a link to it, too, so you can take it with you.
RACHEL: What you do with this, what you do with anything you may have learned here tonight, or thought here tonight—that’s up to you. You could see how gerrymandering affects where you live. You could get really into it like Amanda Holt did, or Josh LaFair. You could get into it in a different way and reach out to your representatives to let them know you care, or share this map to show that you do. Or you could talk to a friend. Or fill out the census. Or vote in the next election, because in so many states, the people elected will be the ones who will draw maps next year that could be in place for the next decade. Or you could do nothing—we do live in a democracy.
One in which 59 million people live in a state controlled by the party that won fewer votes in the 2018 election. That’s 1 in 5 Americans. But yeah, a democracy, yeah.
JOSEPH: Maybe today can be a step. Like onto the steps in front of the Supreme Court. Or onto that falling apart bridge in Reading. Or onto a different way for our country to be. Maybe the map we made can help guide us, like any good map does. I guess we’ll see.
RACHEL: No matter what, we hope you stay safe, and healthy, and engaged.
Considering that all in person art making in groups has been put on hold for now, I am pleased with how this project turned out and the interactivity of the 3D maps. I was excited to try to respond quickly and make performance in these new forms asked of us by these new times. I do wish my presentation had been more focused. I wish I had the time to dive deeper into three.js to work with the interactivity of the 3D maps in a more comprehensive way. Overall I found this switch to COVID-school to be difficult on many fronts. I am disappointed with my output in my last months of grad school, and had to make a lot of adjustments in what I had been planning on working on as the world shifted. I am trying to not be too hard on myself and begin to figure out what might be next for me. The Studio has come to feel like a second home for me during my time at CMU and I lament the lost time to be with the curious, weird, and joyful amalgamation of folks that end up there. Thanks for a really lovely semester and kind adaptation to making education work as well as it can in these new times.
AI generated drawing prompts disseminated over fax.
A brief description
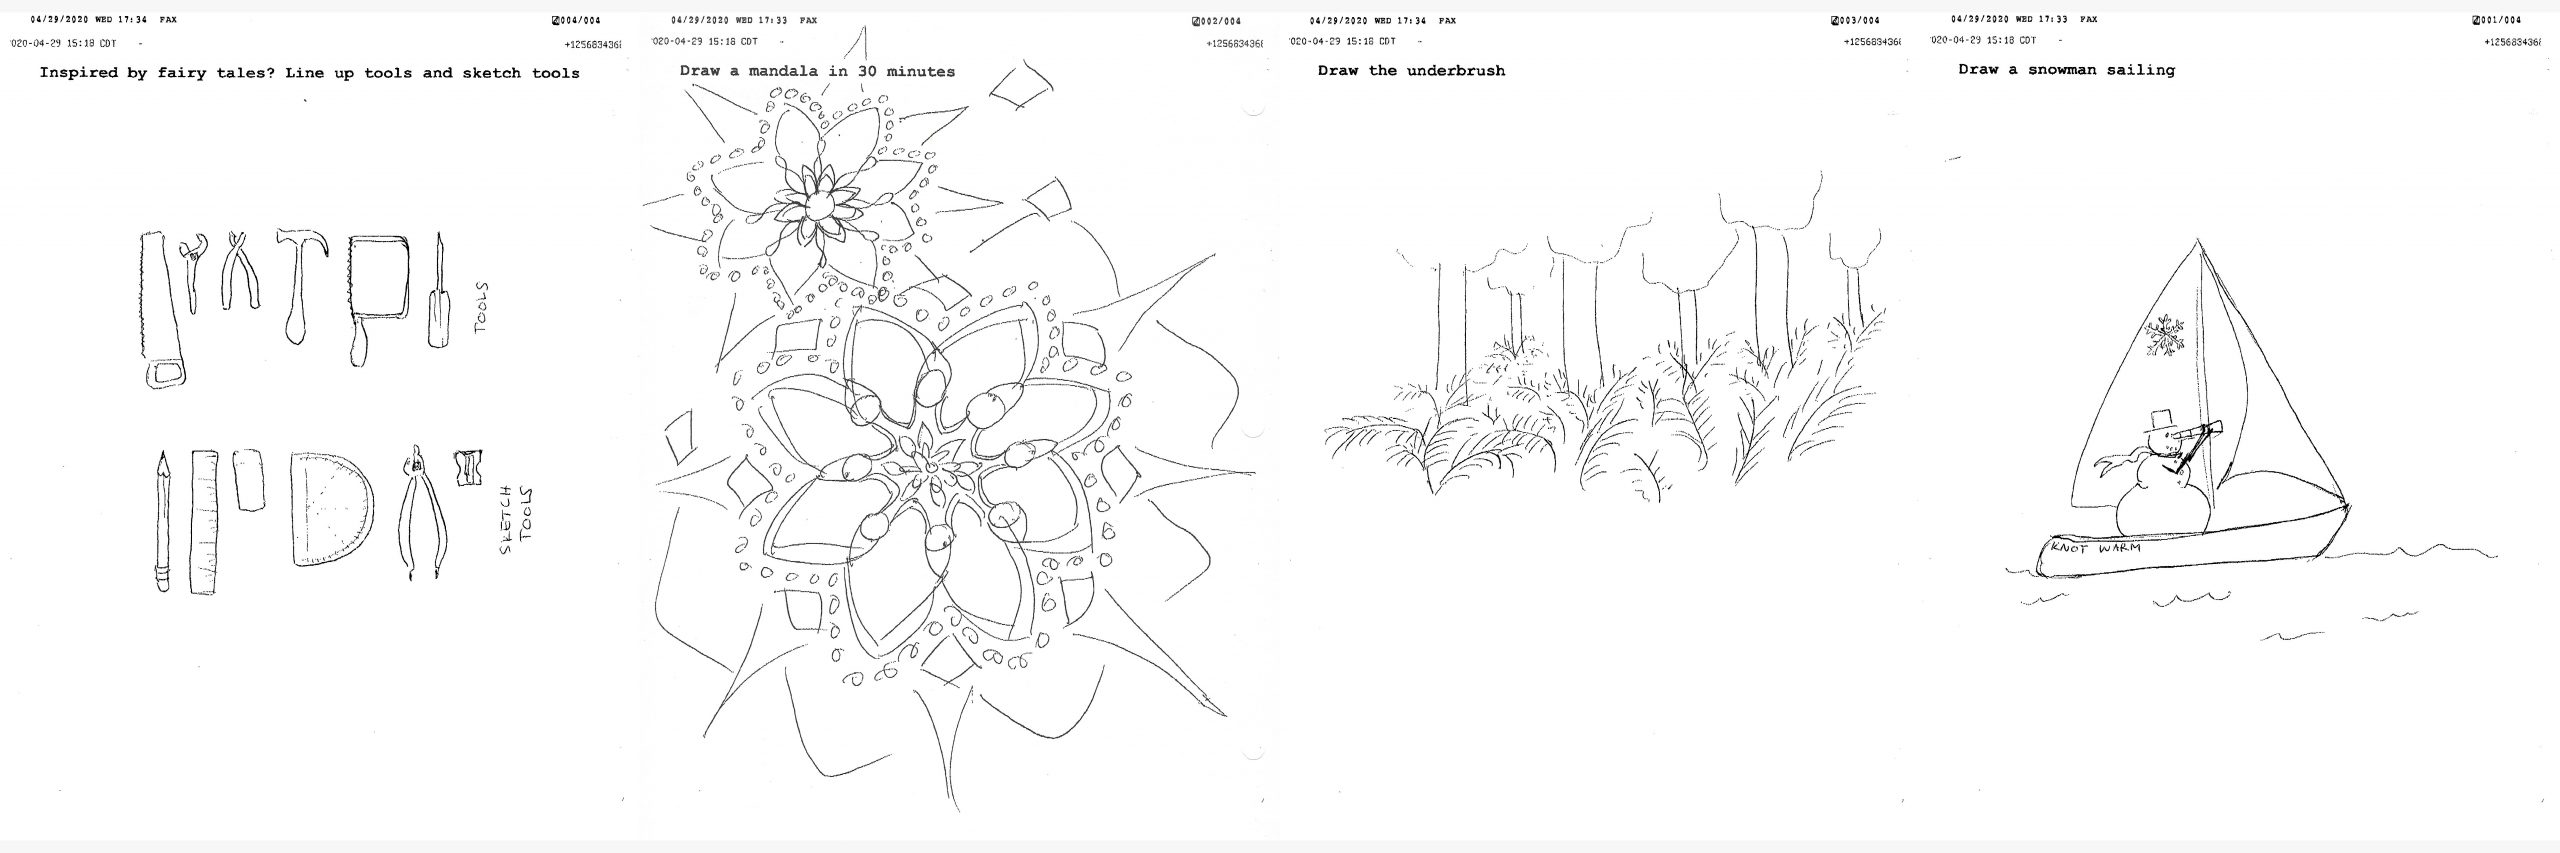
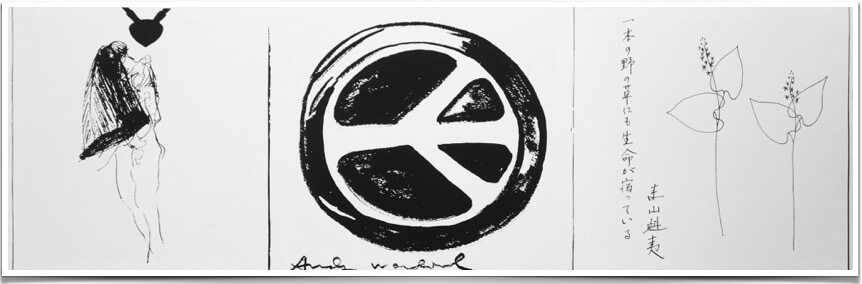
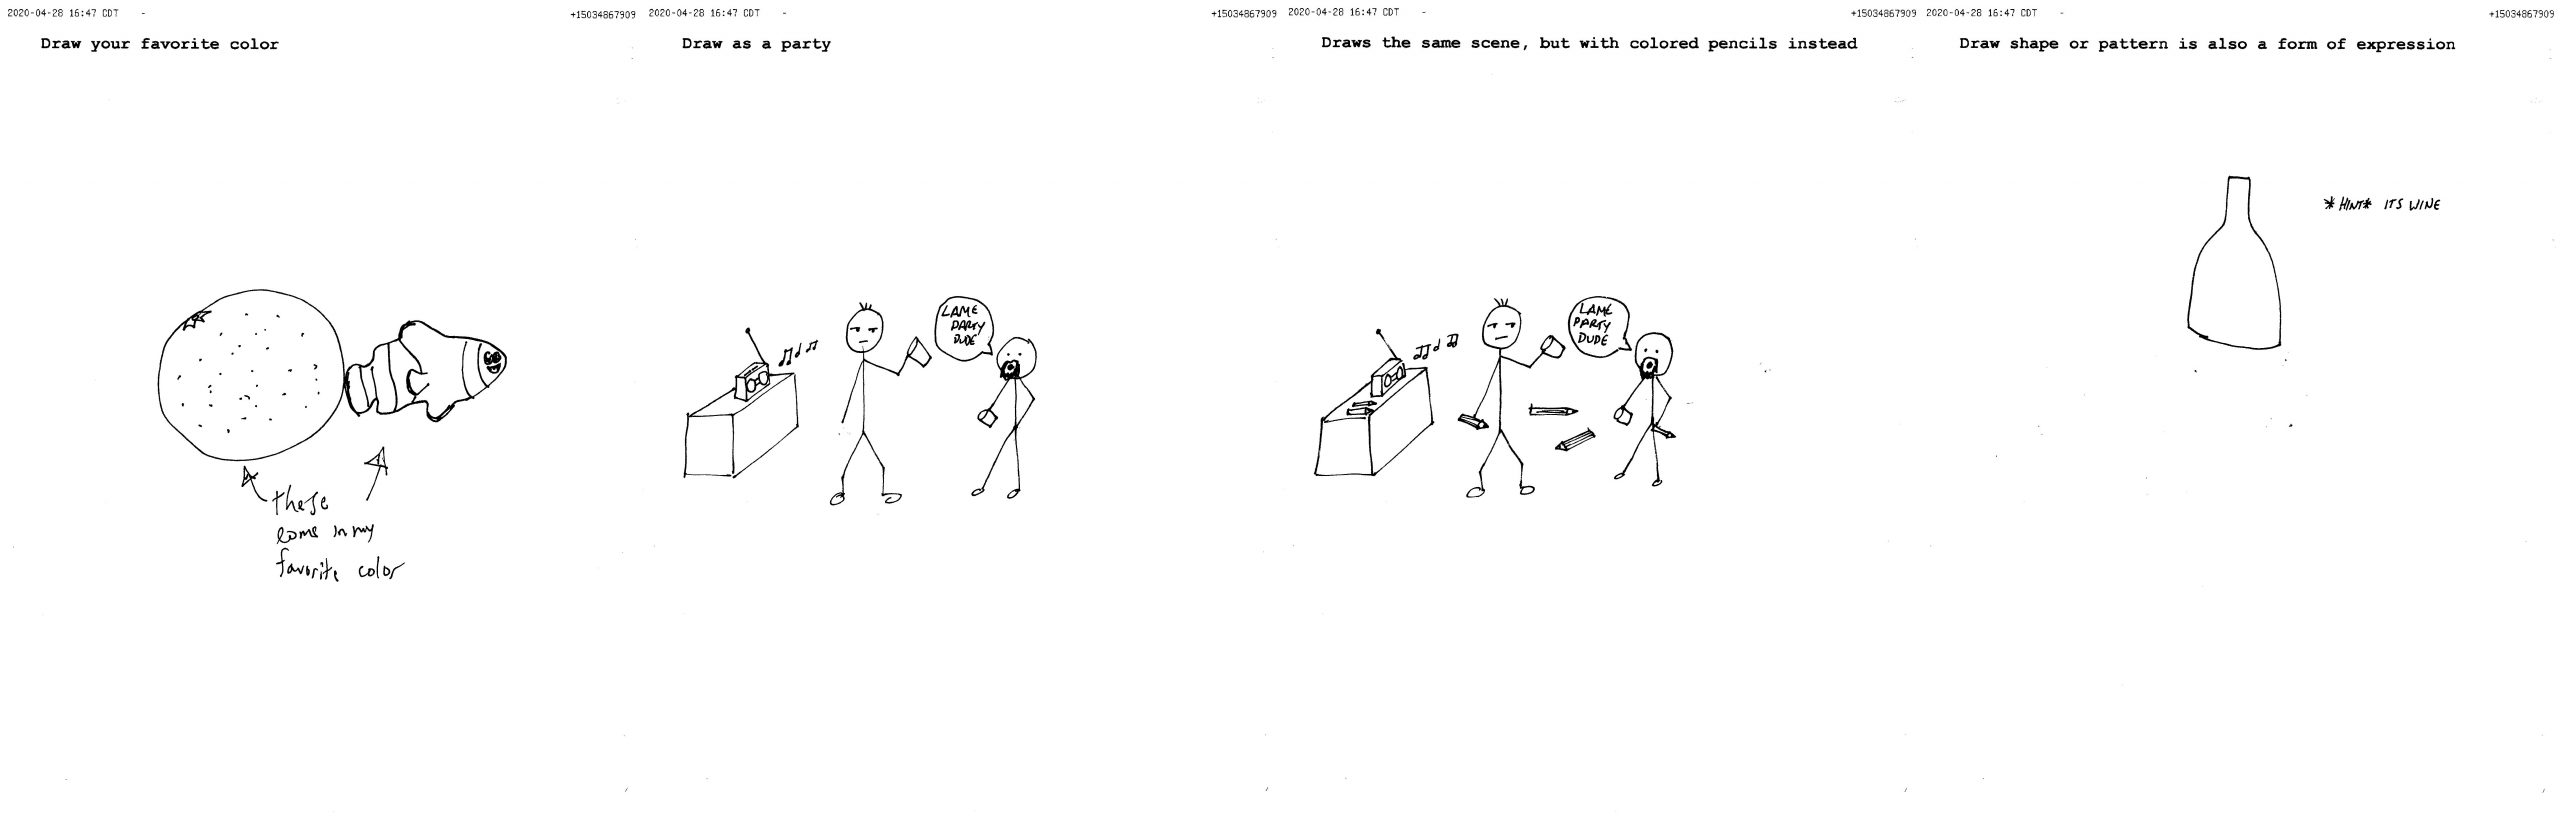
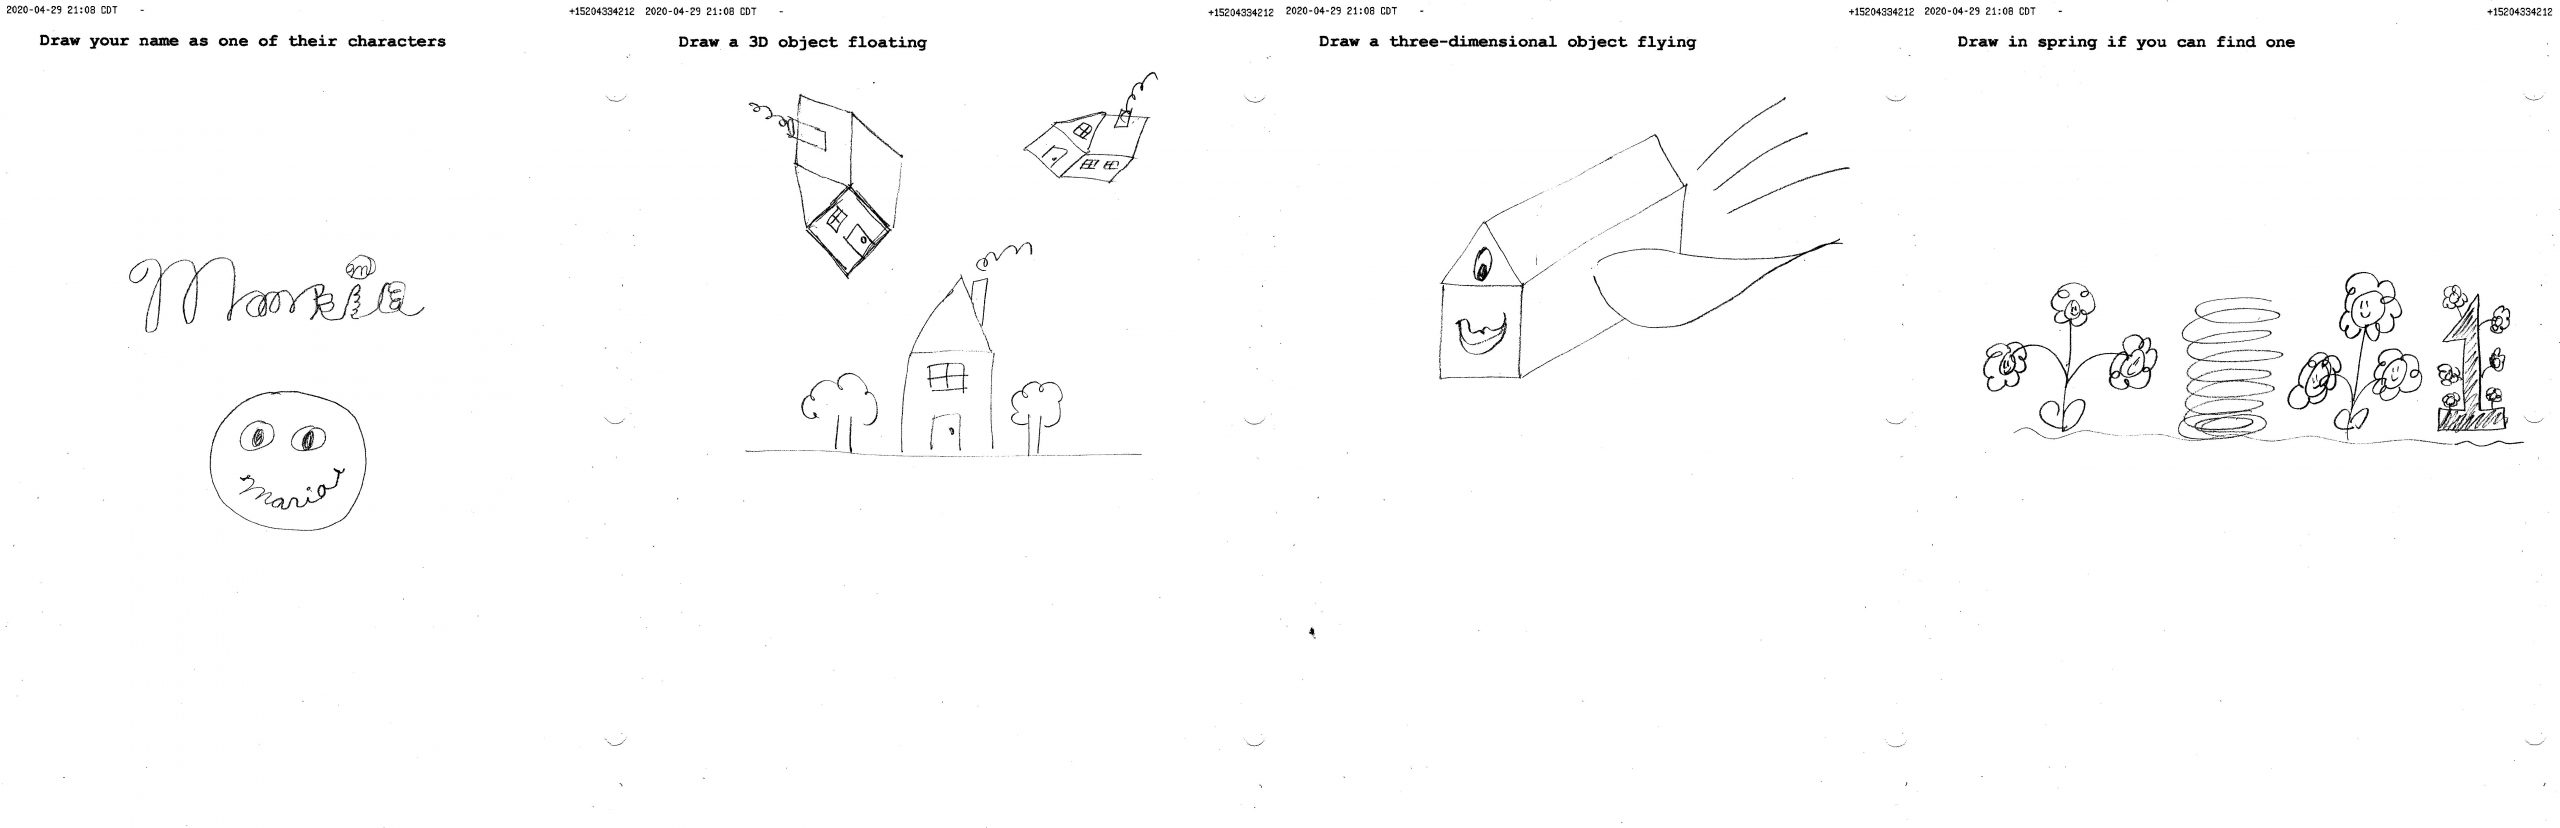
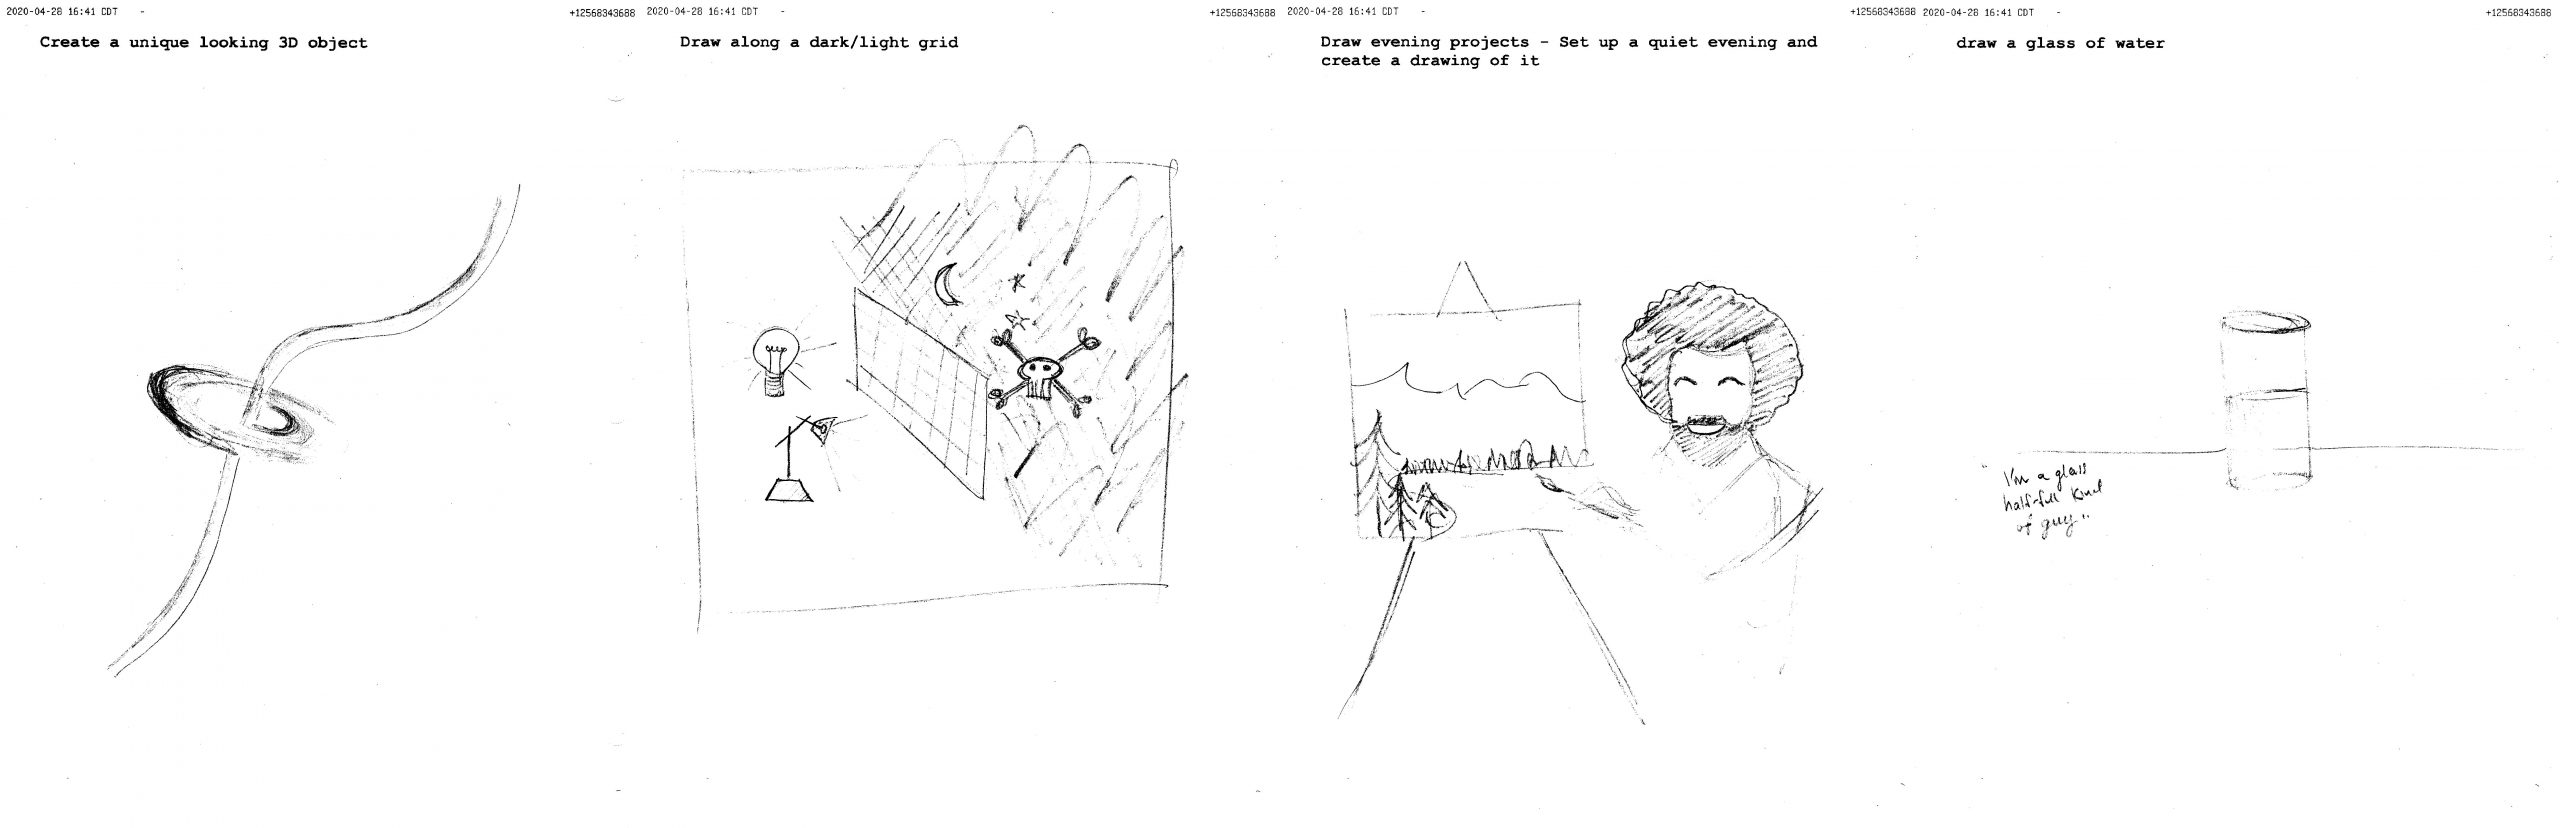
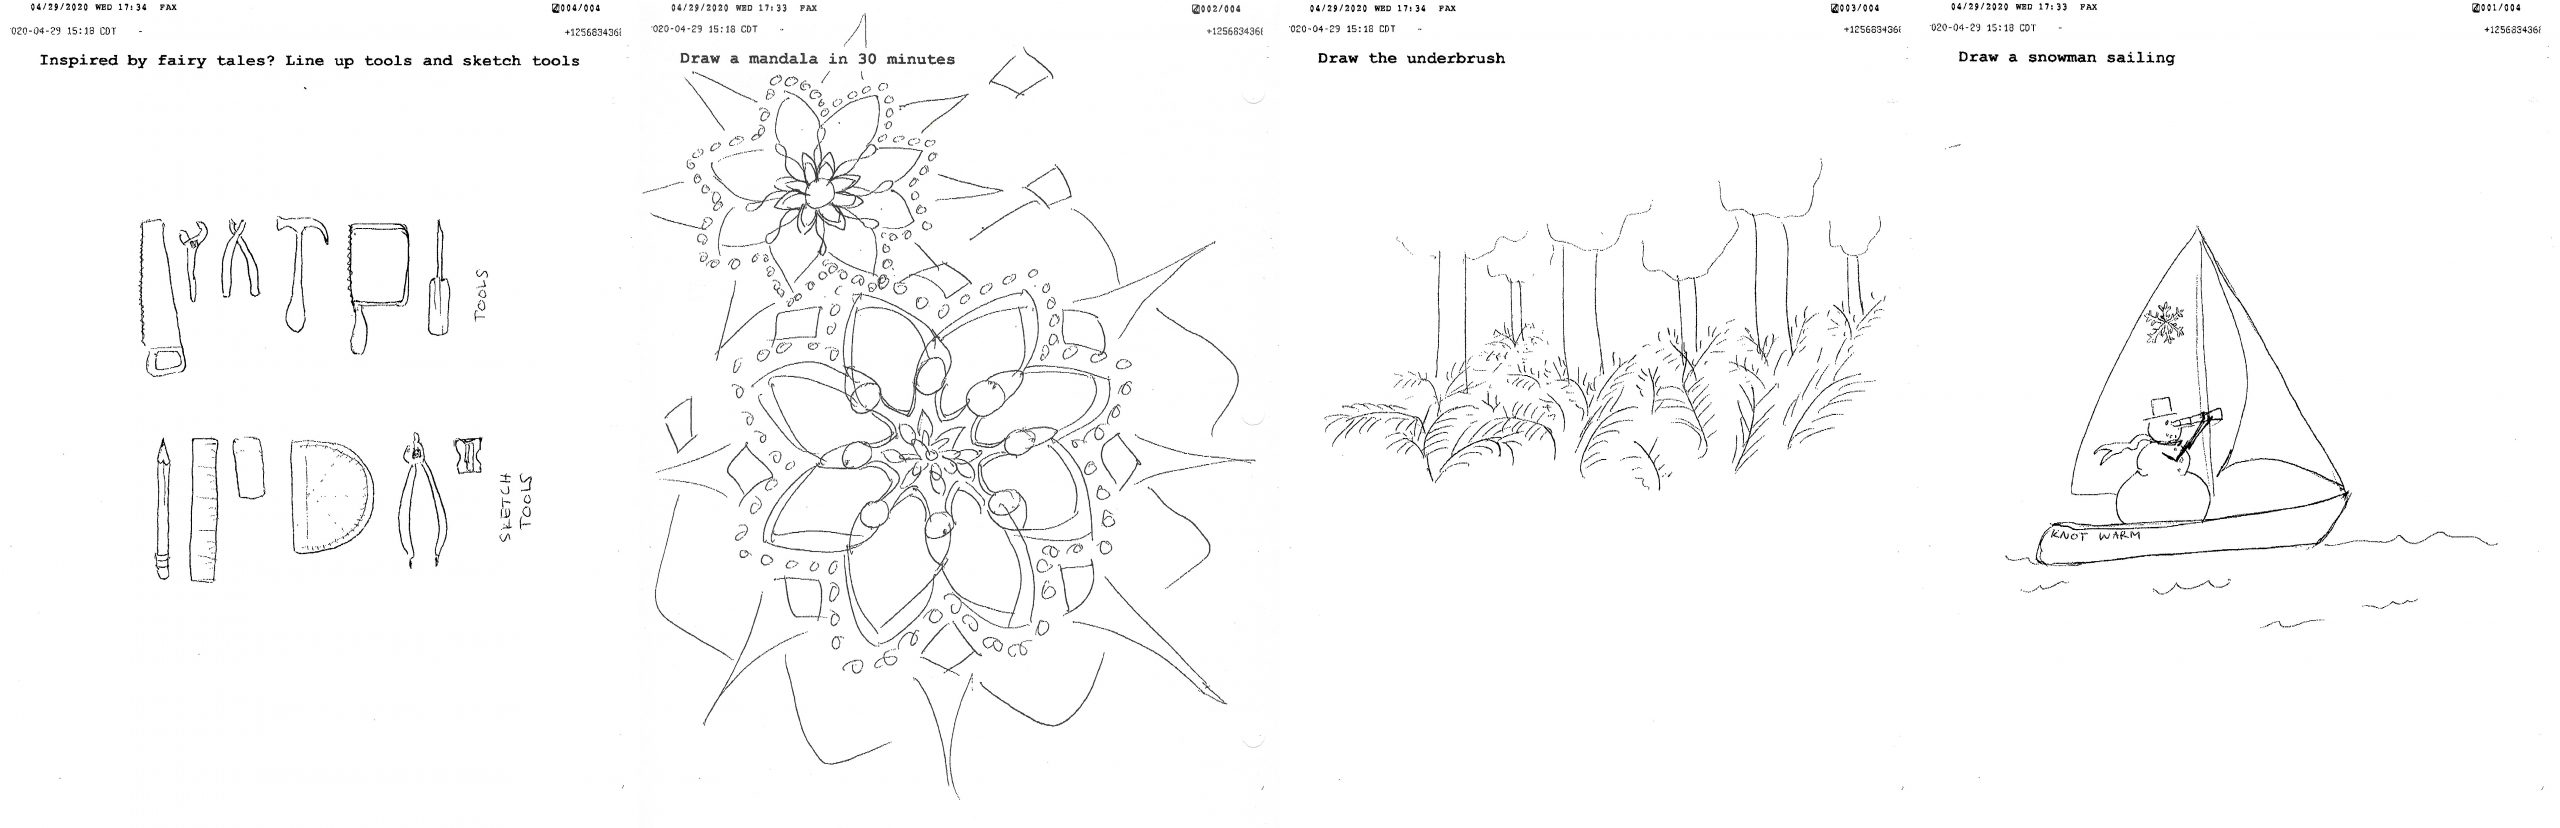
Faxtivities is a collection of drawings created by people in quarantine. To create these drawings, each participant was faxed four pages, each containing a prompt generated by an AI. The participant was asked to create a quick black-and-white drawing in response to the prompts on each of their pages and then fax the completed drawings back to me.
The project evolved from my interest in figuring out what I could do with a fax machine. In a time when many of us are stuck in our homes and trying all sorts of ways of staying in touch with each other, I thought it was an apt opportunity to experiment with a tool for communication that, in all likelihood, is near the edge of extinction. The project eventually moved beyond just faxing and began to ask a second question: what if a computer completely manages one side of the fax?
The drawing prompts were influenced by two sources: Learning to Love You More, a piece created by Miranda July and Harrell Fletcher which asks its audience to respond to a list of assignments. I was also inspired by Billie Eilish Gets Interviewed by a Robot, created by Brook Linder, Taeko Masuyama, Lisa Romagnoli, and Nicole He for Vogue, a video in which Billie Eilish is interviewed using questions generated by a tweaked GPT-2 AI. Synthesizing the concepts from these pieces of work are what led to the strange mix of disparate things that became Faxtivities.
Evaluating the piece
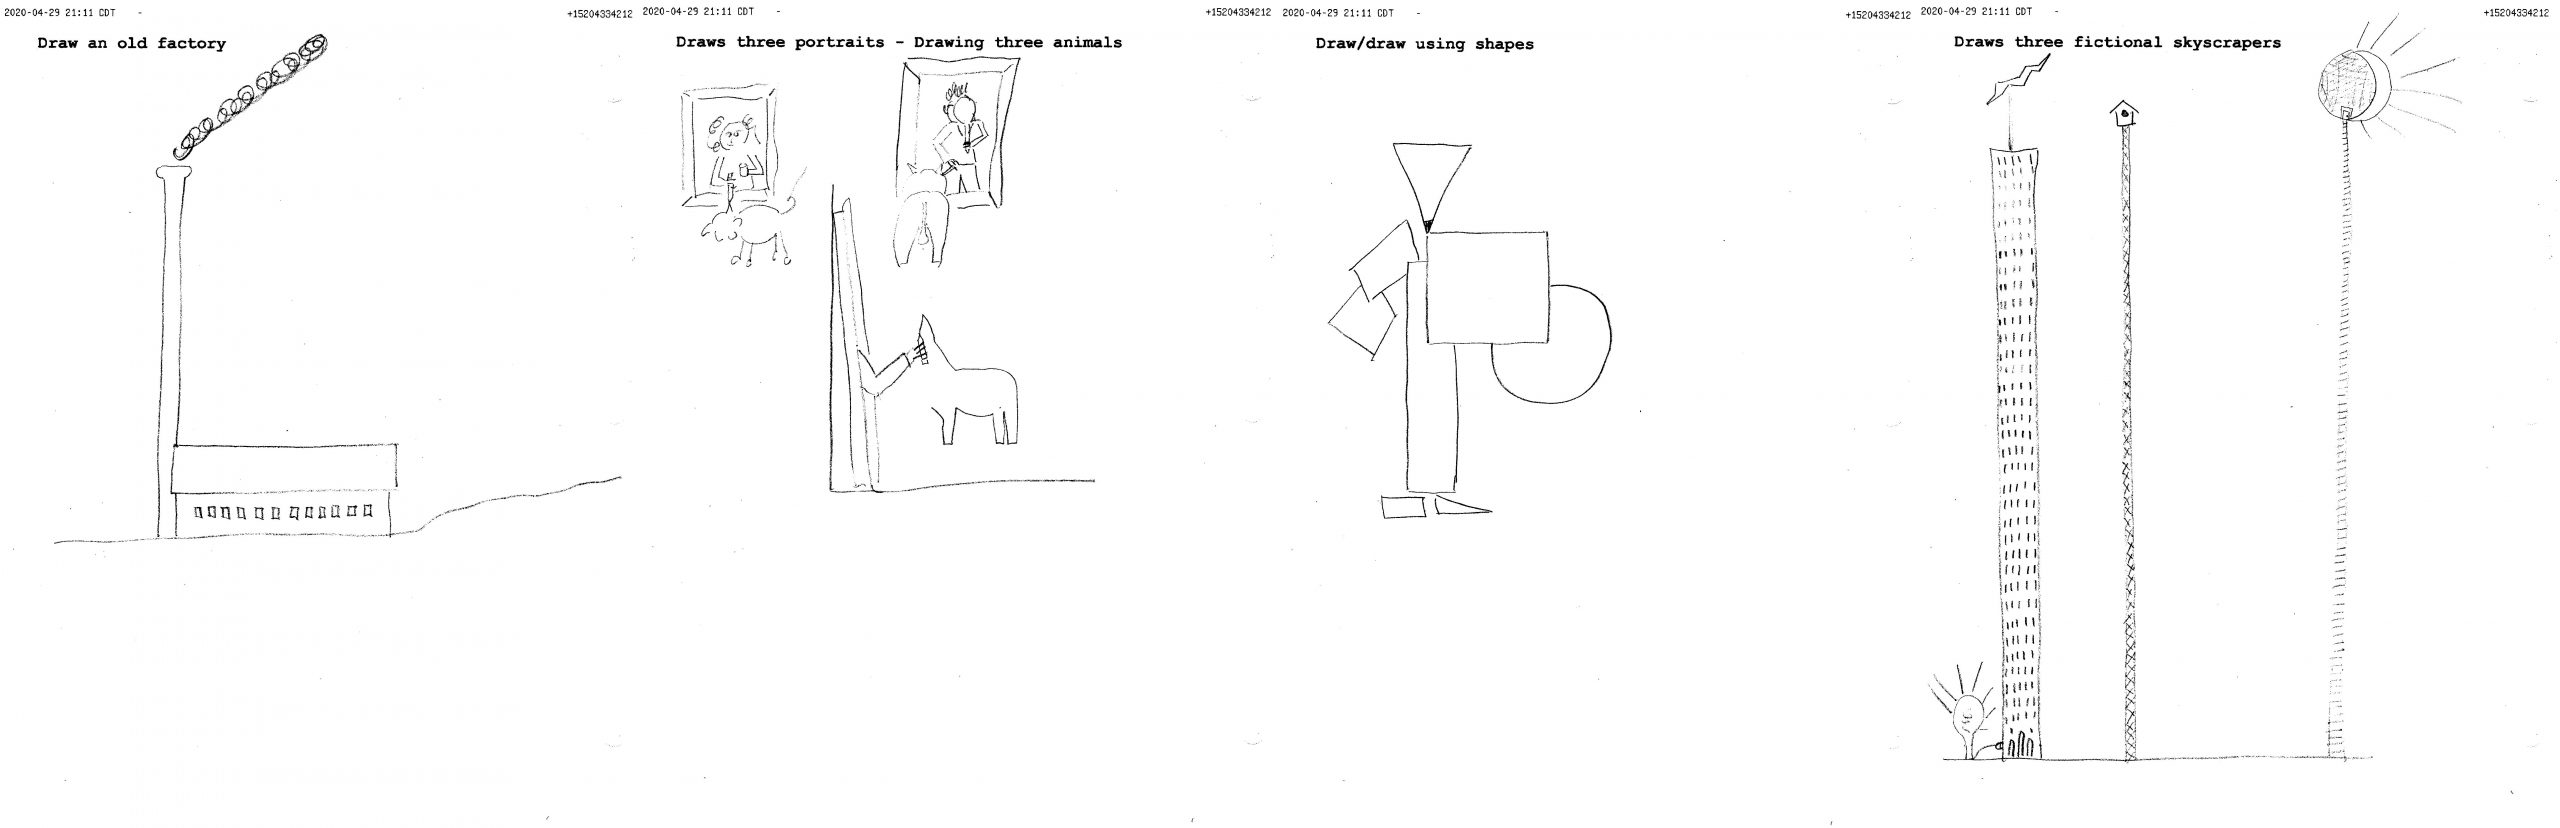
I think Faxtivities succeeded on a couple levels. While the algorithmic generation of drawing prompts is nothing new, the generation and dissemination of those prompts through fax, put the process within a novel context. Furthermore, the uncurated nature of the project (prompts were generated and sent without being checked or curated by a person) made the project stronger conceptually, but it also drew from the project’s final product a little bit. By making the prompts seen for the first time when they were received by the participant, the project gained a level of whimsy that would have been lost of the prompts were curated. On the flipside, though, some of the prompts received were relatively pedestrian (one participant received BOTH “Draw a 3D object floating” and “Draw a 3D object flying.”)
Lastly, I elected to send every person four different prompts. I made this decision because I wanted to maximize the variety of prompts sent out, but looking back at it now, I wonder if something might have been gained by sending everybody the same prompts. In the cases where prompts were hard to understand, I think it might have been interesting to see how different people interpreted the prompts differently. I think the comparisons could have added meaning to the project in terms of how different people respond differently to confusing stimuli. The ability to compare that was unfortunately lost in the the choice to give everybody different prompts.
On a technical level, I didn’t write my prompt selection code to filter out prompts lifted directly from the training set, so a couple of the training set prompts ended up in the set that got sent out.
The work
The received drawings, each row drawn by one participant.
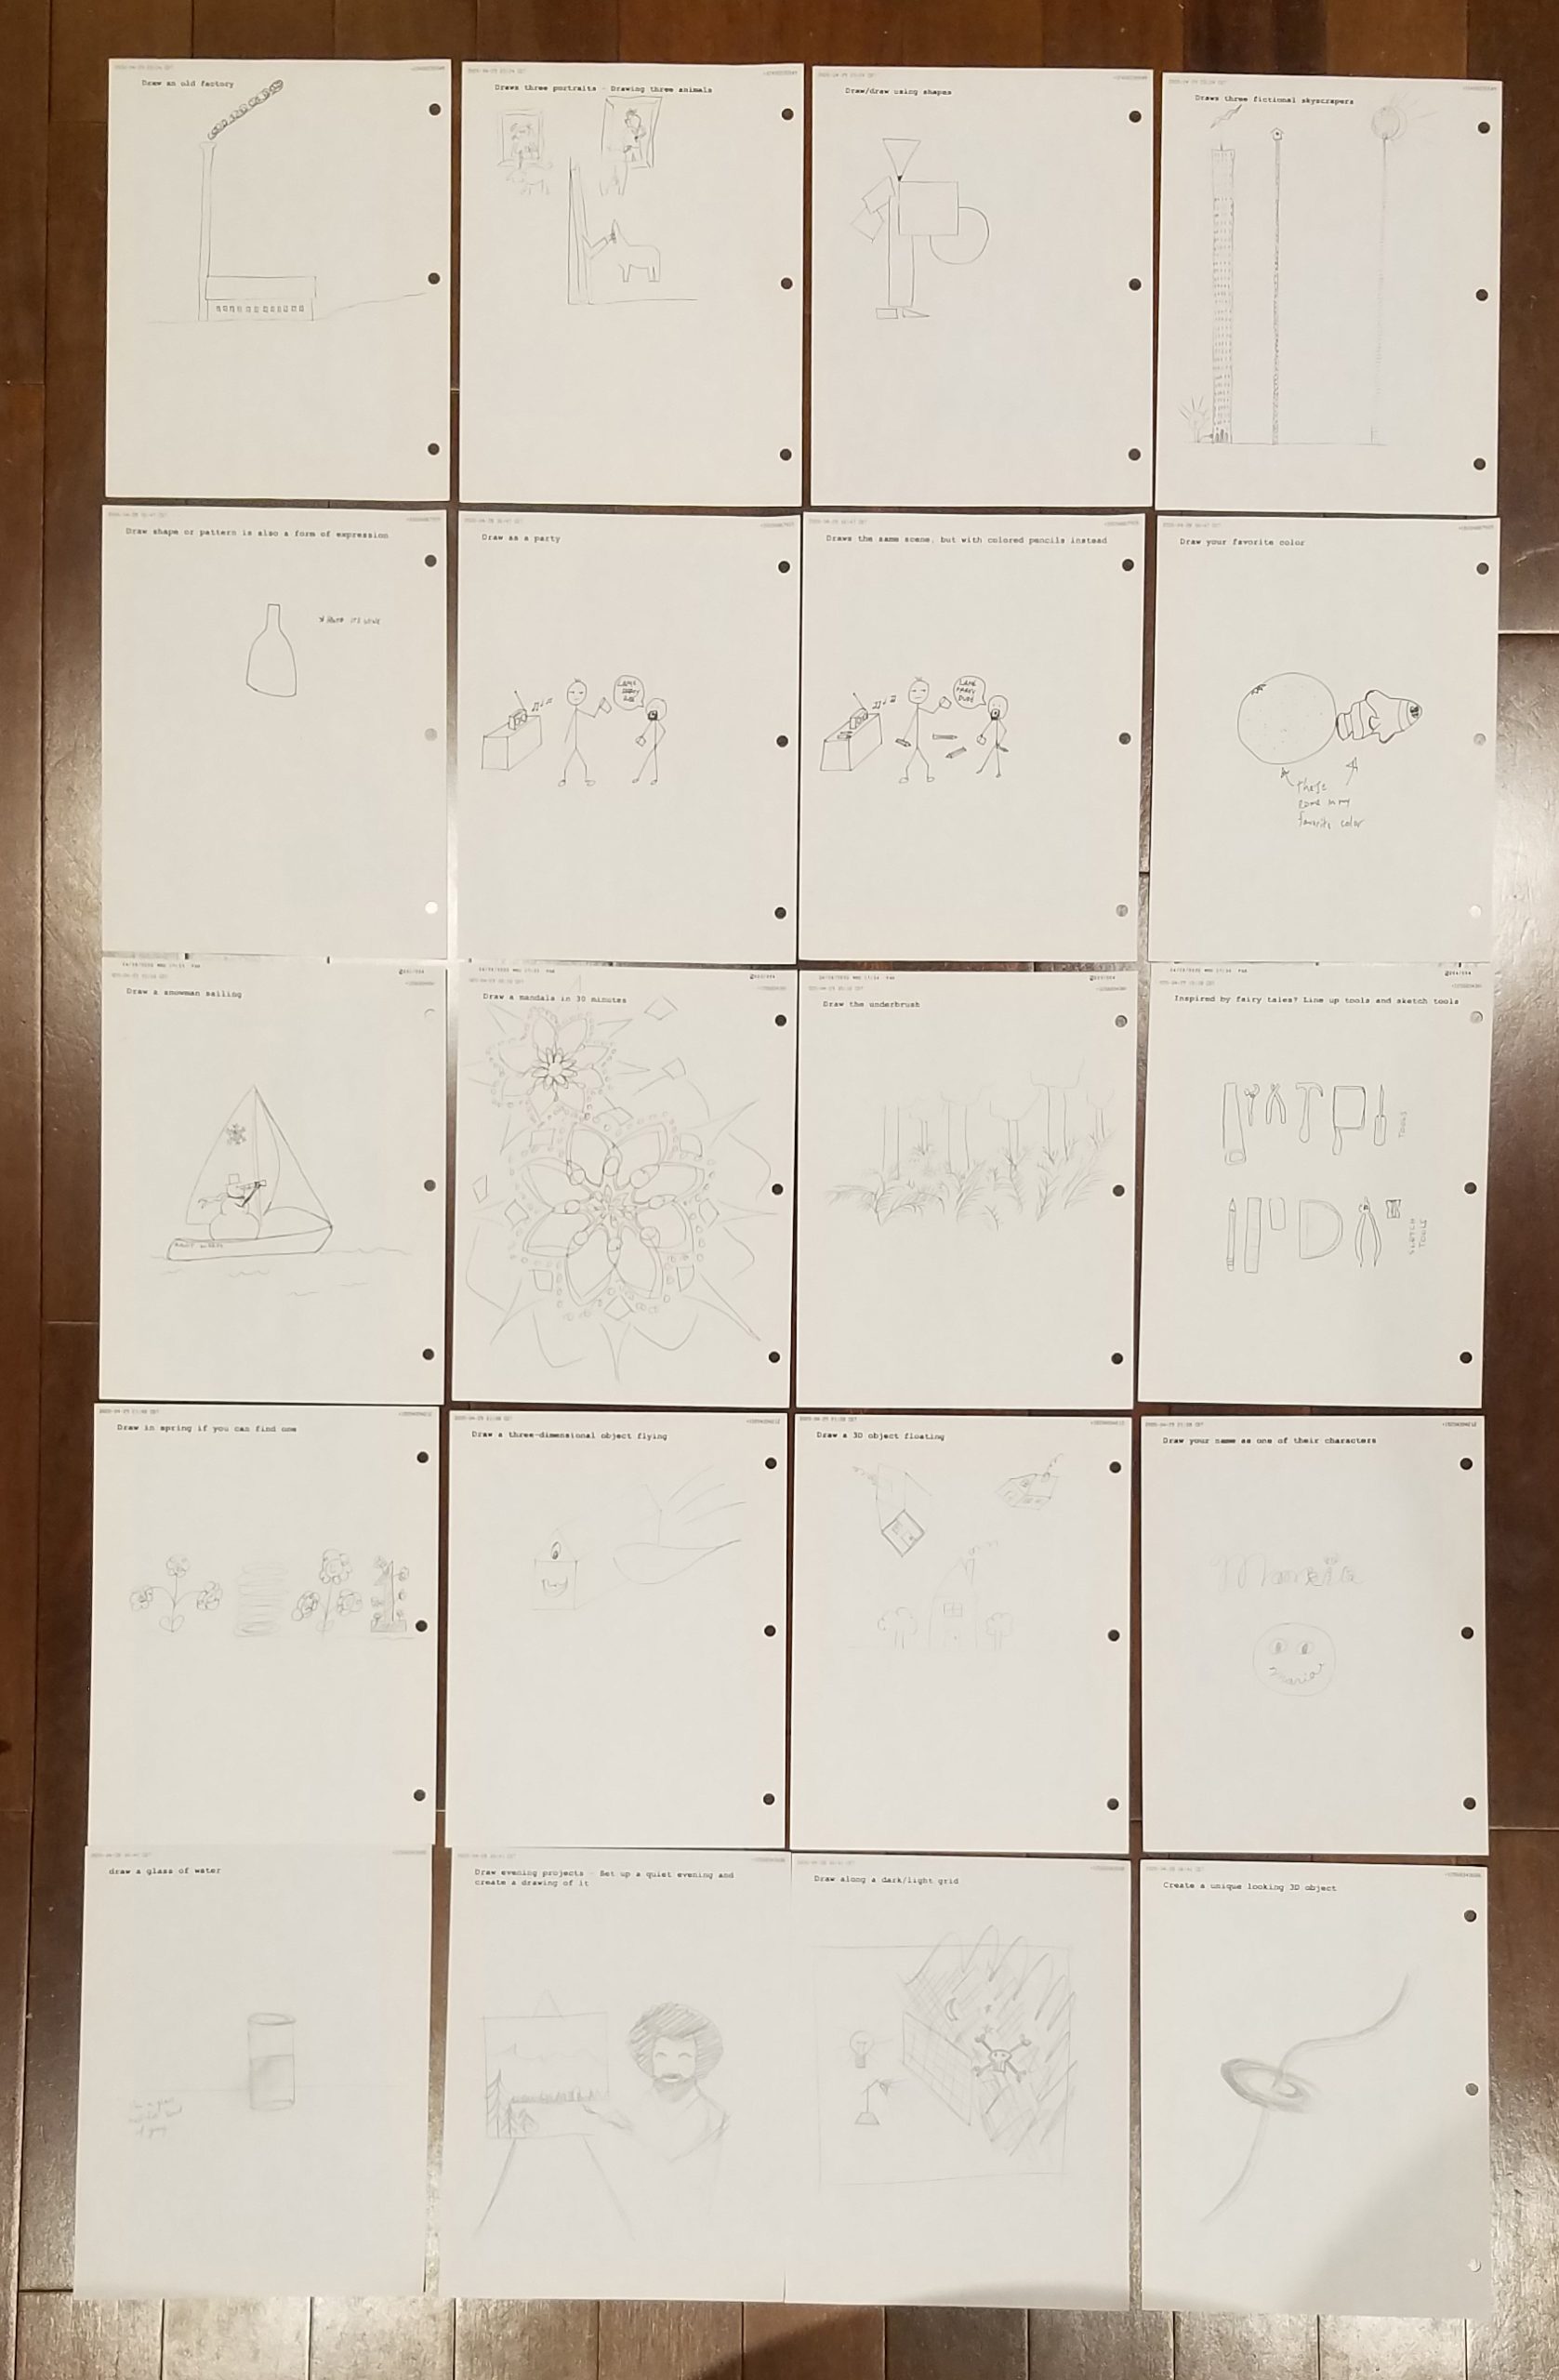
all of the received faxes laid out on the floor
A PDF of all the received faxes can be viewed here.
Process
The piece went through a number of conceptual changes before any work was done on implementing it. Originally conceived as handwritten prompts designed to be faxed to the participants on a daily basis. As the project evolved to become more computationally heavy, as it started involving AIs and code-driven dissemination of faxes, the writing of the prompts changed from handwritten to typed, and as time began running out, the dissemination of the prompts moved from a daily output of a prompt for a couple weeks (the original intention), to the output of four prompts per participant on demand.
When I finally settled on the idea of generating drawing prompts with an AI (originally prompts were supposed to encompass a wide range of activities, but it proved more successful to train an AI on a single, specific type of task) and sending them through fax without looking at the prompts, I had to look at a number of tools to do this. I ended up finding a really straightforward and useful Colab notebook for tweaking a GPT-2 model written by Max Woolf. I then created a training set of 525 drawing prompts, pulled from a number of drawing prompt web-pages. After training the smallest model on the sample prompts, I downloaded a file containing 100 generated prompts.
I made two Python scripts to deal with the faxing. One generated the pages with the prompts in an HTML format, four for each participant involved, by selecting random prompts from the 100 generated prompts. (I found a really nice library for Python for generating HTML files called dominate). The second script, given a phone number and the name of the participant, sent the prompts generated by the previous script to the participant over fax using a service called Phaxio, which also has a nice Python library, in addition to libraries for a number of other languages.
When I received faxes back from the participants I scanned the faxes.
3d visuals using photogrammetry for interviews with bands during quarantine
I wanted to create a project that was trying to do a little good in this crazy world right now, even if it was really small. Since, I have a radio show every week I made this project to explore what bands are doing in isolation right now and help those whose tours got cancelled to promote their new work. Interviews on YouTube that are audio only are pretty non-engaging, so I wanted to experiment with visual elements that are like a music video for an interview. This is definitely still a work in progress as I want to make the visuals more meaningful and custom to each interview. The video below is excerpts from some of the interviews conducted, with visuals from me experimenting with display.land, meshlab, unity, and premiere effects.
I think the content is interesting in the context of the time we are living in, I also think it is exciting because as I grow more comfortable with these softwares/experimentation I can create visuals that are more unique and personal to each person such as objects in their own homes. However, I am still figuring out ffmpeg in order to turn video to photogrammetry so that reality will come with figuring out this tool. Currently, I am using objects that are personal to me (such as the albums, places, and instruments featured) which I find interesting since I wouldn’t have access to these under normal circumstances and it highlights the connections between people and how music can bring us together.
The techniques used in this music video inspire me and I enjoy the repetitive, simple, but extremely engaging use of photogrammetry in the video. Also, not pictured but there was a pretty flashy and cliche music video we were shown in lecture that I couldn’t find of slowly flying through really textured objects/landscapes that mainly inspired this work as something I wanted to replicate but with more meaningful and less show-off-y objects.
I think that conversations that were had were in my project were very fruitful and I was happy with the visuals as a good start because they were very close to the aesthetic I originally wanted. The visuals lack strength in their concept, because although they are related they seem lacking in connectivity to the subject matter and something that makes them unique and important. But I am excited because I threw myself into a lot of unfamiliar territory and feel ready to experiment with more techniques and am excited to keep this project going .
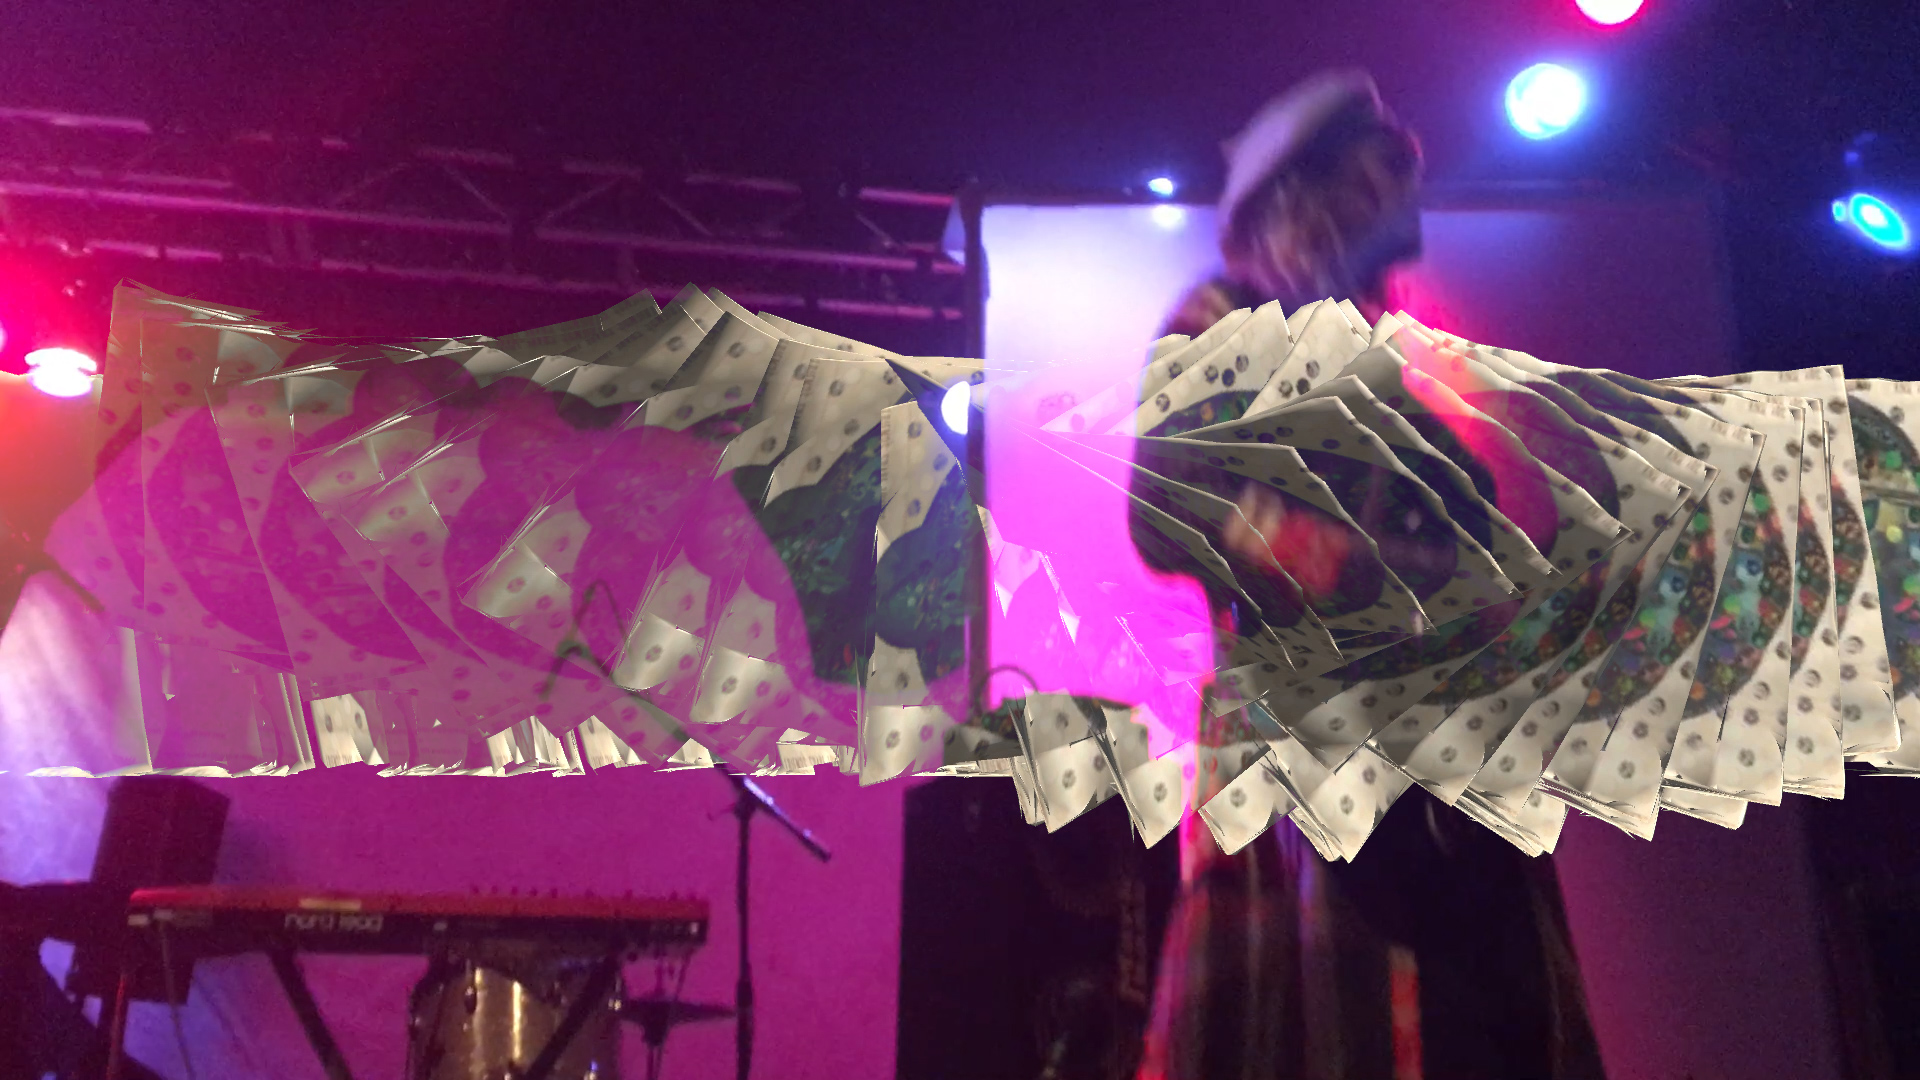
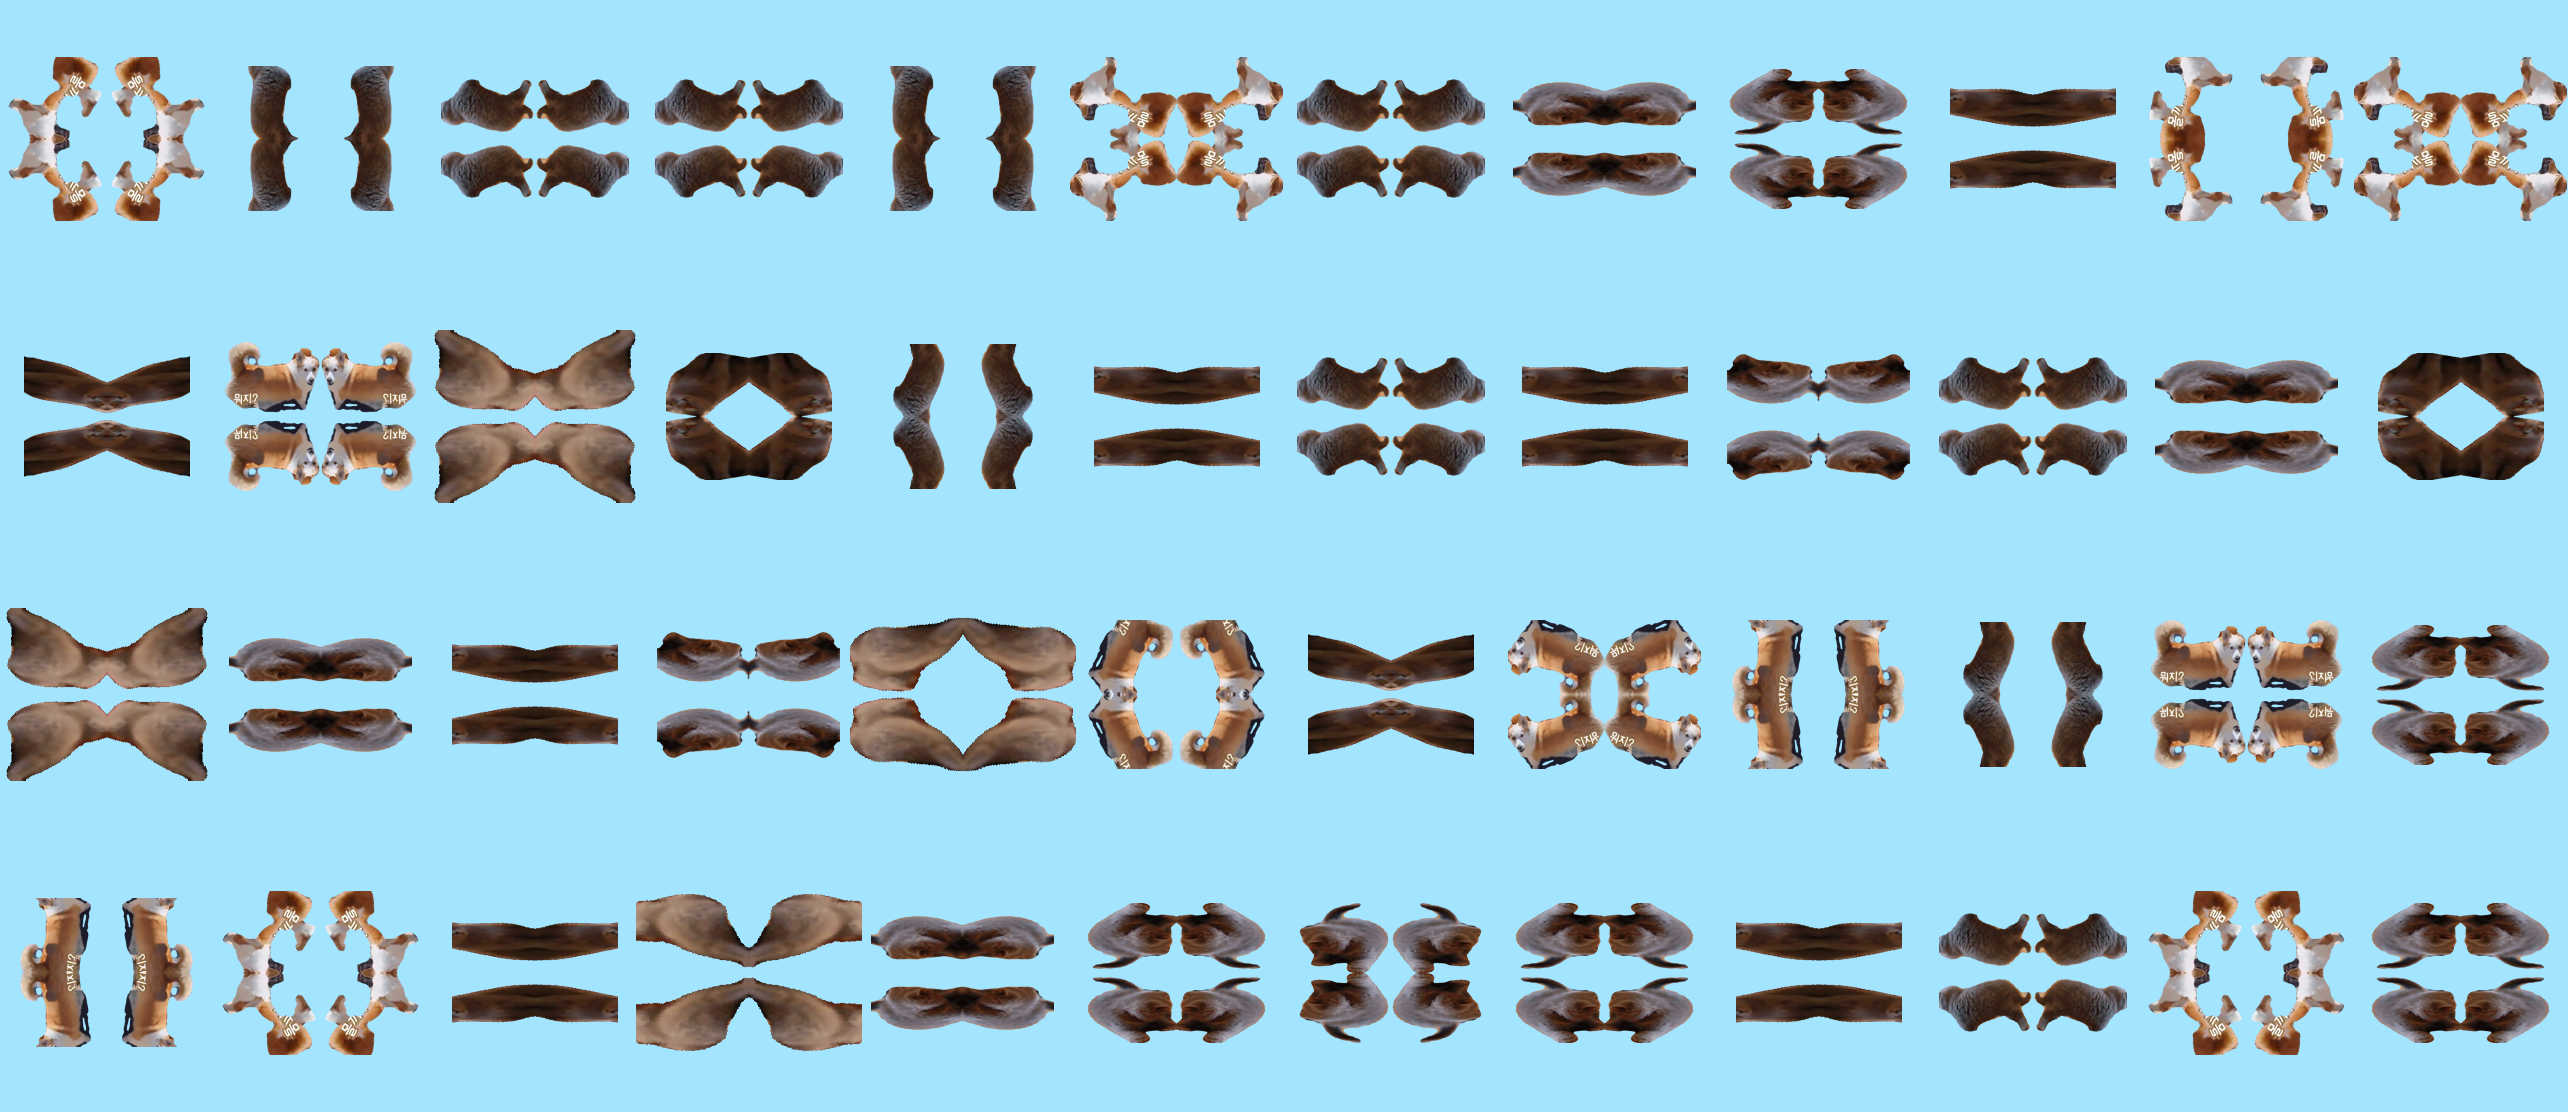
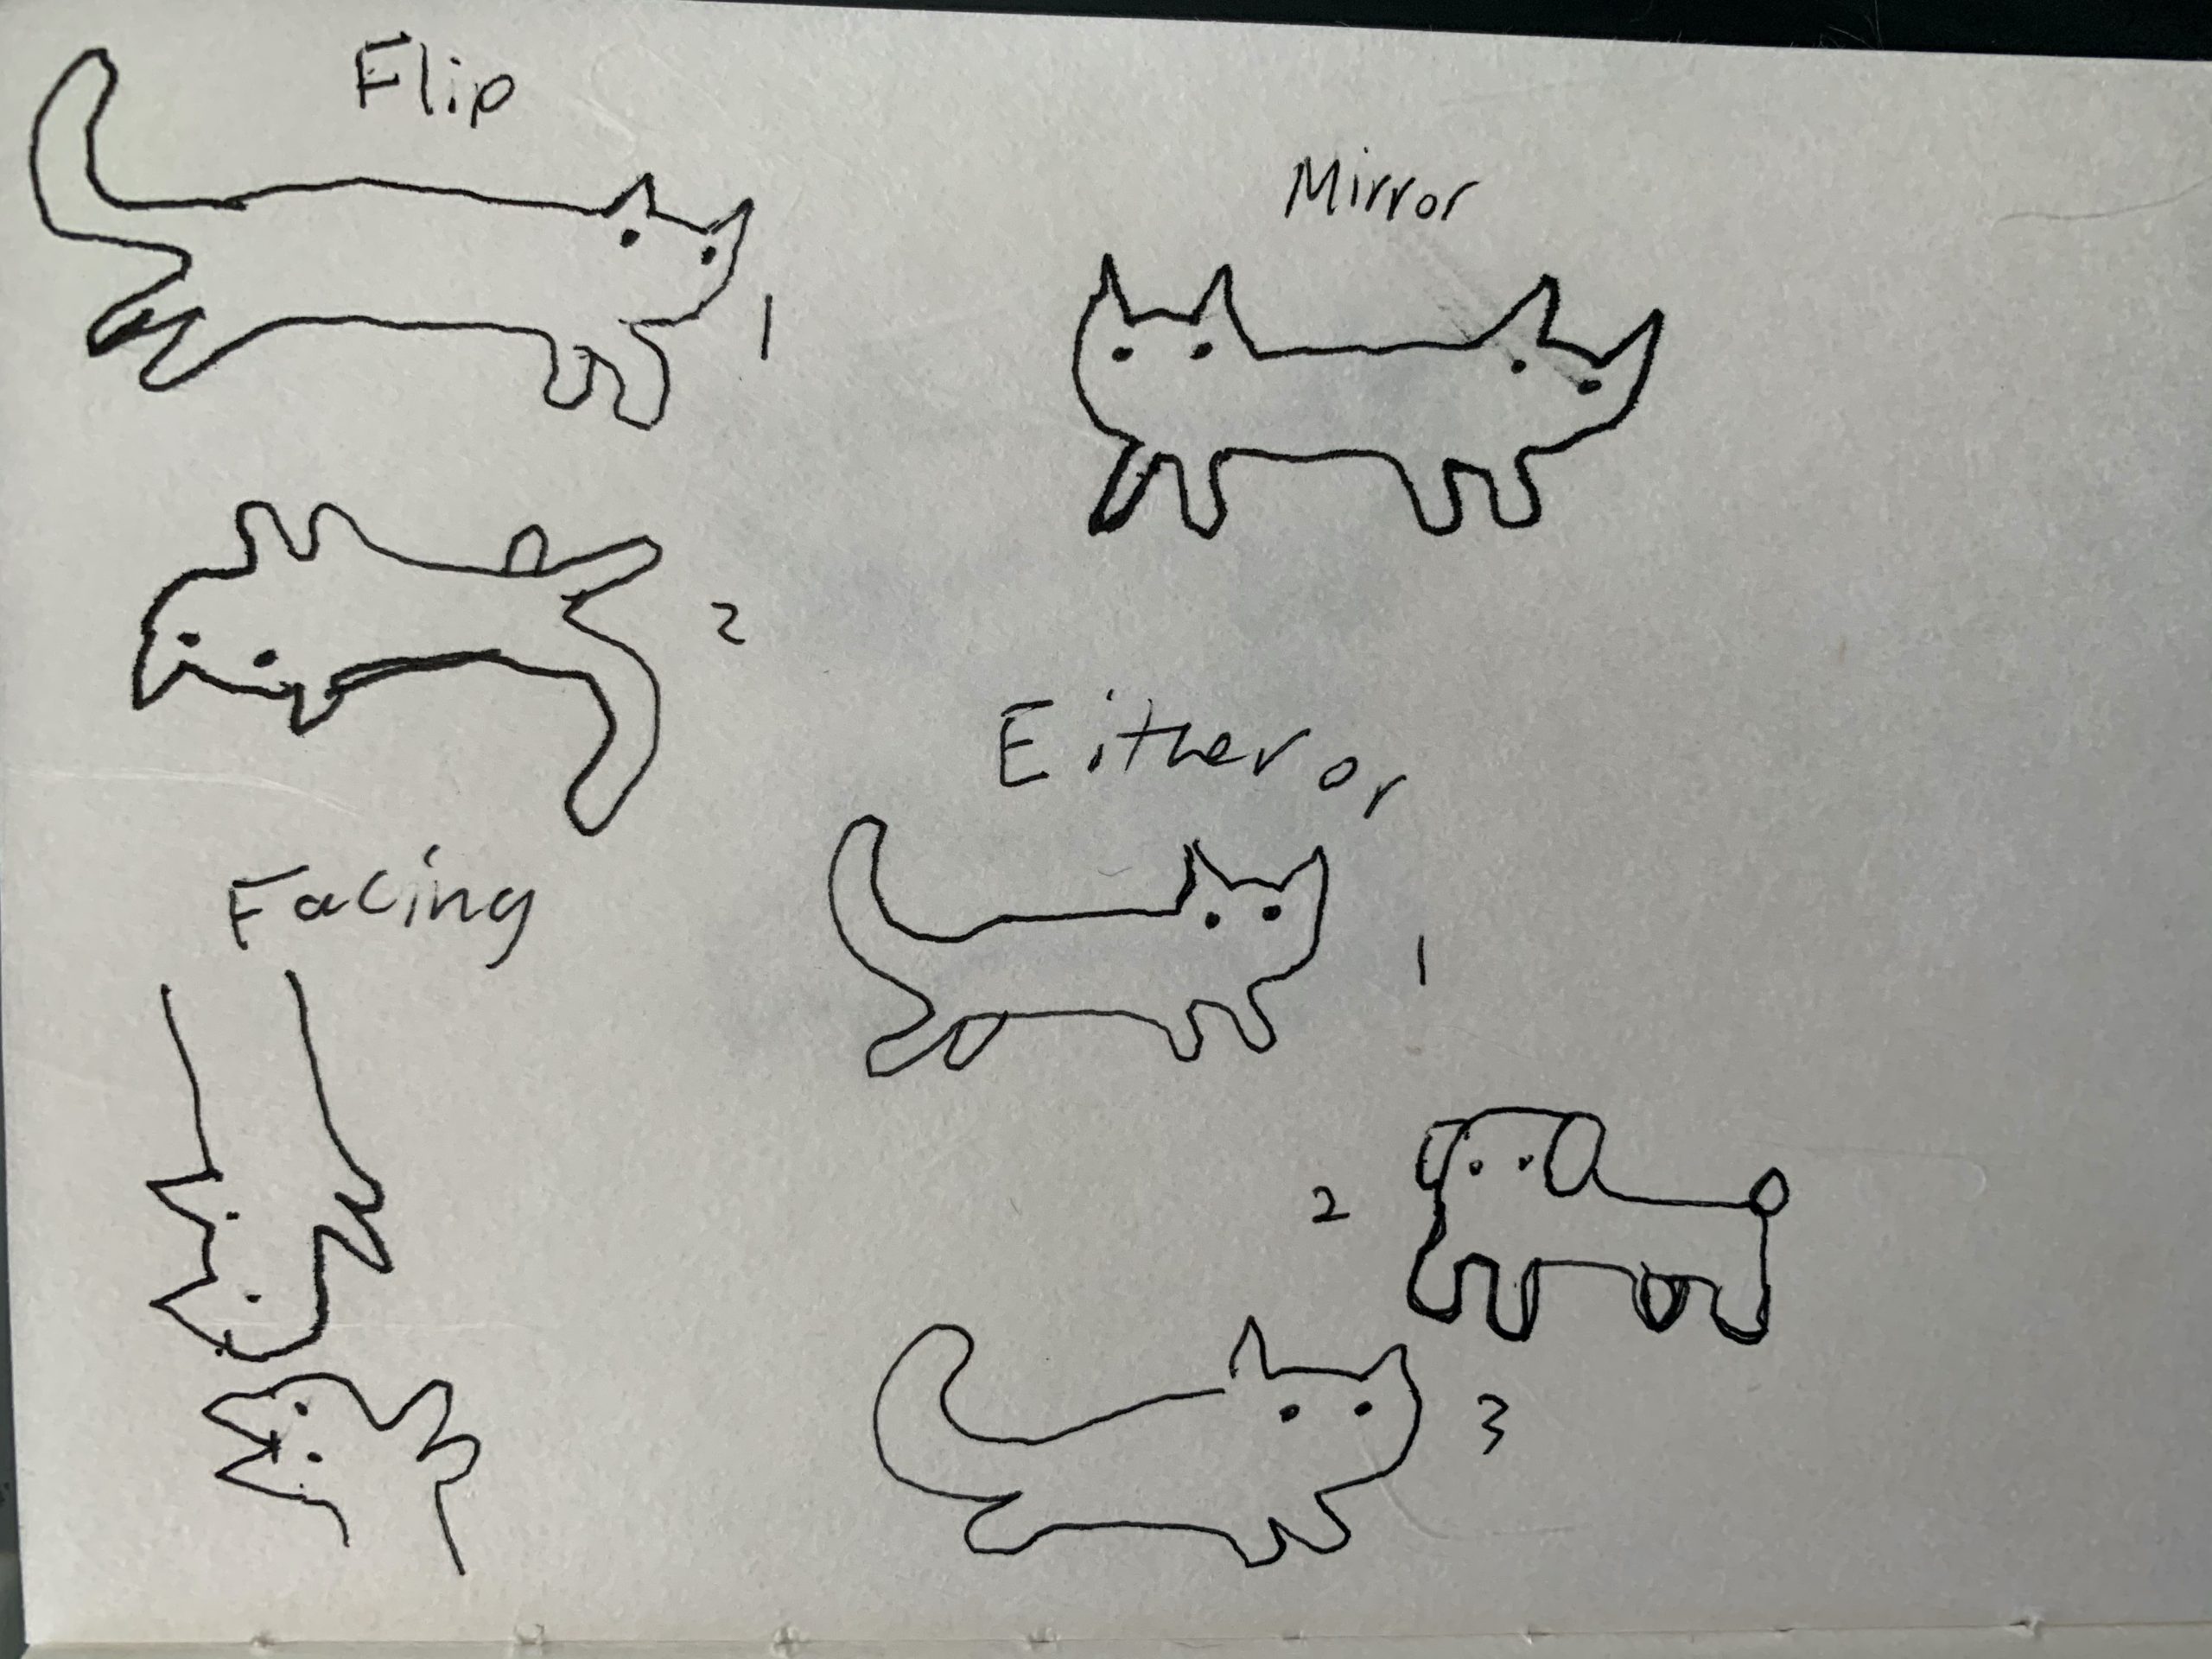
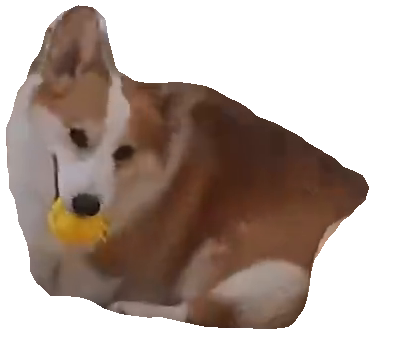
A project to turn cats and dogs into tiled wallpapers.
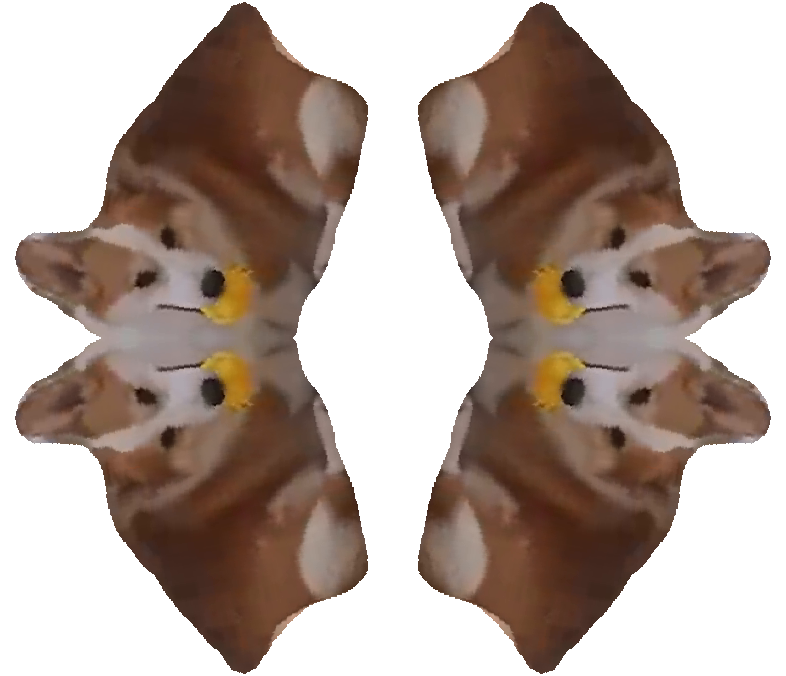
This project is a technical and artistic exploration in creating tiled wallpapers using Detectron2 to segment cute animal videos. The project lives in a Google Colab notebook, where one can paste a YouTube video link, and a random frame from the video will be pulled, which is then used to generate the collage. At the end of the process, a media object is created using the segmented images.
Throughout the semester, I have been interested in the role of data, machine learning, and APIs in relation to my artistic practice. This focus can be seen with my initial project in the class, which used WPRDC’s Parcels ‘N At database to explore small estates in Pittsburgh, and then locations with the address of 0. I then moved on to machine learning, using Monodepth2 to create a depth visualization of a location that does not exist.
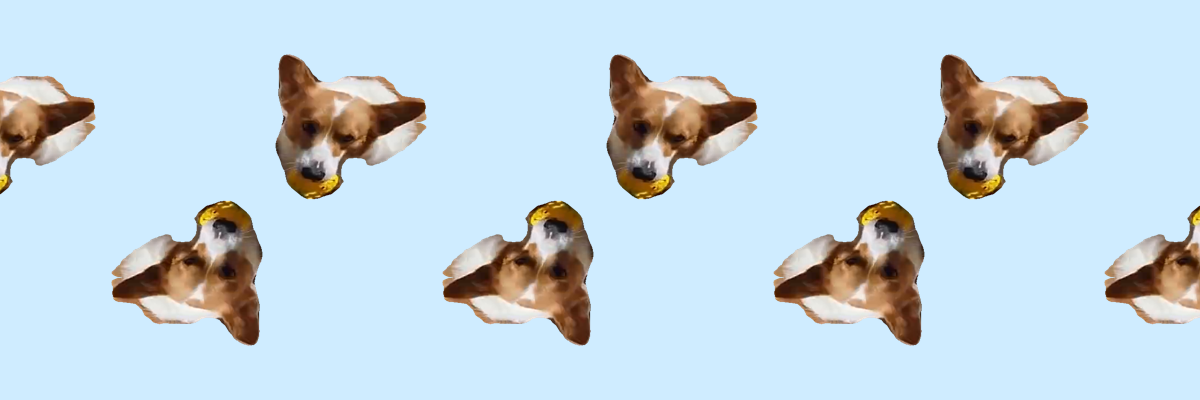
Though I am proud of this work, I did fall short in a few areas. I had originally wanted to create a web interface and run this application as a user facing tool, and still intend to explore the possibility. I also had originally had planned on making it take an ‘interesting’ frame from the video, but right now it picks one at random, meaning I have to occasionally re-roll the image. Overall, I consider the output of the project to be interesting given that it can be read at a far scale as geometric, while close up it becomes novel.
A lot of this project was spent combing through documentation in order to understand input and output data in Numpy and Detectron2.
The input itself is simple enough: using the YouTube-dl Python lib, download a video from a supplied link, run it through FFMPEG, then pull a frame and run Detectron’s segmentation on it. Finally, take those results and use PIL to format them as an image.
However, my experience with Python was more focused on web scraping, data visualization, and using it in conjunction with Houdini or Grasshopper. I did know a little bit about Numpy, which helped when getting started, but actually understanding the data turned out to be a process.
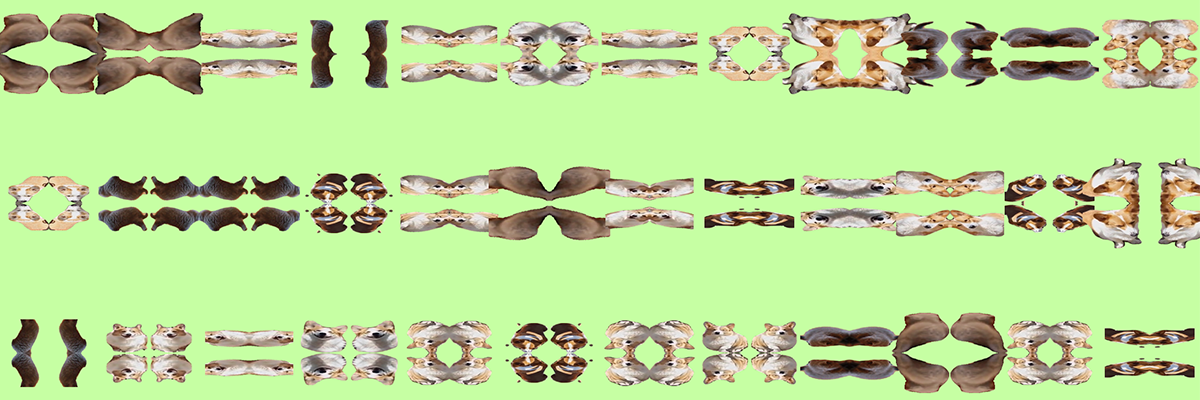
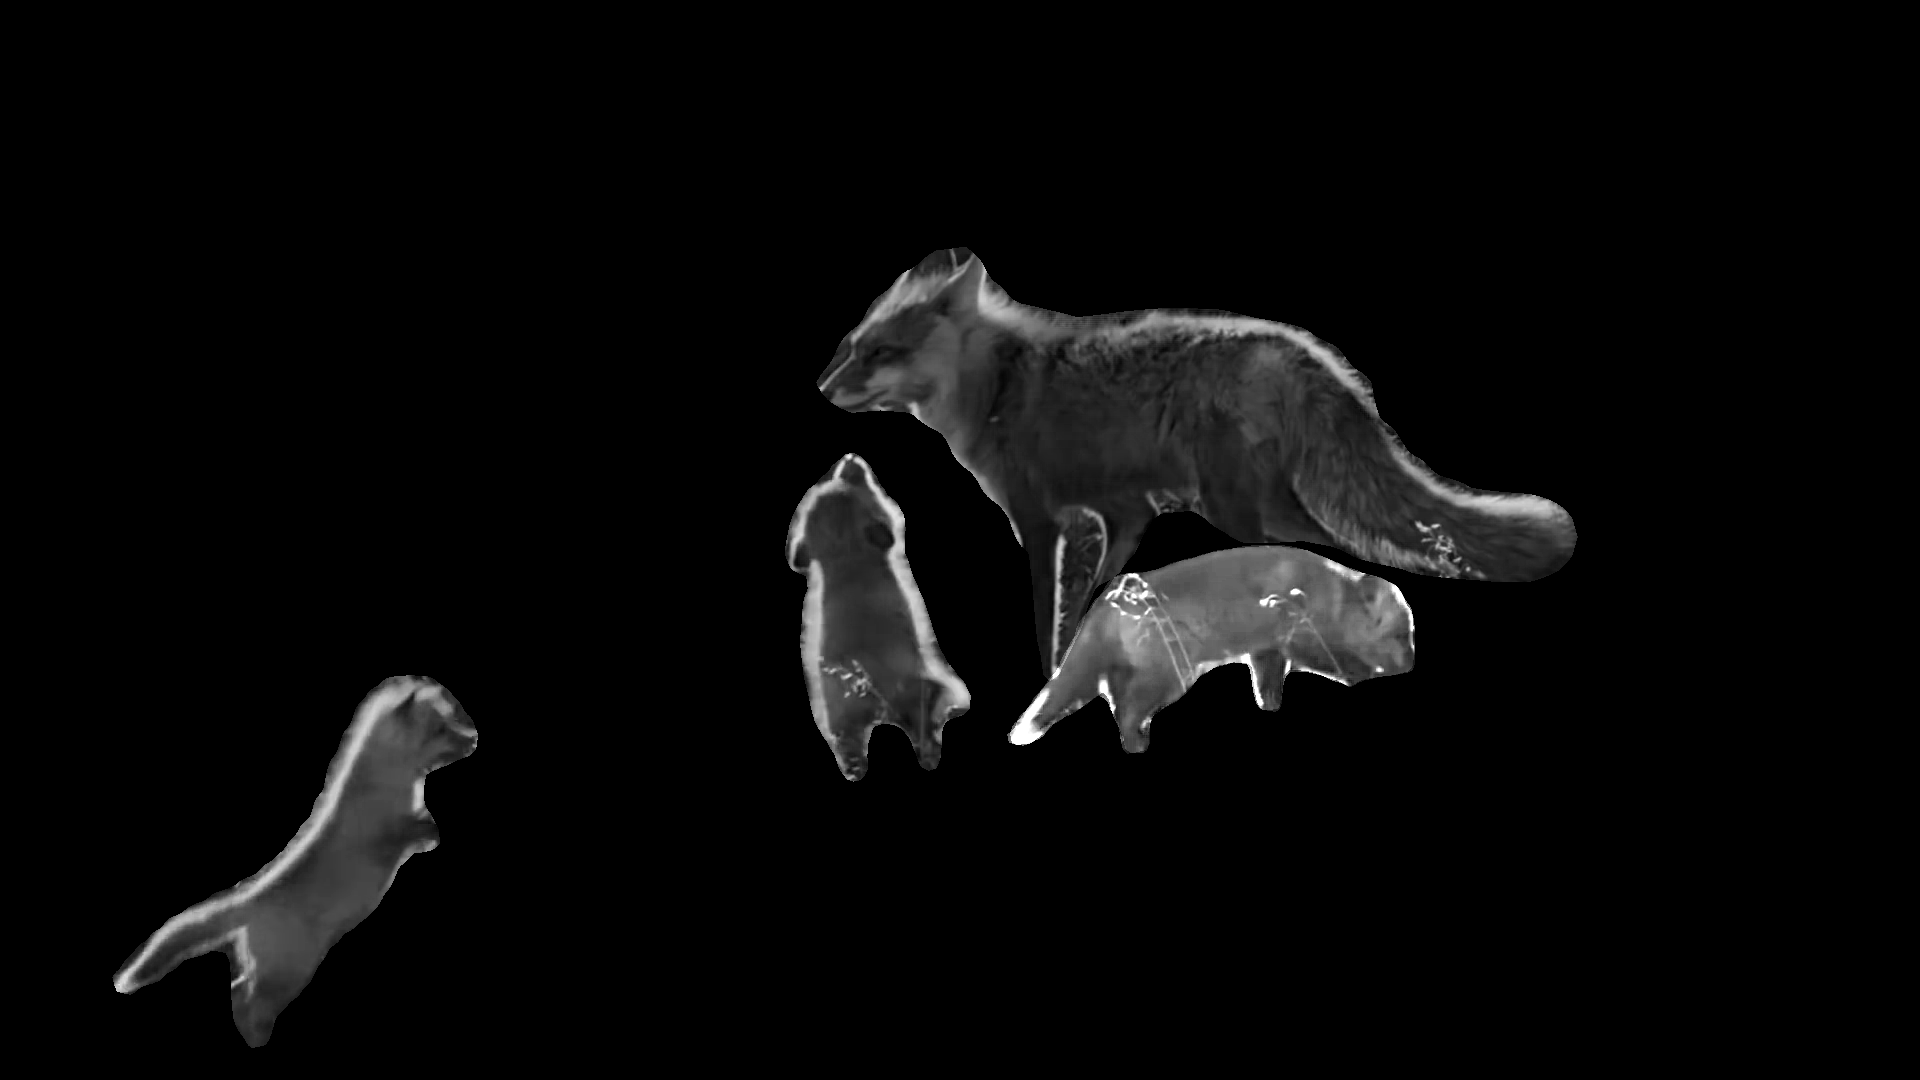
At first, I could only export images in black and white, with no alpha segmentation.
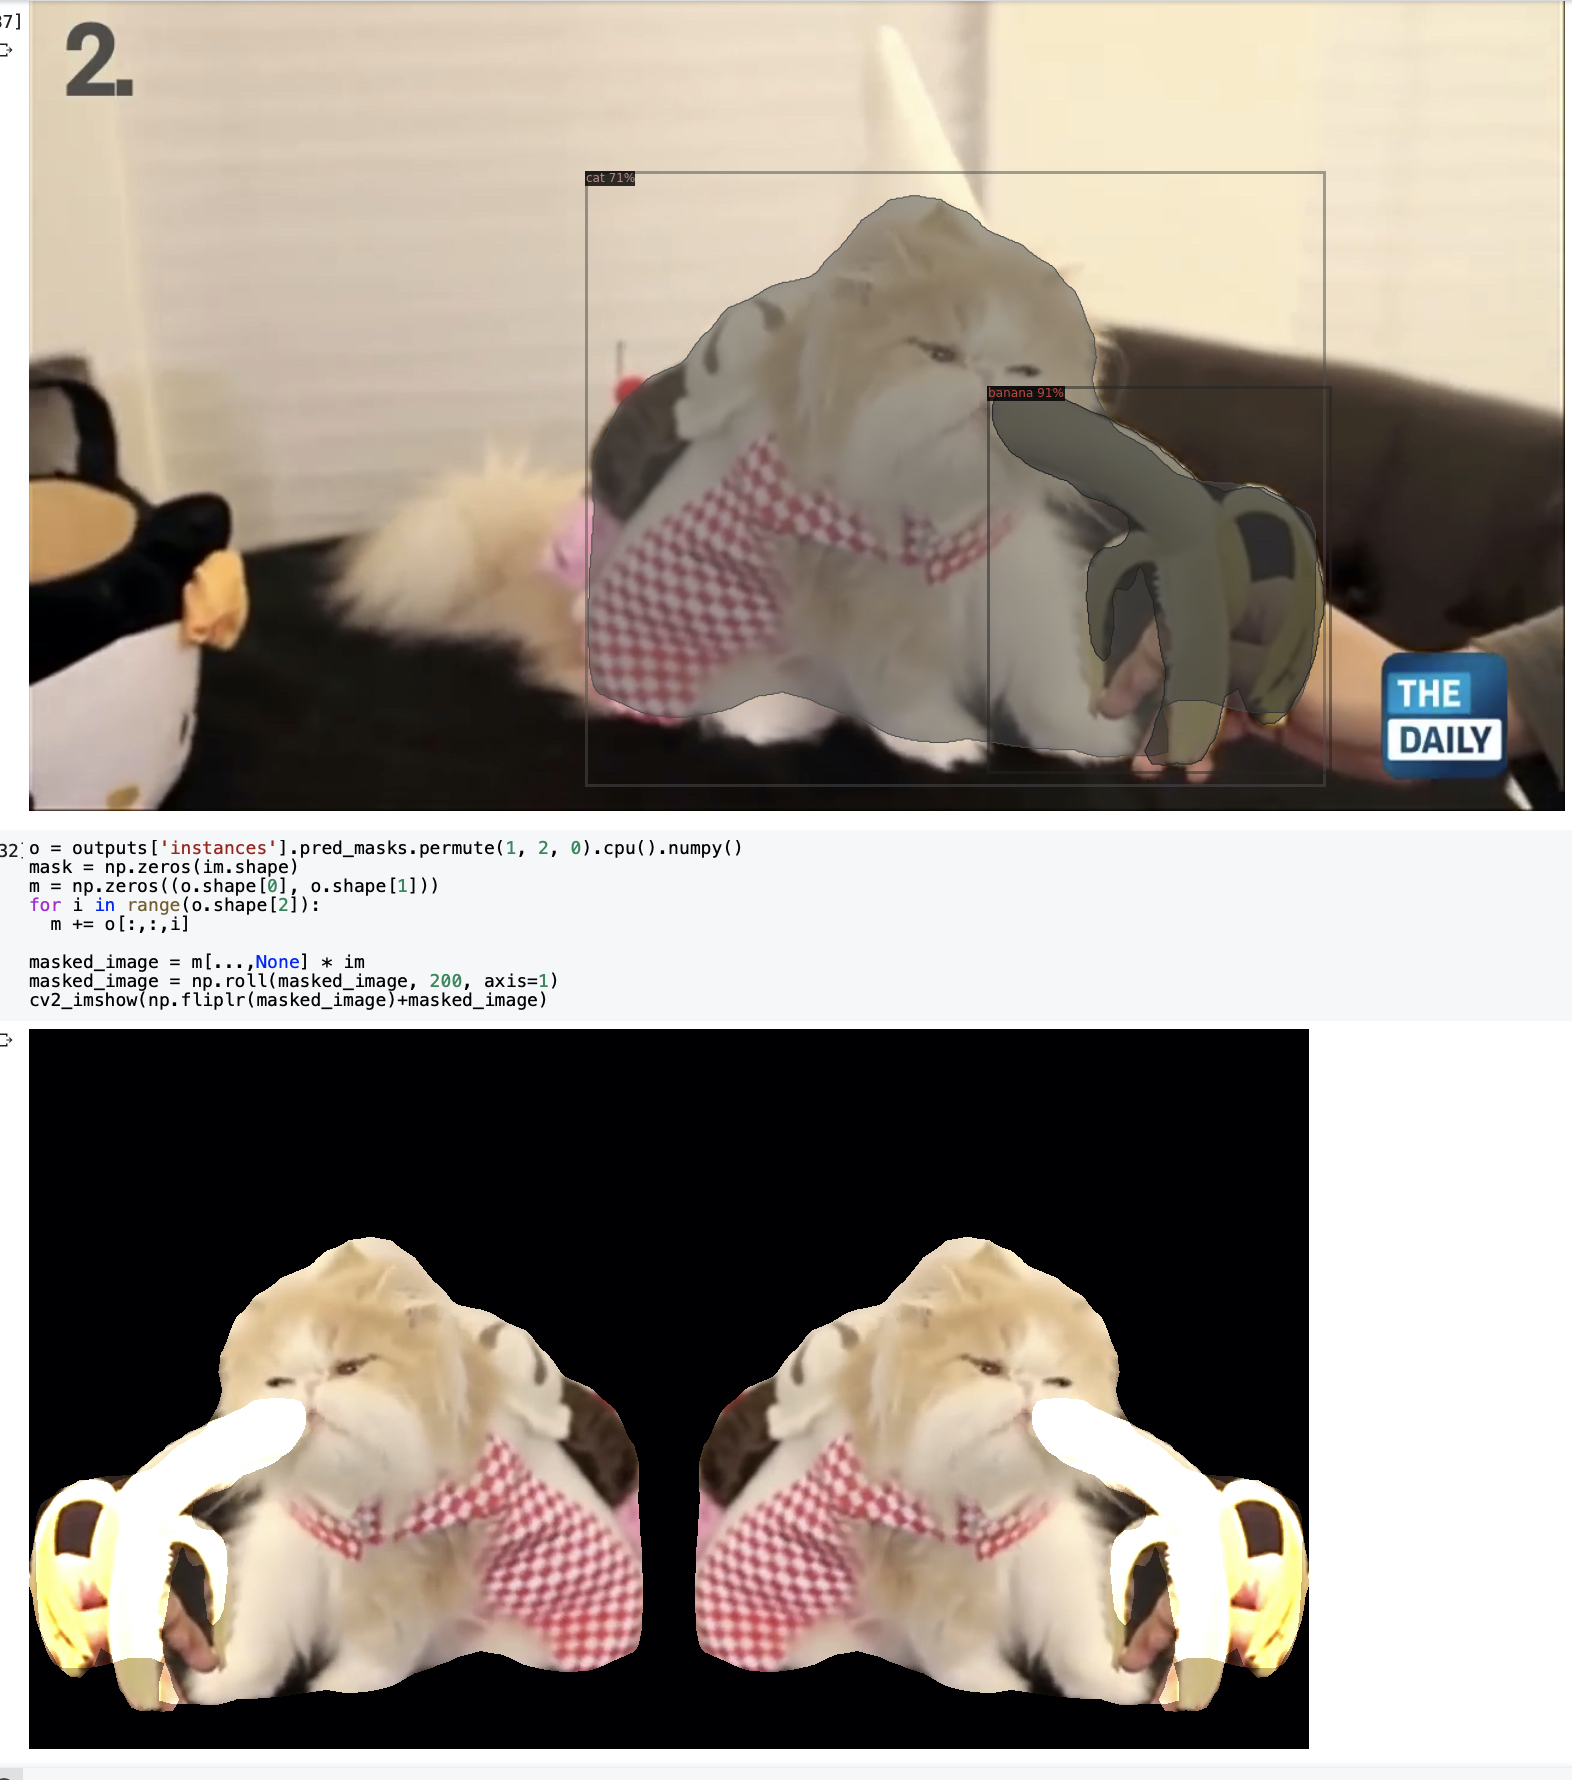
After some help from Connie Ye, I was able to understand more about how Numpy’s matrices pass data around, and started getting actual colorful outputs
At the same time, I also began exploring how to format my output
I also spent a lot of time browsing GitHub trying to understand how to read segment classification from the output of Detectron. As a last little bump in the road, after taking a day off from the project, I forgot that the datasets are organized as (H,W,Color), and spent a while debugging improperly masked images as a result.
After that it was relatively smooth sailing in working through the composition.
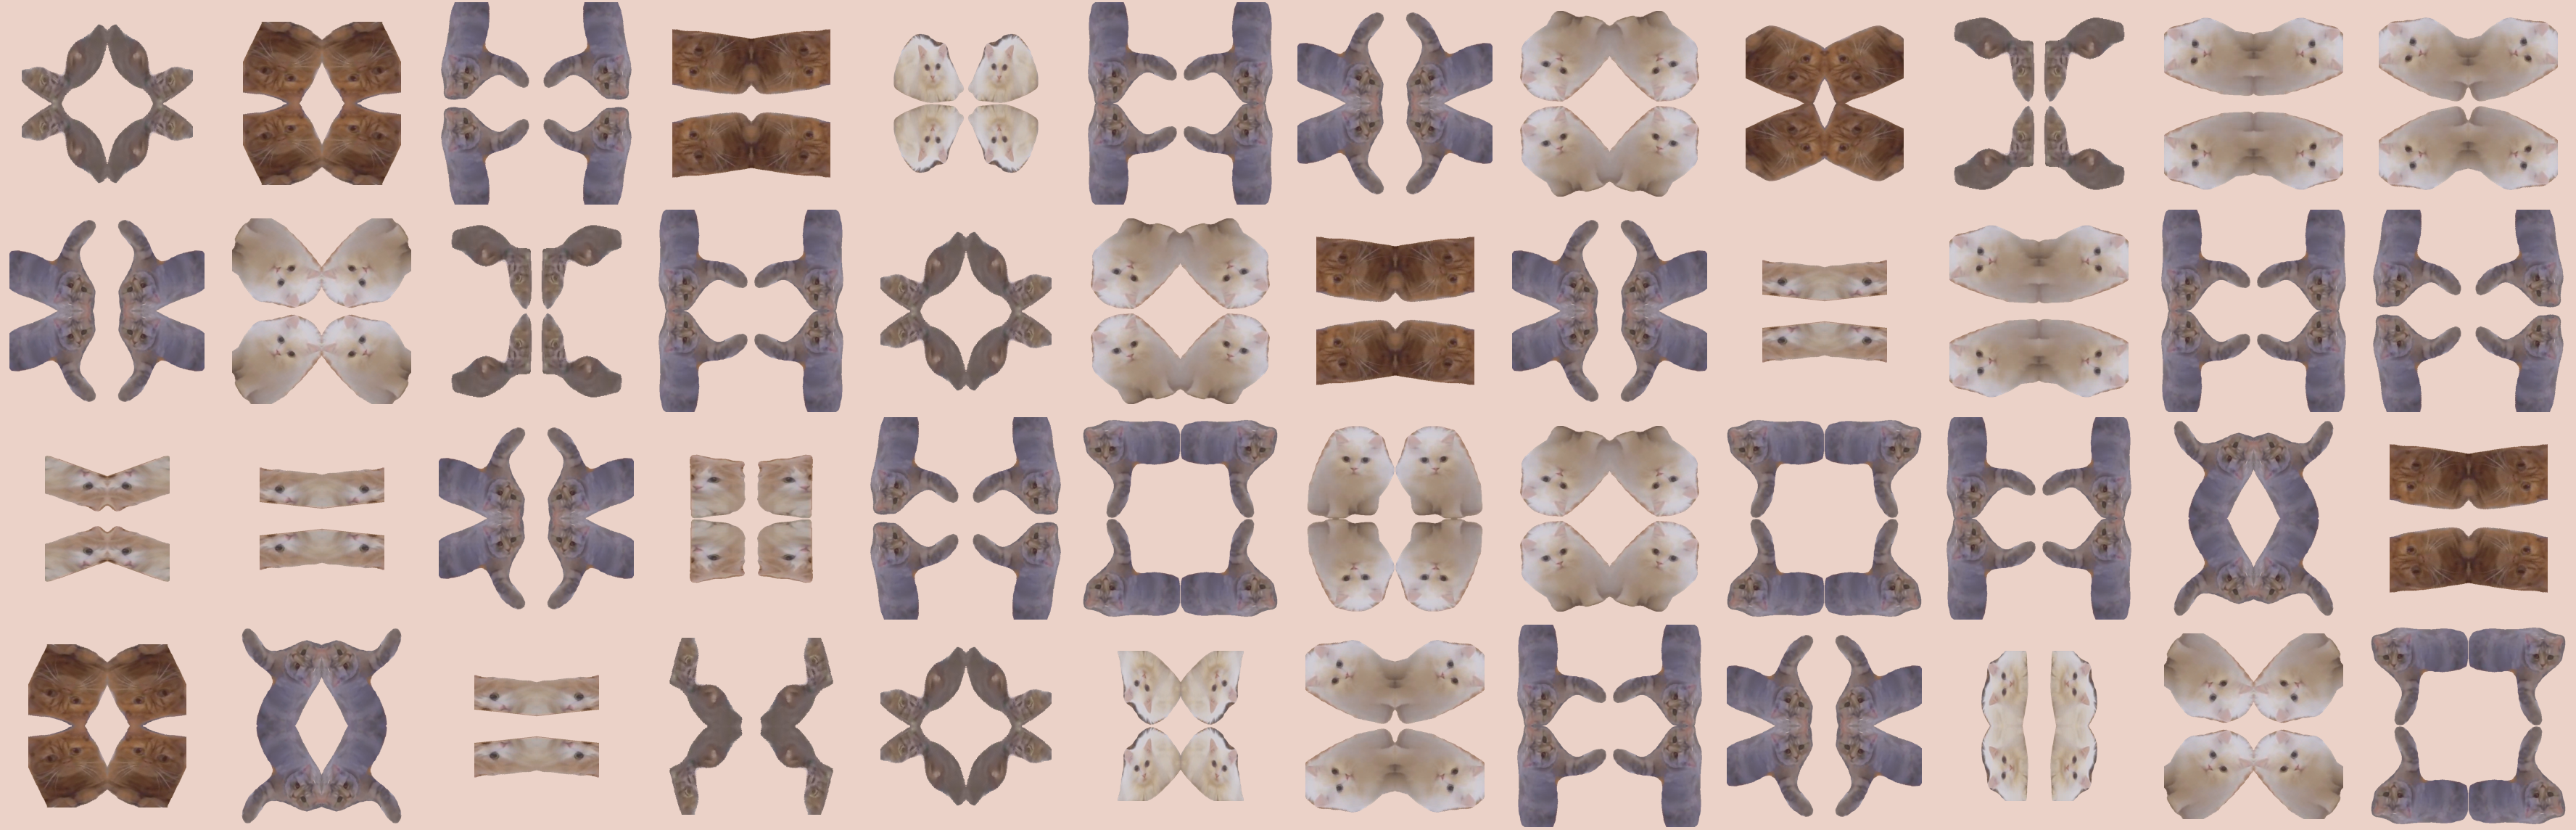
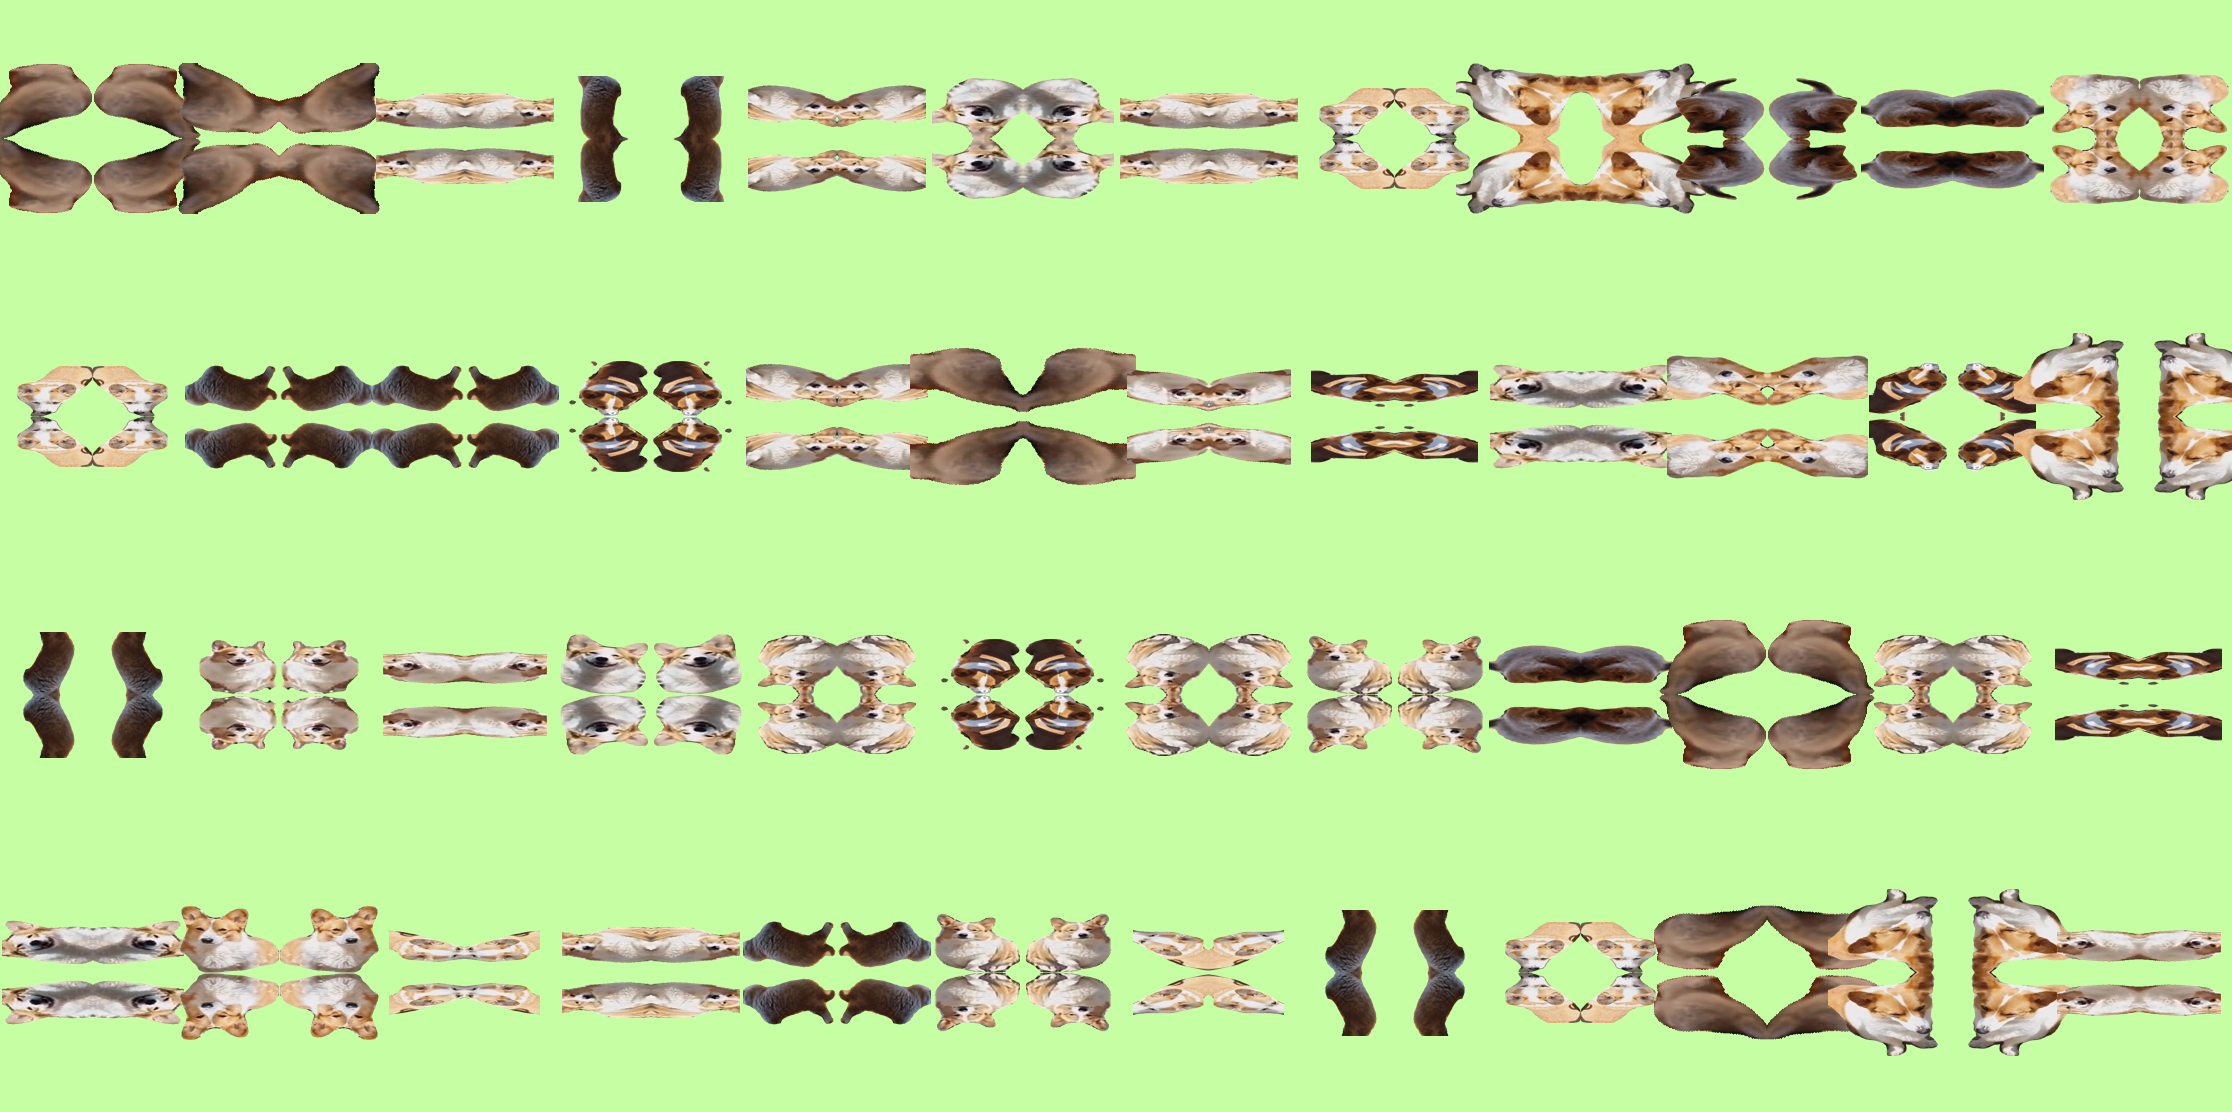
POSTREVIEW UPDATE:
I thought about the criticism I got in the review, and realized I could make the patterns cuter mostly with scale changes. Here are some of the successes
For this project, I (mis)use corporate knowledge transfer methods to make a portrait of my grandfather.
Through it, I get an extremely weird, sometimes unsettling, and usually hilarious point of view on corporate culture.
I’m also able to impose some of my HCI education and push it into a space where it’s not “supposed to go.” I get to see how human-centered design principles (like interview techniques, concept mapping, etc.) hold up against the extremes of the hyper-logical and the hyper-personal.
Background
(In all seriousness) I have one grandparent left, and we’ve gotten closer over the last few years. He expresses some regret over not having been an active part of my childhood (thanks to living on opposite ends of the country). I want to help close this gap, find a way to capture his wisdom, and consider the knowledge-based “heirlooms” he might be passing down.
What do we do in the face of this problem? We turn to the experts. When you google “intergenerational knowledge transfer” or even “family knowledge transfer,” all I found was corporate knowledge transfer methods. What happens if I apply these methods to my family as if it were an organization?
———————-
Method
Method derived from: Ermine, Jean-Louis. (2010). Knowledge Crash and Knowledge Management. International journal of knowledge and systems science (IJKSS). 1. 10.4018/jkss.2010100105.
password: excap20
Phase I: Strategic analysis of the Knowledge Capital.
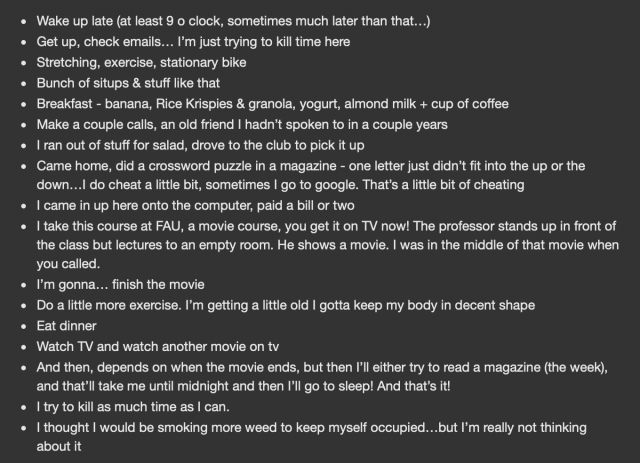
First, identify the Knowledge Capital. One day, I called my grandpa and gathered a list of every single thing he had done that day.
I also supplemented this list with some more characteristics, gathered through a call with my sister.
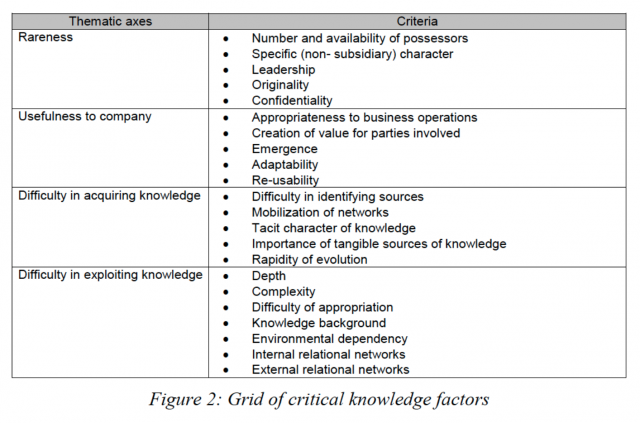
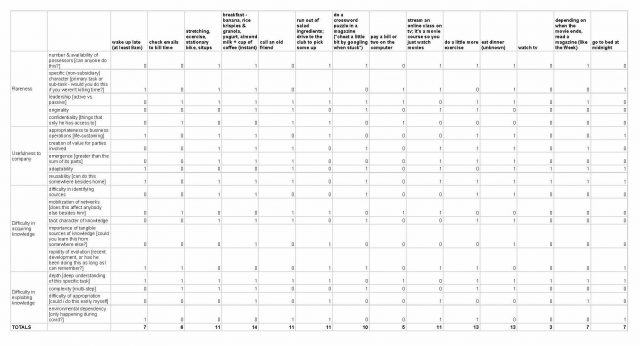
Next, perform an “audit” to identify the knowledge domains that are most critical, by using the following metrics:
every domain gets a score; the highest score is the most critical knowledge domain.
The results show that making breakfast is the most critical knowledge domain (with a high score of 14). I’m not surprised at all. It’s an incredibly specific ritual for him – he has been making the same bowl of cereal, 7 days a week, for at least 30 years. It’s in my earliest memories of him (even when he was visiting us in Colorado, we would make sure we had all the ingredients on hand). It’s interesting that the “knowledge audit” managed to capture the salience of this task as well.
Phase 2: Capitalization of the Knowledge Capital.
Now that I know the most important knowledge, I convert the tacit knowledge of how to do it into explicit terms. Or, in other words,
“collect this important knowledge in an explicit form to obtain a ‘knowledge corpus’ that is structured and tangible, which shall be the essential resource of any knowledge transfer device. This is called ‘capitalisation,’ as it puts a part of the Knowledge Capital, which was up to now invisible, into a tangible form.”
As a fun aside, the last line there is essentially the business-speak definition of “experimental capture” – bringing something that was invisible into tangible form.
To “capitalize the knowledge capital” (not a joke – this is what it’s actually called), the literature calls for the use of “graphical models,” and give several examples such as the phenomena model, activity model, concept model, task model, and history model.
Before making the model, it’s important to interview the stakeholders. I relied on interview techniques from my research background, as well as some inspiration from Rachel Strickland’s Portable Portraits, and conducted a contextual inquiry over FaceTime where I asked my grandpa to walk me through making breakfast in excruciating detail. (Arguably the hardest part of this whole capture was remotely helping a 89-year old figure out how to flip the camera view 🙂 ).
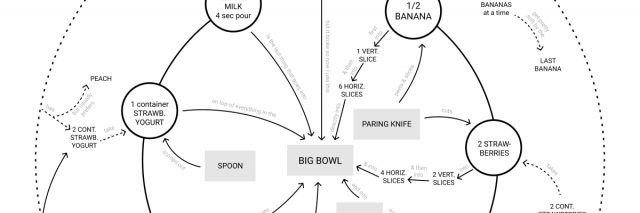
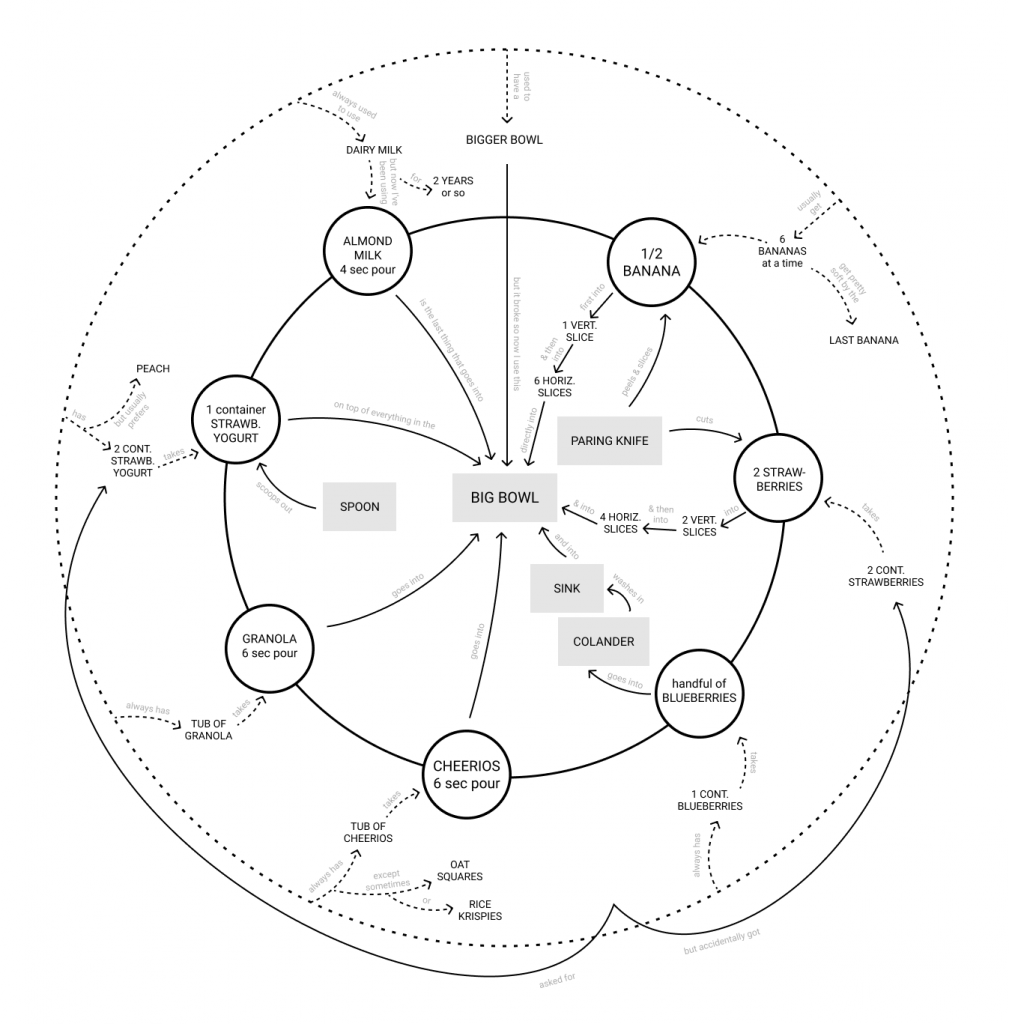
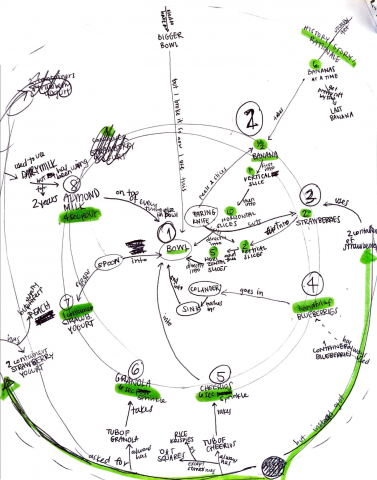
Next, as I am the knowledge corpus (literally), I needed to convert the tacit knowledge I had learned into an explicit model. I chose to make a concept map.
Concept maps appear not only in the KM literature but also in my HCI curriculum. Each field has a slightly different definition, but overall, concept maps are meant to be highly structured & methodical to articulate a user’s mental model in a specific situation. Each element in the map must be a noun, and every arrow must be a verb.
Counterintuitively, it’s the constraints that allow strong stories to emerge. We are taught this in HCI, and I am really taking that and pushing it to the limit here. To what extent can I tell a hyper-personal story within the strict constraints of a concept map?
Each word is a noun; each arrow is a verb that shows the flow of information. Despite these strict rules, one can follow a personal story (complete with direct grandpa quotes) throughout the diagram.
Phase 3: Transfer of the Knowledge Capital
I completed a capture for one specific task. The next step would be to repeat this capturing-and-modeling process for a whole series of critical knowledge domains. With all the models together, the organization goes on to create a “Knowledge Book” (or “Knowledge Portal” if it’s online) where it can be disseminated to new employees.
reflection
Beyond having some fun with corporate literature, using (or mis-using) these highly structured tools are an opportunity for me to critique my academic background. I don’t get a lot of opportunities to do this, so I loved being able to push up on the edge of user research tactics in ways that would probably not fly in my career.
I often struggle to position myself within my field and feel generally suspended between art, design, and tech. This project was not incredibly profound or anything, but it was a way of placing myself directly between two emotional extremes and sort of navigating that ambiguous space, all within the nice constraints of a single quotidian task.
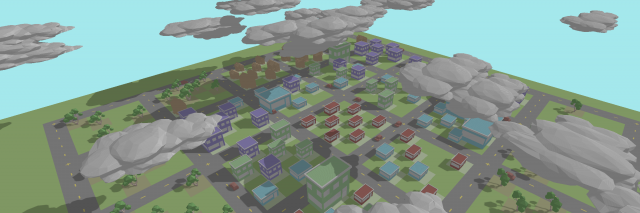
Description: Your browsing history says a lot about you. What if there was a way to visualize it? Take a look at all the pure (and not so pure) things you’ve been up to in a city-like visualization of your history.
 ____________________________________________

 all of the received faxes laid out on the floor