Typology – Population Flux

Population Flux is a typology machine that measures the different population trends of people in rooms and how people tend to move in and out of rooms (individual/group) in order for viewers to see how busy rooms are at certain times. I built a machine that would save the relative times when people would enter a given room, and use a graphics API to visualize the data.

Check out the GitHub Repo here.

– Setup – [TLDR Shorter Setup Description in Discussion Section]

The entire operation only requires 3 terminal launches! (serial port reader, web socket connection, localhost spawning). A roadmap of the communication layout is provided below.

Layout of the data-transfer operations. Terminals need to be set up to listen from the serial port, transmit data over a web socket, and launch a localhost to view the visualization. The serial port terminal can be run independently to first capture the data, while the other two terminals can be run to parse and visualize the results.

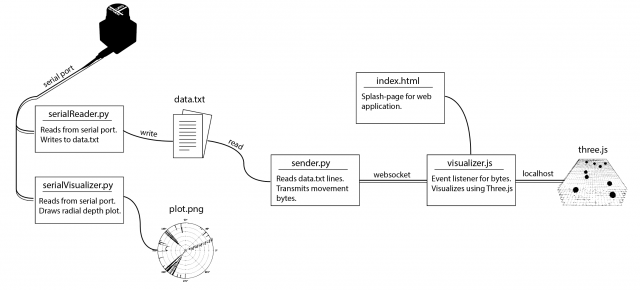
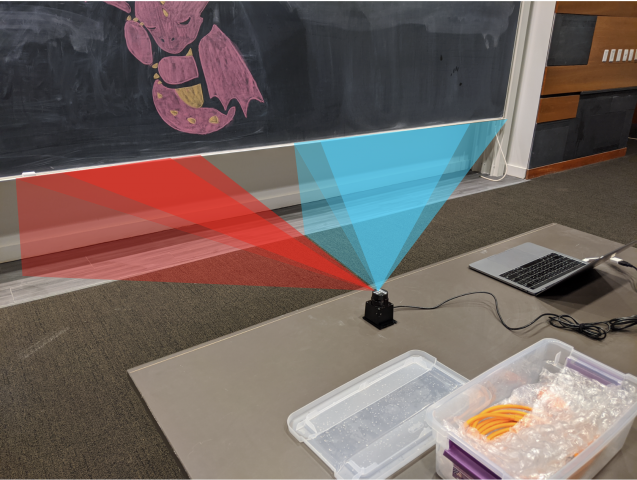
The involved setup was a Hokuyo URG Lidar connected to a laptop. The Lidar provided a stream of ~700 floats uniformly around 270 degrees at a rate of 10 times a second. In order to capture the data, I used the pyURG library to read directly from the serial port of the USB-hub where the Lidar was connected to. Unfortunately the interface is written for python2 and required substantial refactoring for python3 (the serial library that pyURG uses requires users to send bit-encoded messages with python3, which requires additional encoding/decoding schemes to get working with python3).
On startup, the program averages 10 captures in order to capture the room’s geometry. While the program reads from the Lidar, any data captured will have the initial room’s geometry subtracted from it so that all distances are negative (this is based on the assumption that the scene’s geometry does not change over time).

When a person walks at degree angle d in front of the Lidar, then region around d will return closer distances than before, and the resulting data after subtracting the scene’s geometry will be a wide negative peak at degree d. In order to get this exact location d, the data from each frame is sequentially parsed in an attempt to find the widest peak. Thus, at each frame, we can capture the location (in degrees) of any person walking in front of the Lidar.

Field of View of Lidar. EnAA and ExAA add the current timestep to the respective enter and exit queue when a person walks by. EnBA and ExBA prevent multiple writes to each queue when a person stands in the corresponding active area by preventing any additional writes to either queue until the person leaves the bounding area.

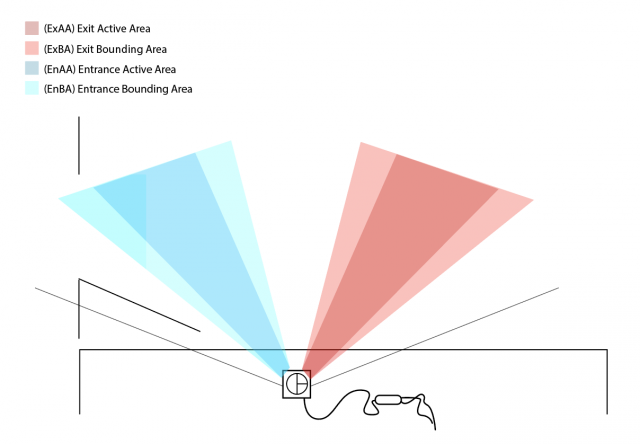
The next step is to determine the direction of movement, as it can be used to determine whether a person enters or exit a room. The Lidar’s view was discretized into 2 regions: the Entrance Active Area (EnAA) and Exit Active Area (ExAA), each containing a range of valid degrees that the area encased. When the user walked into EnAA, the program would push onto an entrance queue the timestamp of the detection, and when the user walked into ExAA, the program pushed the timestamp onto the exit queue. When both queues had at least one value on them, the first values were popped off and compared. If the enter timestamp was less than the exit timestamp, then the program would write the action as an “enter”. Otherwise, it would be written as an “exit”, along with the most recent timestamp of the two.
The biggest errors that would arise from this is getting multiple entrance timestamps added to the queue everytime a person stood in EnAA. To resolve this, a few steps were taken:

    • Include booleans indicating if you are in EnAA or ExAA. The boolean would be turned on when first entering the area, and kept on to prevent multiple timestamps to be added to the queue.
    • Add an Entrance Bounding Box (EnBA) Exit Bounding Box (ExBA) that were wider than EnAA and ExAA respectively. The booleans would only turn off when you exit these areas as to prevent multiple timestamps from being added to the queue if you’re on the edge of EnAA.
    • Clear the queues once a person leaves the field of view of the Lidar. Originally if a person walks into EnAA, but turns around and leaves before reaching ExAA, then another person walks from the ExAA towards EnAA, then the program would misclassify it as an “enter” since it would compare the first EnAA timestamp of the person who turned around to the ExAA timestamp. Resetting the queue would prevent this issue.
Physical setup of device. Active and Bounding Areas are visualized to show the detective region. These regions are intentionally made wide so that fast movement can still be picked up by the sensor. Each room has a unique geometry, and the span of each area can be adjust per room (if room entrances are more narrow or wider than others).

The resulting data was written to a text file in the form “[path,timestep]” where path was a boolean [0,1] indicating an enter or exit, and timestamp was the frame number in which the detection was made. Another python file would then read from the text file. It would then connect over web socket to the javascript visualization file and send over a series of bits denoting the number of enter and exit movements at any given timestep. The python script would do this by keeping track of the time of execution of the program, and anytime the timestamp of a particular datapoint was surpassed by the program’s time, then that point (0 for enter, 1 for exit) was added to the data stream and sent over web socket to the javascript file. This would allow users to replay pre-captured data in realtime, or speedup the playback by scaling up/down timesteps.
The javascript visualization was done in Three.js. Using a web socket listener, any incoming data would trigger the generation of new spheres that would be animated into the room. This way, viewers could see not only the number of people, but at what points people enter/exit the room, and if they move individually or all at once.

– Data –

The following data was captured over ~1-1.5 hour periods to measure the population traffic of rooms at different times.

Dorm Room [30x speedup]

Studio Space (Class-time) [30x speedup]

Studio Space (Night-time) [30x speedup]

– Discussion –

  • What was your research question or hypothesis?
    • What is the population density of a specific room at any given time? Do people tend to move in groups or individually? When are rooms actually free or available?
  • What were your inspirations?
    • This project was inspired by many of the building visualizations in spy movies and video games where you could find how dense certain rooms were at certain times.
  • How did you develop your project? Describe your machine or workflow in detail, including diagrams if necessary. What was more complex than you thought? What was easier?
    • The setup involved parsing incoming Lidar data to detect peaks, which would indicate the location of any passing people. The Lidar’s field of view was divided into an entrance and exit side, where if any peak passed through the entrance first, then it would classify the result as an “entrance”, otherwise an “exit”. The resulting data was stored in a text file and parsed by another python file before transferring over to a javascript visualization built on Three.js. The complex part was trying to get the data, as I was never able to get the OSC data outside of the receiver, so I ended up building my own layout for reading and transmitting the data. The easier part was getting the web socket set up considering it worked on the first try.
  • In what ways is your presentation (and the process by which you made it) specific to your subject? Why did you choose those tools/processes for this subject?
    • Determining if a person walks by isn’t very difficult, but determining the direction requires at least two datapoints. Luckily, Lidar offers more than 700 datapoints that can be divided into an entrance/exit region. This provides multiple points for each region, so if the subject moves quickly, the Lidar has a large field of view to detect the person. Three.js was used as the visualization scheme since it was easy to set up and convert to a web app.
  • Evaluate your project. In what ways did you succeed, or fail? What opportunities remain?
    • The project succeeded in being able to communicate the data from the Lidar all the way to the visualizer (and in real time!). This was overall tricky since there was a lot of processing done to the data, yet in the end there was a continuous stream of data with low latency being provided to the visualizer. One of the hardest part of the project was getting clear data from the Lidar. The device itself is very noisy, and I spent a lot of time trying to de-noise the output, but noise would still remain. One opportunity that still remained is advancing the visualization aspect. If I had more time, I would make a more complex room layout that would be more representative of the room geometry than just a green rectangle. This wouldn’t be difficult to do, just time consuming since it would require modeling.

Shapes of Love

For my typology, I objectified “I love you”.

(I would have separated the models into their own 3D viewers, but Sketchfab only allows one upload per month.)

I created 3D sculptures out of the shape that one’s mouth makes over time as they speak the words “I love you” in their first language.

Background

As I’ve watched myself fully commit to art over the last few months, I’ve realized that my practice—and, really, my purpose as a human—is about connecting people. I love people. I love their feelings and their passions, listening to their stories, working together, and making memories. I love love. I want people to experience the exhilaration, sadness, anger, jealousy, and every single powerful emotion that stems from love and empathy.

Having this realization was quite refreshing, as for the last year and I half I have been debating over various BXA programs, majors, minors, and labels. But no longer–I am proudly a creator, and I want to create for people.

Therefore, this project represents both my introduction to the art world as a confident and driven artist and a symbol of my appreciation for those who have helped me get to this point in my life. The people I love are the reason I live, so I wanted to create something that allowed other people to express that same feeling.

method

My typology machine is quite obnoxious, and the journey I took to figure it out was long.

First, I tested everything on myself.

I recorded myself saying “I love you”.

I originally wanted to do everything with a script based on FaceOSC. I wrote such a script, which took a path to a video file and extracted and saved an image of the shape of the lips and the space inside the lips for every frame.

My fear for this method was true: I felt there were not enough keypoints around the lips to provide distinct enough lip-shape intricacies from person to person. Plus FaceOSC is not perfect, so some of the frames had glitched and produced incorrect lip-shapes. This would not do when it came to stitching everything into a 3D model. From here I decided to do it all manually.

Most of these “I love you” videos broke down into about 40 frames, and if not I used every other frame to trim it down.

I opened every single frame of each video in Illustrator, traced the inside of the mouth with the pen tool, and saved all the shapes as DXF files.

I did this on my own mouth first, but here is Pol’s. At this point I wasn’t sure whether I would be laser cutting or 3D printing for the final product, but I knew laser cutting would be the fastest way to create a prototype, so I compiled all the shapes of my mouth onto one DXF and laser cut them all in cardboard.

I thought the stacking method would be cool, but it was not. I did not like the way this looked. At this point I buckled down and prepared myself for the time required to 3D print.

To do this, I manually stacked all the lip-shapes in Blender and stitched them together to create a model.

With the first two models I made, I printed them at a very small scale (20mm).

I was definitely happier, but they needed to be bigger.

Finally, I printed them at the size they are at now, which took 12 hours. One incredibly frustrating thing I did not document was the fact that the scaffolding accidentally melded to the actual model, so I spent an hour ripping off the plastic with pliers and sanding everything down. And for the finishing touch I spray painted them black, and attached them to little stands.

Cassie (English)

Policarpo (Spanish)

Ilona (Lithuanian)

discussion

One of the most interesting aspects of this project is that it exemplifies the idiosyncrasies of the ways we communicate. As you can see, some people’s mouths are long and some are short; some enunciate a lot while others don’t; some talk symmetrically while others don’t. So not only are the sculptures physical representations of a mental infatuation, love, but they almost become portraits of the people from which they came. This is a look into the tendencies of the owner–the emotions they feel, the lies they tell, the passion with which they speak, the culture from which they come all influence the shape of their mouths. These sculptures tell the unique story about a person and their connection with the recipient of their “I love you”. As a result, no two sculptures can be the same.

Unfortunately, the manual nature of this process, plus waiting for the 3D printing, allowed me to create only 3 sculptures for the deadline. However, I am definitely not finished with this project.

Blink Typology Proposal

1.) Does Genre change rate of blinking? ie Do Action and Horror illicit more blinking than Drama?

2.) Are there obvious moments where one expects a blink would occur? ie at jumpscares or at ‘obvious’ edits?

3.) The idea of what is missed, collect the footage/frames missed when people blink as a typology

I essentially want to make a typology of blinking typologies.


Typology of Table Mannered Squirrels

I am creating a system to capture at ‘human speed’ videos/images of the small animals in my backyard (primarily squirrels and the occasional chipmunk) eating at a (squirrel sized) breakfast/lunch/dinner table set up, with fine china.

I was inspired by children’s book illustrations that depict animals coexisting with each other while performing actions modeled off human events.

I have been training the squirrels in my backyard to come to a specific location for food, and setting the food on platforms that requires the animals to “sit” in a chair to reach. Their foods are placed among (and within) miniature dining sets. I will be using the high frame rate camera to capture the very fast moments in the hope to catch some actions which mimic human actions. In the case where mimicry does not occur, I believe there will be an element of humor in the “mishandling” of the human eating set up.


Typology Machine Proposal

This typology machine will capture recurring forms in architecture around Pittsburgh. I would like to create an animation incorporating photographs of residential and commercial buildings which would be sequenced to create a fluid movement of commonalities through space. I think it’s interesting how we can recognize similar objects as iterations of one another, or iterations of some common master or reference production. This is a property of capitalism that allows for a simulation we take part in where a single idea of a product can be shared with an entire consumer base through its automated reproduction. I’d like to apply this concept to the physical rhythms of architecture, expanding it to a larger and more organized display of repetition.

I was inspired by a similar piece done by video artist Kevin McGloughlin.

In this piece, McGloughlin has taken pieces of these architectural frames (usually kinetic), and composited them into a new collage presenting the patterns in infrastructure as isolated fractals built upon themselves in the new composition.

For my typology I want to only show a series photos I’ve taken rather than compositing something like these. The way that I order and arrange these clips is where the machine comes into play.

I plan on either manually, or automatically finding simple geometric shapes within architectures and labeling a dataset with the combined image and shape data. I would then write a program to find similar shapes across the frames and place these images next to each other in sequence, repositioning, rotating and scaling to match shapes as closely as possible and keep everything in the center of the frame. The result would be a semi fluid animation, rapidly exploring the physical repetitions and commonalities throughout the cities.

Typology of Textures on Everyday Objects through Robot Controlled Photogrammetric Macro Photography

Concept Statement

The theme of my typology is Texture on my Everyday Objects, seen through a high quality macro lens and rendered into three dimensions using Photogrammetry. I interact with a myriad of objects in a single day, often times these are things I carry with me at all time – such as my pencil, sketchbook, or a bone folder – what patterns might emerge if I sample each of these objects and put them on display?


Inspiration

Stills from 20th Century Women

In Mike Mill’s film 20th Century Women there’s a scene in which Abbie, played by Gretta Gerwig, is explaining her most recent photography project to her housemate. The project is a typology of her things: lipstick, a bra, her camera, etc. In the film we see quick cuts between each image, which are composed and lit in the same way but only vary in the content. In some ways the objects are mundane, but through the composition and curation there is an intrigue given to the objects. I’m hoping to explore a similar vein in my typology.

Link to an article on Mike Mill’s use of object as an inspiration for his film:

https://www.thecut.com/2017/01/mike-mills-20th-century-women-artifacts.html

Horse in Motion

From its inception photography has been connected with the world of science and structured observation. The typology of the Horse in Motion exemplifies this use case – where a horse was photographed in profile as it galloped and was then imposed on a grid to allow people to see the true nature of the horses gate.


Implementation

My goal is to create a super standardized photographic composition by creating a highly controlled system for holding and imaging samples. I will construct a small platform to hold my samples and calibrate the robotic arm to take an image sweep across the plane of the mounting plate. My final setup will be a structure similar to a microscope, which will often have fixturing for samples on a stable bed. I will use the robot arm in tandem with the arduino controllable blackmagic camera to produce high quality video of the surface of the object, which can then be turned into a 3d model by photogrammetry software.


Curation

My goal is that the typology will be viewable in the looking glass – maybe built into a box that the viewer can hold? By turning a knob the viewer will be able to shift through the models displayed.


Tools

  • Studio Robot arm – running simple linear trajectories calibrated with respect to the sample platform
  • Blackmagic Film Camera + Arduino
  • Integrated lighting & object fixturing system – a platform for ‘samples’ with some kind of integrated lighting system – so that lighting doesn’t change between many samples

SEM: Coffee

I had originally prepared a sample containing a crushed Benadryl and sea salt, however there were complications in setting up the SEM and I ended up capturing another sample (which I believe was Philippe’s – coffee).

900x magnification
1300x magnification
7000x magnification
22x magnification stereo pair
22x magnification anaglyphic stereo view


SEM-Tagbamuc

Please find my SEM results bellow of a piece of dry skin. For reference, these flakes are small enough to fit on a head of a pin;

Familiar view;

Detail shots/Unfamiliar Views

StereoPairs

Experience 

Donna can testify that I was really surprised and delighted by my experience. I think what caught me so off guard was how layered dead skin is and how it interacts with each other. The first thing I thought when I was looking at it under the microscope, is that it looks like a tiny cave where some kind of creature should live! The flakes definitely inspired me to design a world and a creature to exist in this space. It was pretty mind-blowing to think that came off of my body and has so much detail for something that was just a spec on my clothes.

Donna was telling Nica and I that it would be difficult to get the stereopairs done correctly because of where my sample was located on the disk. Apparently some positions favor the process more than others, but we gave it a shot anyway!

SEM – UnFrazzle Your Dazzle

For my visit to the SEM I observed a tea called UnFrazzle Your Dazzle (contains: Chamomile, Oatstraw, Red Clover, Skullcap, Catnip, Linden Flower, Spearmint, Violet, Jasmine, & Love (didn’t happen to find the love in my observations, probably didn’t make it into the sample). It was really  exciting to see the  textures  of  the  dried  plants  and  discover  the  pollen  that  had  made  its  way  seemingly  everywhere.

We see here the chamomile leaves and flowers. I didn’t know prior to this that what I thought of as the ‘flower’ is actually many tiny flowers in the center. They can be seen here.

Moving in much closer, we can see pollen spores in the flower petals. The spiky looking pieces in the middle of the photo are fully formed pollen, whereas the blood-cell-like piece towards the top right of the image is an undeveloped pollen spore. The crinkled texture of the petals are due to the drying of the plant.

Some more pollen, pictured here on the leaf of the chamomile flower. The empty pockets on the surface are the dried cells of the leaf. Living they would be filled with water and spread smoother.

We were unsure what we are seeing here, however we can tell that it is likely a piece of some plant that has been broken off, due to the jagged edges.

Another ingredient of the tea! Unsure exactly what plants we are seeing here as well, but the texture ad forms are fascinating!

Stereo Images: