Michal Luria – Project 07 – Curves

mluria-07

/*  Submitted by: Michal Luria
    Section A: 9:00AM - 10:20AM
    mluria@andrew.cmu.edu
    Assignment-07-Project
*/

var nPoints = 100; //points in the shape

function setup() {
  createCanvas(500, 500);
}

function draw() {
  background("Lavender");
  noStroke();

  push();
  translate(height/2, width/2); //center the work
  drawCurve(); //call curve drawing
  pop();

}

function drawCurve() {
    // base: Hypotrochoid
    
    var x; //controlled by mouseY
    var y; 
    var x2; //controlled by mouseX
    var y2;

    var a = 300; //diam
    var b = a / 2; //radius
    var h = constrain(mouseY / 5, 0, a); //constrain the shape motion using mouseY
    var w = constrain(mouseX / 5, 0, a); //constrain the shape motion using mouseY

    beginShape();
    fill(180, 200, 255);

    //draw the shape according to the number of points it has
    for (var i = 0; i < nPoints; i++) {
        var t = map(i, 0, nPoints, 0, TWO_PI); //map points to a full circle
        
        x = (a - b) * cos(t) + h * cos((a-b) / b * t); //Hypotrochoid formula
        y = (a - b) * sin(t) - h * sin((a-b) /b * t); 

        x2 = (a - b) * cos(t) - w * cos((a-b) * t); //Hypotrochoid formula with variations
        y2 = (a - b) * sin(t) * sin((a-b) * t);

        vertex(x, y); //draw the vertex
        vertex(x2, y2); //draw second vertex    
    }
    endShape(CLOSE);
    
}

function mousePressed() {
    //when mouse is pressed, the number of point is the shape changes
    nPoints = random(70,250);
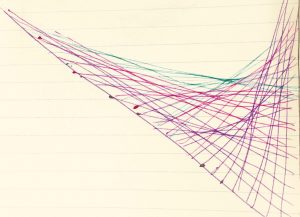
}

In this project, I started with a pretty simple equation of a Hypotrochoid. The shape turned out to be quite standard, but I wanted to create something that would use curves in a way that would be very difficult to physically draw, but easily computed. This is why I liked the idea of playing with the equation, and so I did. I ended up changing parts of it, which resulted in a interesting shape that evolves and moves according to the mouse coordinates (And it changes with every click!). I think that using the curve equations allowed beautiful continuous motion of a changing shape.

Michal Luria – Looking Outwards – 07

The Fallen of World War II / Neil Halloran

The project I chose for this week is the data visualization short documentary by Neil Halloran:

The fallen of World War II / Neil Halloran – a short film presenting the casualties of the second world war in comparison to others in the history of human kind. Source.

This fascinating short film presents data of the casualties of World War II in a visual way. It moves the data around to add information to the viewer. For example, the casualties, after a simple count, are divided into areas of war, where you can see the two sections one compared to the other, and then placed on a timeline for a better perspective on the order of things.

What I liked most about this work is that these data sets are available to all of us, yet it is perceived that war culture is extending and becoming dominant in our world. By comparing the data of WWII to other wars in history, it allows a new perspective on where things are headed.

The film takes a different approach, just by visualizing data. The key to this work is perspective, and perspective is seen better than it is heard. By allowing the viewers to visualize the data the message is clear.

Michal Luria – Project 06 – Abstract Clock

mluria-06

/*  Submitted by: Michal Luria
    Section A: 9:00AM - 10:20AM
    mluria@andrew.cmu.edu
    Assignment-06-Project
*/


var n = 0.00; //transition from color to color
 

function setup() {
    createCanvas(400,400);
    background(255);
    colorMode(HSB, 100);
}


function draw() {

    var s = second();
    var h = hour() +3; //transition at 3AM

    //top color in gradient 
    var topH = s*1.5; //top saturation influenced by seconds
    var topS = 30
    var topB = 90;

    //bottom color in gradient 
    var bottomH = 100; 
    var bottomS = 0;
    //bottom brightness according to hour
    //darkest at 3AM
    var bottomB = map(h, 27, 0, 0, 100); 


    for(var i = 0; i < height; i++){

        var topCol = color(topH, topS, topB); //define top color
        var bottomCol = color(bottomH, bottomS, bottomB); //define bottom color

        //transition from top color to bottom color according to height
        n = map(i, 0, height, 0, 1); 
        var centCol = lerpColor(topCol, bottomCol, n);
        stroke(centCol);
        strokeWeight(2);
        line(0, i, width, i); //draw a line of color

    }


}


When thinking about abstraction of time, what I found fascinating was how time could be represented with color. Maybe you would not know what was the exact hour by looking at the clock, but I thought the point of the project was mainly to get a sense of the time. This is why I created a gradient, where one side is influenced by the seconds and changes the saturation, whereas the other side’s brightness is influenced by the hour of the day. In this way, every second of the day has a unique frame that will reappear the next day.

Michal Luria – Looking Outwards – 06

Flux / Gabriel Comym

“Flux”, a typography project generated with 1000 random particles, by Gabriel Comym.

The project I will present is a project called “Flux” by Gabriel Comym. The project creates typography generated by a thousand particles each, which are random in their location, length, speed, transparency and direction.

What I like about this project is that it makes the typography very expressive and with high aesthetics using mostly random values, therefore the artist himself does not know what the result of the art will look like, and what will the final typography portray.

The random values of the project are actual random numbers that determine the starting point, direction, speed and opacity of each particle. However, it is limited in speed, allowing it to create a sense of “growth” for each letter, as well as the limited location to the border of the letter for the starting point of each particle. In my opinion, these limitations serve the project well, allowing interesting development of typography without losing the visual aspect of being able to recognize the letter.

Michal Luria – Looking Outwards – 05

Inside Me / Nils Frahms

The work I will discuss this week in “Inside Me” by Nils Frahms. The project is a 3D computer generated work of art that aims to express the inner self of an individual in today’s information and technological world. The video presents what looks like the inside of a person, combined with expressive light and color, into a magnificent video work of art.

The project was created using a special 3D scanning technique – the artist 3D scanned his own body. This technique allows not only scanning from the outside, but also “inner scanning” where the objects are inverted and create abstract shapes.

With this initial scanned material of his own body, and with the help of 3D computer generating software, the artist, in my opinion, succeeded in presenting his inner world. What I like about this project is that the artist’s own body was the starting point and the core material to work with, and therefore there is a strong connection between his body and the resulted 3D art that is made to represent his inner self.

Inside Me by Nils Frahms, presents the inner world of the artist using scanning and 3D computer generated art techniques. Source

Michal Luria – Project 05 – Wallpaper

mluria-wallpaper

/*  Submitted by: Michal Luria
    Section A: 9:00AM - 10:20AM
    mluria@andrew.cmu.edu
    Assignment-05-B
*/

var marg = 20; //margin for background dots
var start = 195; //starting point of diamond
var step = 100; //margin space in big diamond
var smallStepX = 50; //X margin space in small diamond
var smallStepY = 80; //Y margin space is small diamond

function setup() {
    createCanvas(783, 540);
    background(236,229,206);
    noStroke();


    for (var y = 0; y < height/20; y++) {
        if(y % 2 == 0){

            //draw background dots
            for (var x = 0; x < width/20; x++) {
                fill(244,142,121);
                ellipse(marg*x, 10 + marg*y, 3, 3);
            }
        } else {
            //alternate dot background
            for (var x = 0; x < width; x++) {
                fill(244,142,121);
                ellipse(marg*x + marg/2, 10 + marg*y, 3, 3);
            }

        }
    }   

    fill(197, 224, 220);

    for (var i = 0; i < 5; i++) {
        //draw big diamond
        quad(i*start, height/2, i*start+step, height/4,
        i*start+(2*step), height/2, i*start+step, height/4*3);

        //draw squares in diamonds
        push();
        fill(224, 142, 121);
        rect((i*start + i*start+step)/2, (height/2+height/4)/2, 100, 130);
        pop();

        //draw small diamond
        quad(i*start+smallStepX, height/2, i*start+step, height/4+smallStepY,
        i*start+(2*step)-smallStepX, height/2, i*start+step, height/4*3-smallStepY);

        //draw center circle
        push();
        fill(231,202,145);
        ellipse(i*start+2*smallStepX, height/2, 50, 50);
        pop();

    }


    noLoop();

}

In the process I wanted to create a wallpaper that I would enjoy (for my computer) as well. I wanted to use some geometrical/tribal inspired forms and organic colors for this project. Starting with an initial sketch (attached), programming the pattern and previewing it allowed me to iterate and modify according to my preference and esthetic taste as I went.

project-05-sketch

Michal Luria – Project 04 – String Art

mluria-project-04


function setup() {
    createCanvas(640,480);
    background(0);

}

function draw() {
  
    strokeWeight(2);

    var incrW = width/50; //define increment for X
    var incrH = height/50; //define increment for Y

    //top peach (lowest layer)
    var startX1 = 0;
    var startY1 = 0;
    var endX1 = width;
    var endY1 = 0.4*height;

    stroke(248,178,142);
    for (var i = 0; i < 40; i++){
        line(startX1, startY1, endX1, endY1);
        startX1 += incrW;
        startY1 += incrH;
        endY1 -= incrH;
    }

    //bottom peach (lowest layer)
    var startX2 = 0;
    var startY2 = 0.6*height;
    var endX2 = width;
    var endY2 = height;

    for (var i = 0; i < 40; i++){
        line(endX2, endY2, startX2, startY2);
        endX2 -= incrW;
        endY2 -= incrH;
        startY2 += incrH;
    }

    //top pink
    var startX3 = 0;
    var startY3 = 0;
    var endX3 = width;
    var endY3 = 0.55*height;

    stroke(241,115,127);
    for (var i = 0; i < 40; i++){
        line(startX3, startY3, endX3, endY3);
        startX3 += incrW;
        startY3 += incrH;
        endY3 -= incrH;
    }

    //bottom pink
    var startX4 = 0;
    var startY4 = 0.45*height;
    var endX4 = width;
    var endY4 = height;

    for (var i = 0; i < 40; i++){
        line(endX4, endY4, startX4, startY4);
        endX4 -= incrW;
        endY4 -= incrH;
        startY4 += incrH;
    }

    //top violet
    var startX5 = 0;
    var startY5 = 0;
    var endX5 = width;
    var endY5 = 0.7*height;

    stroke(193,109,135);
    for (var i = 0; i < 40; i++){
        line(startX5, startY5, endX5, endY5);
        startX5 += incrW;
        startY5 += incrH;
        endY5 -= incrH;
    }

    //bottom violet
    var startX6 = 0;
    var startY6 = 0.3*height;
    var endX6 = width;
    var endY6 = height;

    for (var i = 0; i < 40; i++){
        line(endX6, endY6, startX6, startY6);
        endX6 -= incrW;
        endY6 -= incrH;
        startY6 += incrH;
    }

    //top purple
    var startX7 = 0;
    var startY7 = 0;
    var endX7 = width;
    var endY7 = 0.85*height;

    stroke(109,92,128);
    for (var i = 0; i < 40; i++){
        line(startX7, startY7, endX7, endY7);
        startX7 += incrW;
        startY7 += incrH;
        endY7 -= incrH;
    }

    //bottom purple
    var startX8 = 0;
    var startY8 = 0.15*height;
    var endX8 = width;
    var endY8 = height;

    for (var i = 0; i < 40; i++){
        line(endX8, endY8, startX8, startY8);
        endX8 -= incrW;
        endY8 -= incrH;
        startY8 += incrH;
    }


    //top blue
    var startX9 = 0;
    var startY9 = 0;
    var endX9 = width;
    var endY9 = height;

    stroke(50,93,128);
    for (var i = 0; i < 50; i++){
        line(startX9, startY9, endX9, endY9);
        startX9 += incrW;
        startY9 += incrH;
        endY9 -= incrH;

    }

    //bottom blue
    var startX10 = 0;
    var startY10 = 0;
    var endX10 = width;
    var endY10 = height;

    for (var i = 0; i < 50; i++){
        line(endX10, endY10, startX10, startY10);
        endX10 -= incrW;
        endY10 -= incrH;
        startY10 += incrH;


    }

    noLoop();


}

In this project I wanted to try and create the physical feeling of actual strings that is the core of string art. I started with a sketch to understand the logic of what I wanted to create (below), and then went on to create it layer by layer. I think the layers in this project created the sense of physicality that I wanted for the final result.

sketch-04

Michal Luria – Looking Outwards – 04

AUDFIT

The project I would like to present this week is called “Audfit”, a project that combines sound, choreography and computing. This is a performance of a dancer that is connected to an “audio-costume”. Whenever the dancer moves, the movement sensor connected to a specific body part triggers a sound sequence in the audience’s headphones. Furthermore, the audience can choose from 3 audio channels to listen to while watching the choreography.

AUDFIT in action – a dancer with the audio costume and the sound it produces. credit: Strange Loop (vimeo)

What I like about this project is that the sound is generated according to the dancer’s movement, and that they have an interesting corresponding relationship between them. Also, the audience is able to choose between channels, and their choice of channel would change their experience, as the music is a significant part of the artistic message. Therefore, each person in the audience would have a slightly different experience from this performance, according to the timing in which they switched from channel to channel.

The technology behind this project is movement sensors connected to the dancer’s costume. Each time a sensor indicated motion, it triggered a sound sequence. These sound sequences were then combined to create new and interesting harmonies.


Michal Luria – Looking Outwards – 03

Growing Objects / N-e-r-v-o-u-s System

The project I chose this week is an exhibition presented in 2014 called “Growing Objects”. The notion behind this work is to explore how structures are created in nature. The artists translated complex scientific theories and mathematical growing models into algorithms, and allowed 3D printers to generate objects according to these rules.

nervous.com

What I like about this work is that the artist, like in all generative art, does not know what will be the outcome on their art. But even more so, the artist experiences a creation of something that is structured in the same mysterious way as in nature. They can learn something new, and allow others to learn – how models evolve in nature, sometimes over hundreds or thousands of years, is now presented in an art gallery, by using fabrication.

nervous.com

Furthermore, this type of art using a set of rules creates beautiful sculptures that would be hard to create otherwise. The rules are already determined. The artist just needs to choose an inspiration (in this case, structures from nature), analyze their scientific rules, and then must let go and allow the art to create itself.

nervous.com

Michal Luria – Project 03 – Dynamic Drawing

mluria-project03

/*  Submitted by: Michal Luria
	Section A: 9:00AM - 10:20AM
	mluria@andrew.cmu.edu
	Assignment-03-A
*/

var space = 130; //space between squares 

function setup() {
    createCanvas(640, 480);
}
 
function draw() {
 
    noStroke();
    
    //pink square location determined by blue square
    var pinkSqX = width - mouseX; 
    var pinkSqY = height - mouseY;

    //map mouse movement to background range
    var bg = map(mouseY, 0, height, 150, 255);

    //map distance from center to square size
    var distCenter = dist(mouseX, mouseY, width/2, height/2);
    var sqSize = map(distCenter, 0, 300, 50, 400);
    
    background(bg);
    rectMode(CENTER);

    //top square
    fill("LightBlue");
    rect(mouseX, mouseY, sqSize, sqSize); 

    //bottom square
    fill("LightPink");
    rect(pinkSqX, pinkSqY, sqSize, sqSize);

    rectMode(CORNER);
    //top rect
    fill("DarkBlue");
    rect(0, 30, mouseX - space, 200);  

    fill("DeepPink");
    //bottom rect
    rect(pinkSqX + space, 250, mouseX - space, 200); 

}