![[OLD – FALL 2016] 15-104 • COMPUTING for CREATIVE PRACTICE](../../wp-content/uploads/2020/08/stop-banner.png)
//Victor Tavarez
//Section D
//vtavarez@andrew.cmu.edu
//Project-04
function setup() {
createCanvas(640, 640);
}
function draw() {
background(60);
stroke(49,19,255);// rain like blue meant to cover background
for (var x5 = 0; x5<width; x5+=width/50) {
for(var y5 = 0; y5 < height; y5 +=height/40){
line(x5, y5, x5+10, y5+30);
}
}
stroke(240,255,250);//light source from an angle meant to give the piece a further dimension
for (var x4=50;x4<=width*9/10;x4*=1.10) {
for(var y4=50;y4 <=height*8/10;y4*=1.10) {
line(x4,y4,width/6,height/2);
}
}
// the following figures are mmeant to be similarand are meant to look like legs.
stroke(234,103,200);
for (var x1 = 0; x1 <= width; x1+=100) {
for (var y1 = 0; y1 <= height; y1+=10){
line(x1,y1,x1+40,x1+40);
}
}
stroke(190,253,213);
for(var x2 = width; x2 >=0 ; x2-=100) {
for(var y2 = height-40; y2 >= 0; y2-=10){
line(x2,y2, x2+40, x2+40);
}
}
stroke(140,120,232);
for(var x3 = 0; x3 <=width;x3+=100){
for(var y3 = height; y3 >= 0; y3-=10){
line(x3,0,x3+40,y3-200);
}
}
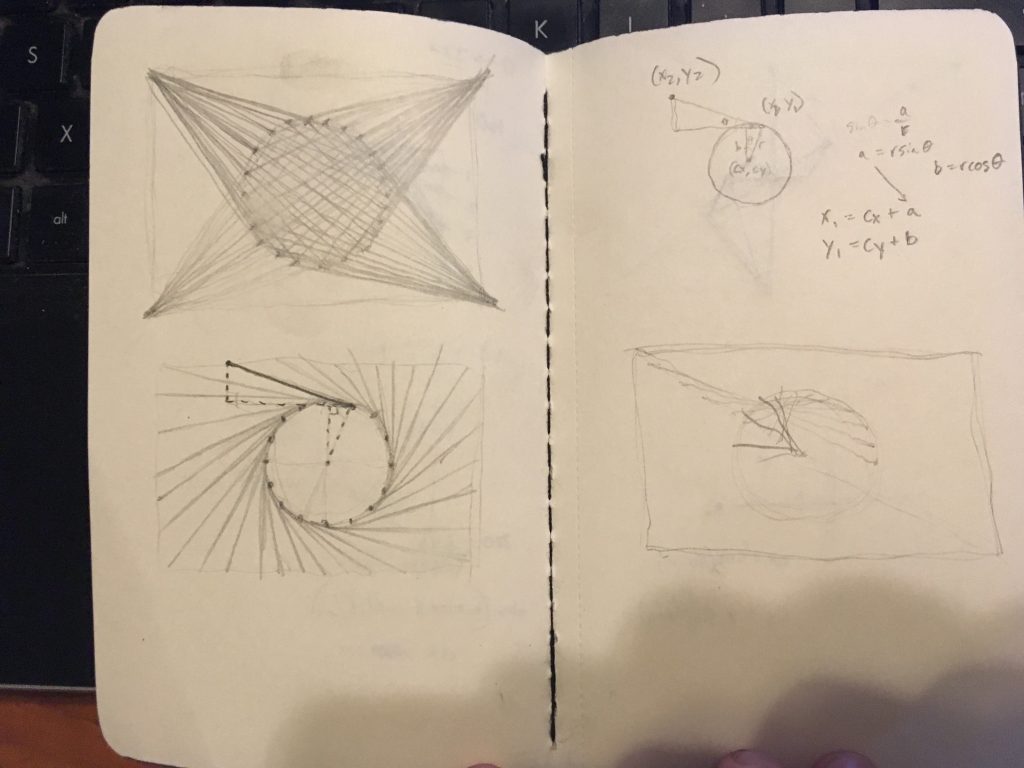
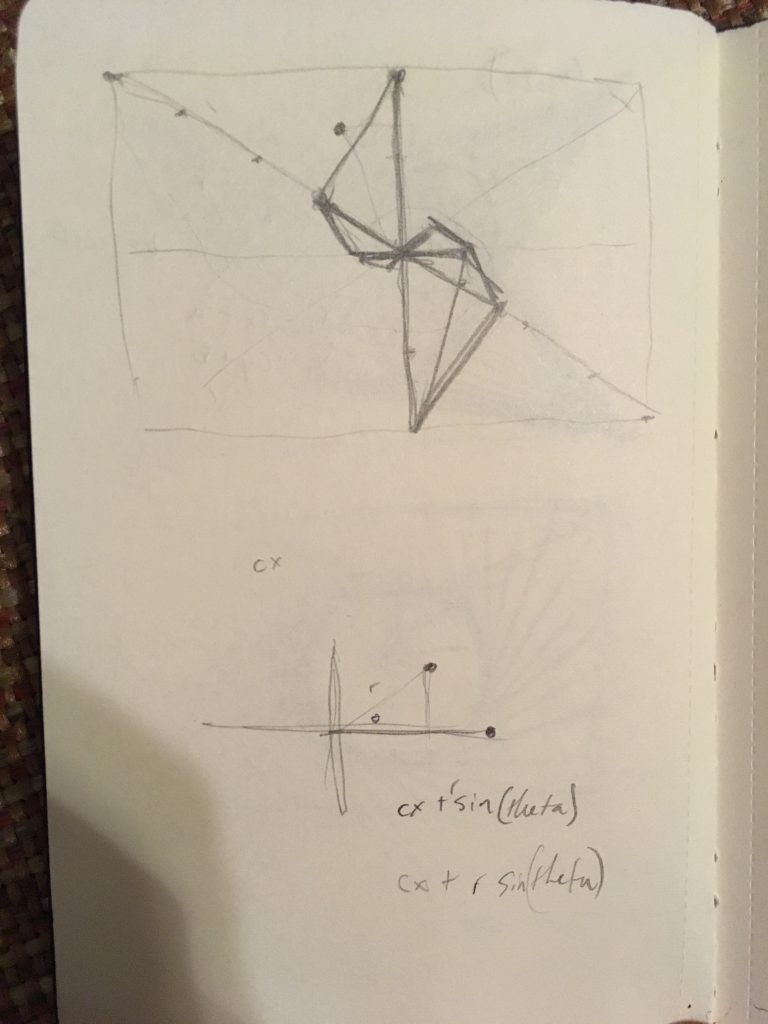
}I restarted this project a few times. I wanted to experiment using the look system and incorporate the various functionalities I discovered in one piece. Although a bit abstract, the image above is supposed to depict a person crossing the street on a raining day. More importantly, the image uses short and frequent lines to simulate rain in the back layer of the image. By connecting many points to pixel, I was able to simulate distance and light using white lines. for the rest of the images I tried to emulate the stage of walking. with the green lines representing stepping forward in how the “knee” moves downward. In the future I hope to be able to use these with animation to simulate movement.