![[OLD FALL 2019] 15-104 • Introduction to Computing for Creative Practice](https://courses.ideate.cmu.edu/15-104/f2019/wp-content/uploads/2020/08/stop-banner.png)
function setup() {
  createCanvas(200,200);
}

function draw () {
    rect(10,10,40,40);
    fill("black");
}
Month: August 2019
Caroline Song – Project 01
function setup (){
    createCanvas(200,300);
}

function draw(){
    fill("red");
    rect(10,10,40,40);

}Angela Lee – Project – 01
function setup(){
	createCanvas (500, 500);
}

function draw(){
	fill("red");
	ellipse(200, 200, 100, 100);
}Grace Hou – Project – 01
Project-01
I started working on this project in the p5 web editor. I couldn’t decide if I should use more basic shapes to make a simple portrait, or try to combine pieces to make a little more cartoon like portrait. I ended up playing with the stroke width and rotating shapes to make the hair and learning some new tricks with push and pop to make sure the translation and rotation didn’t affect the rest of my project.
//Emily Stark
//15-104A
//Project 01
function setup() {
  createCanvas(400,400);
  background(0);
}

function draw() {
  //hair
  fill(242, 225, 114);
  noStroke();
  ellipse(200,170,170,200);
  rect(115,170,170,300);
   //neck
  stroke(0);
  strokeWeight(1);
  fill(240, 214, 168);
  rect(185,270,30,60);
  //face
  stroke(0);
  strokeWeight(1);
  fill(240, 214, 168);
  ellipse(200,200,150,200);
  //shirt
  noStroke();
  fill(177,246,250);
  ellipse(200,420,200,200);
  //eyes
  strokeWeight(3);
  stroke(0);
  noFill();
  arc(160,200,45,30,PI,0);
  arc(240,200,45,30,PI,0);
  //smile
  fill(255,0,0);
  arc(200,250,50,40,0,PI,CHORD);
  //bangs
  noStroke();
  fill(242, 225, 114);
  push();
  translate(220,150);
  rotate(PI/4);
  ellipse(0,0,150,80);
  pop();

}
test
hello

Emma N-M LO-01
A Day in the Life of Americans is a data visualization project that tracks how 1,000 Americans spend their time throughout the day. This visualization runs for 24 hours starting at 4AM and uses moving dots to show how people move from different activities. I was liked this project because it is a simple but informative way to present how Americans race from one thing to the next. This project was created by Nathan Yau and he used the American Time Use Survey to collect his data before creating a model of time-varying Markov chain visual. It is unknown whether Yau created the data visual from scratch or with the help of commercial software. Yau also researched how American spends their time compared to you, the viewer, and what people spend their time on depending on sex and age. From a marketing and advertisment stand point, this data provides insights into possible consumers’ likes, dislikes and interests. Marketing materials have the potential to be targeted to specific groups of people.
Xiaoyu’s LO-1
function setup() {
    createCanvas(320, 240);
    background(220);
}

function draw() {
    rect(10, 10, 40, 50);
}

Xu’s LO-1
asdfghjkll;’

function setup() {
    createCanvas(320, 240);
    background(220);
}

function draw() {
    rect(10, 10, 40, 50);
}
Nadia Susanto – LookingOutwards-01
Ever since I went to Japan the Summer of 2018, I became obsessed with teamLab’s breathtaking creations. teamLab is a creative group that likes to refer themselves as “ultra-technologists,” uniting many professionals like artists, programmers, engineers, CG animators, architects, and more to achieve their goal of creating new relationships between people through their digital art. For each project they create, they use software, 3D modeling, and sensing technologies.
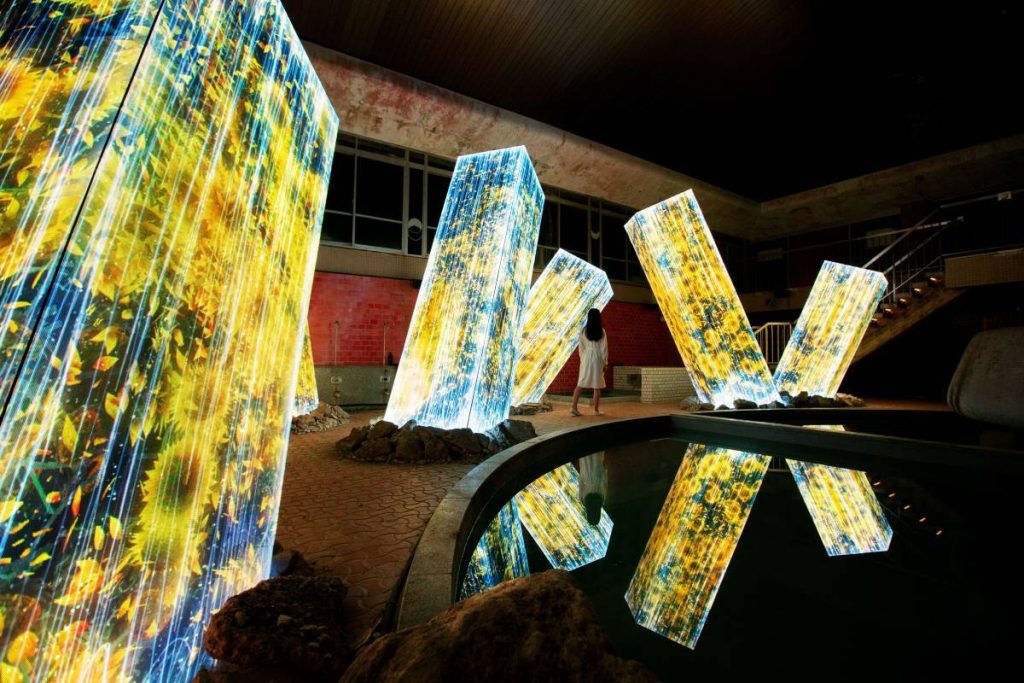
teamLab has once again come out with an amazing project: “A Forest Where Gods Live” located in Takeo Hot Springs, Kyushu, Japan. What I admire most about this project is that it is much needed in this reality where climate change is prevalent, the Amazon is on fire, and nature is dying. This digital art installation will be an amazing reminder of the beauty in nature and to not lose hope in restoring God’s beauty.
For this specific project, their inspiration came from the Mifuneyama Rakuen Park created in 1845. Over the time the park has evolved to have beautiful forests, rocks, and caves. With their art, they want humans to better conceptualize time for periods longer than their own lives and have them become lost and immersed in the nature.