Emma N-M — Final Project

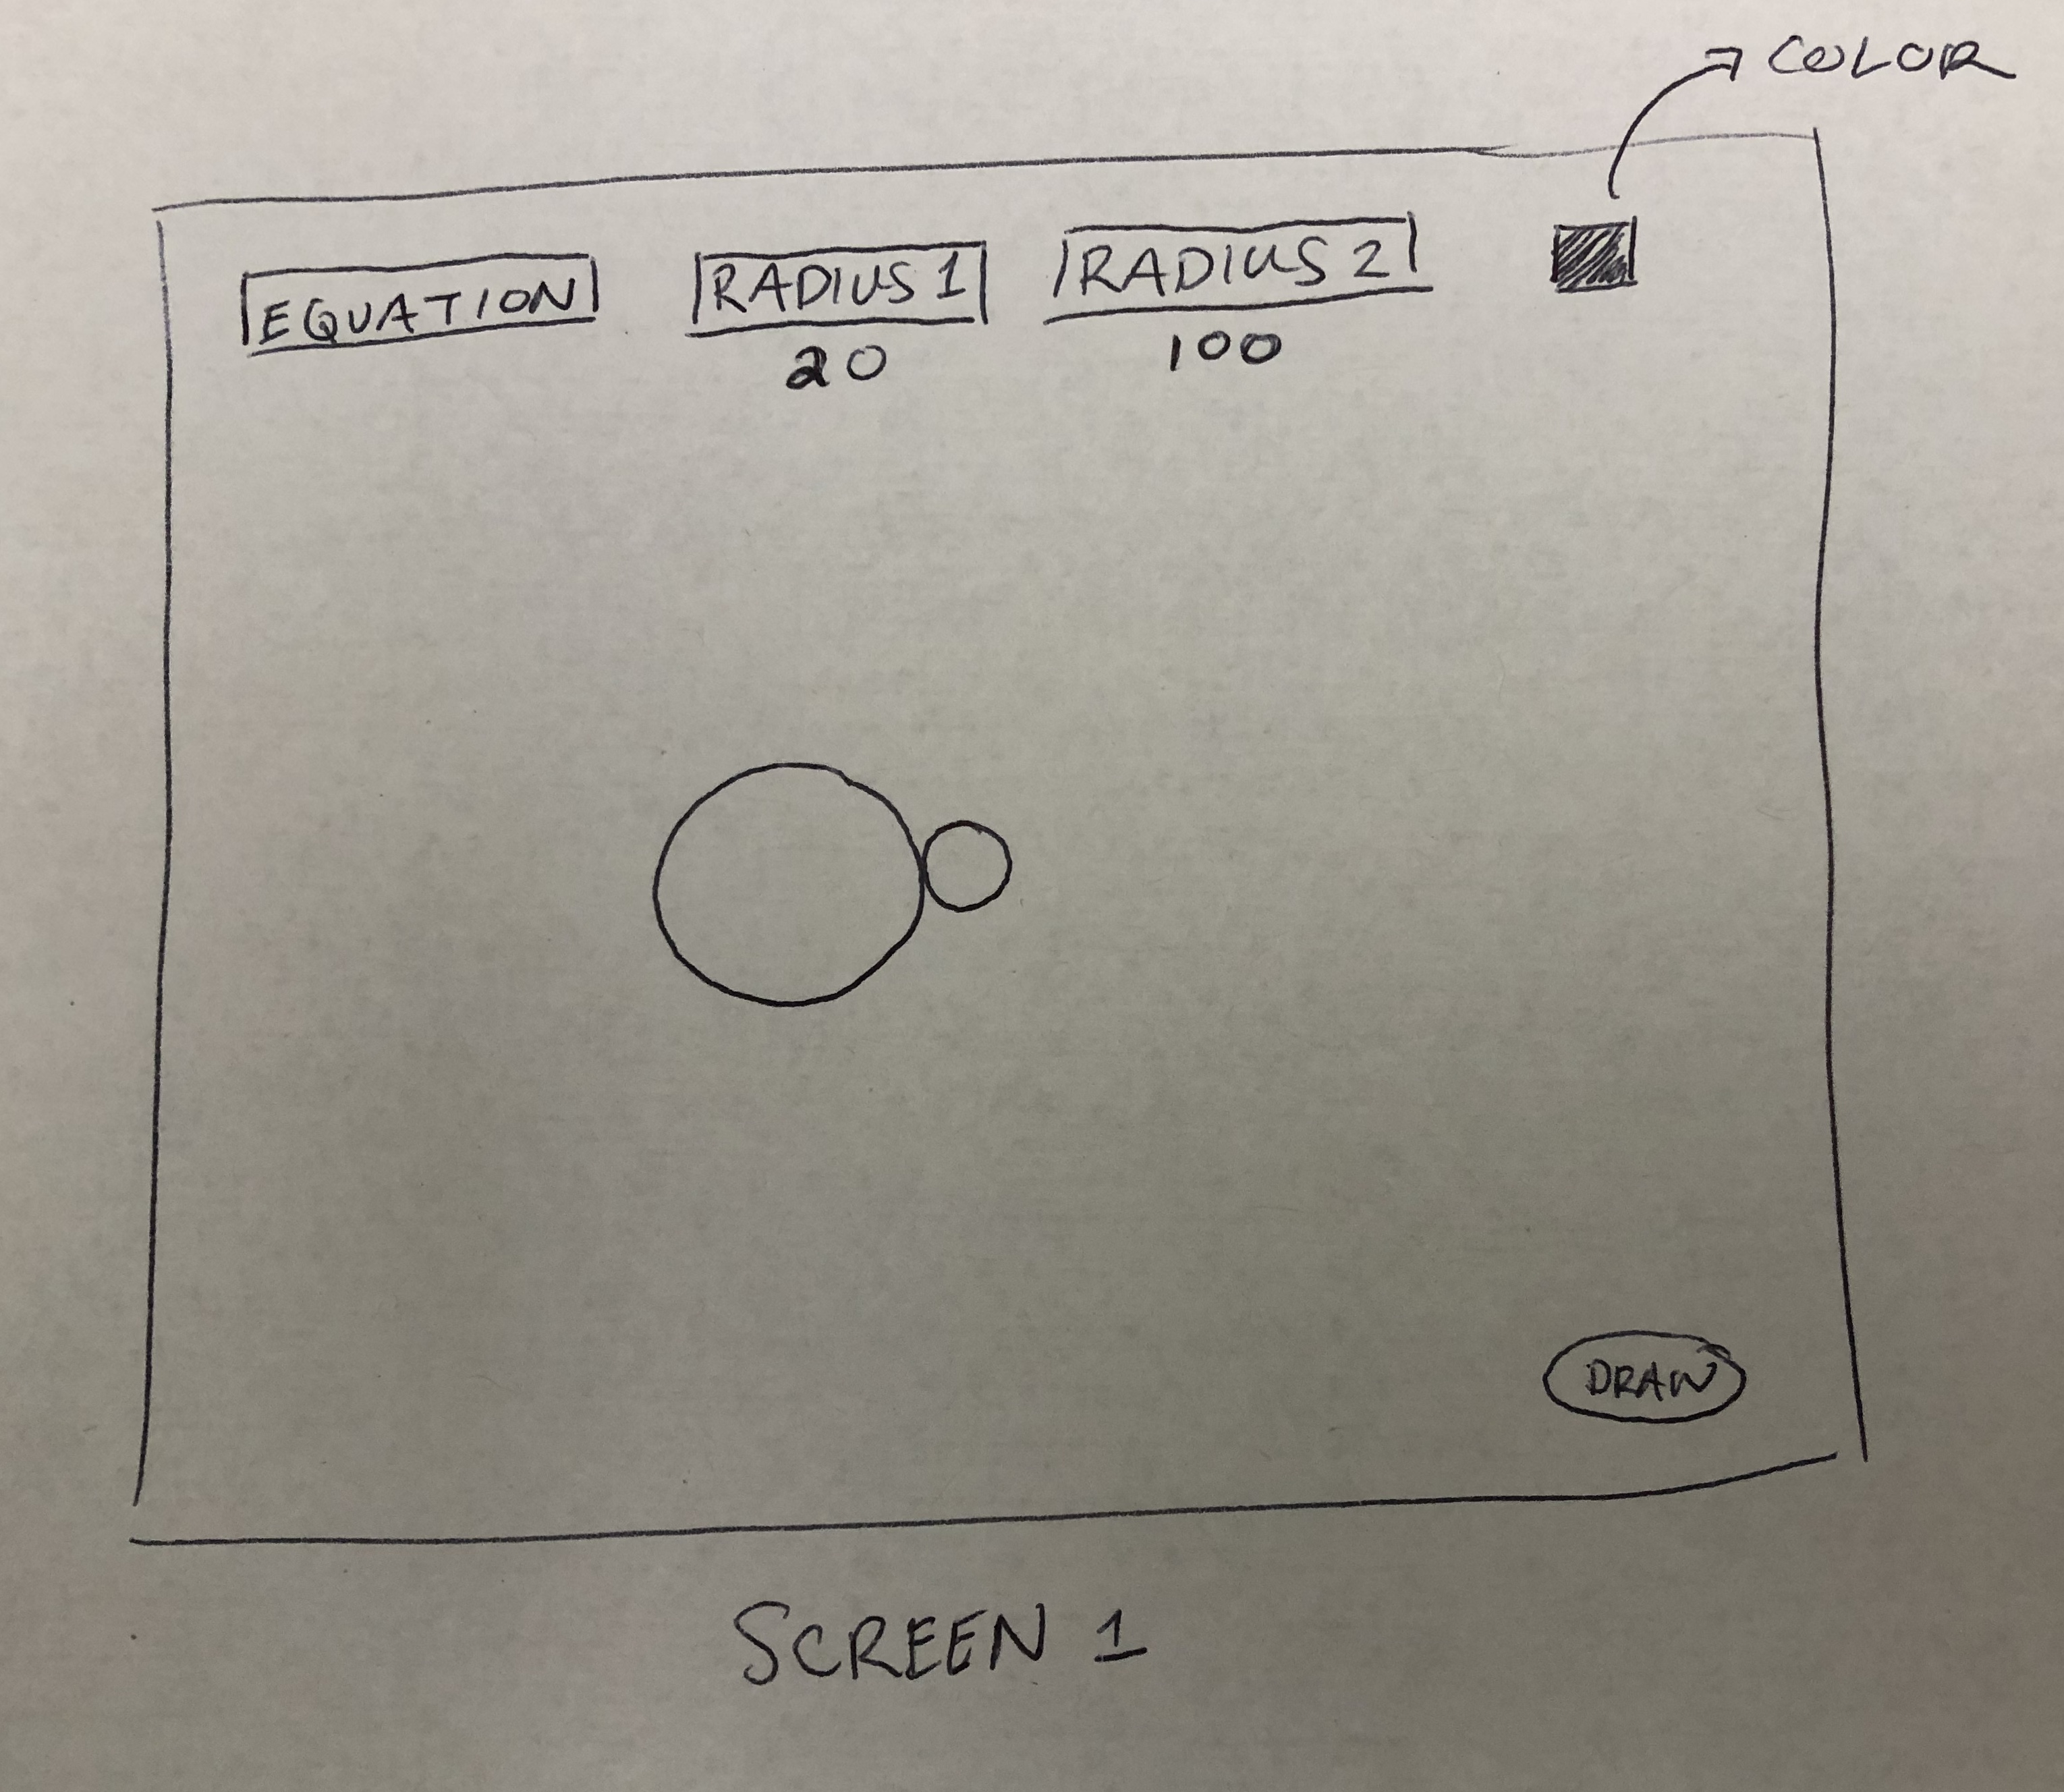
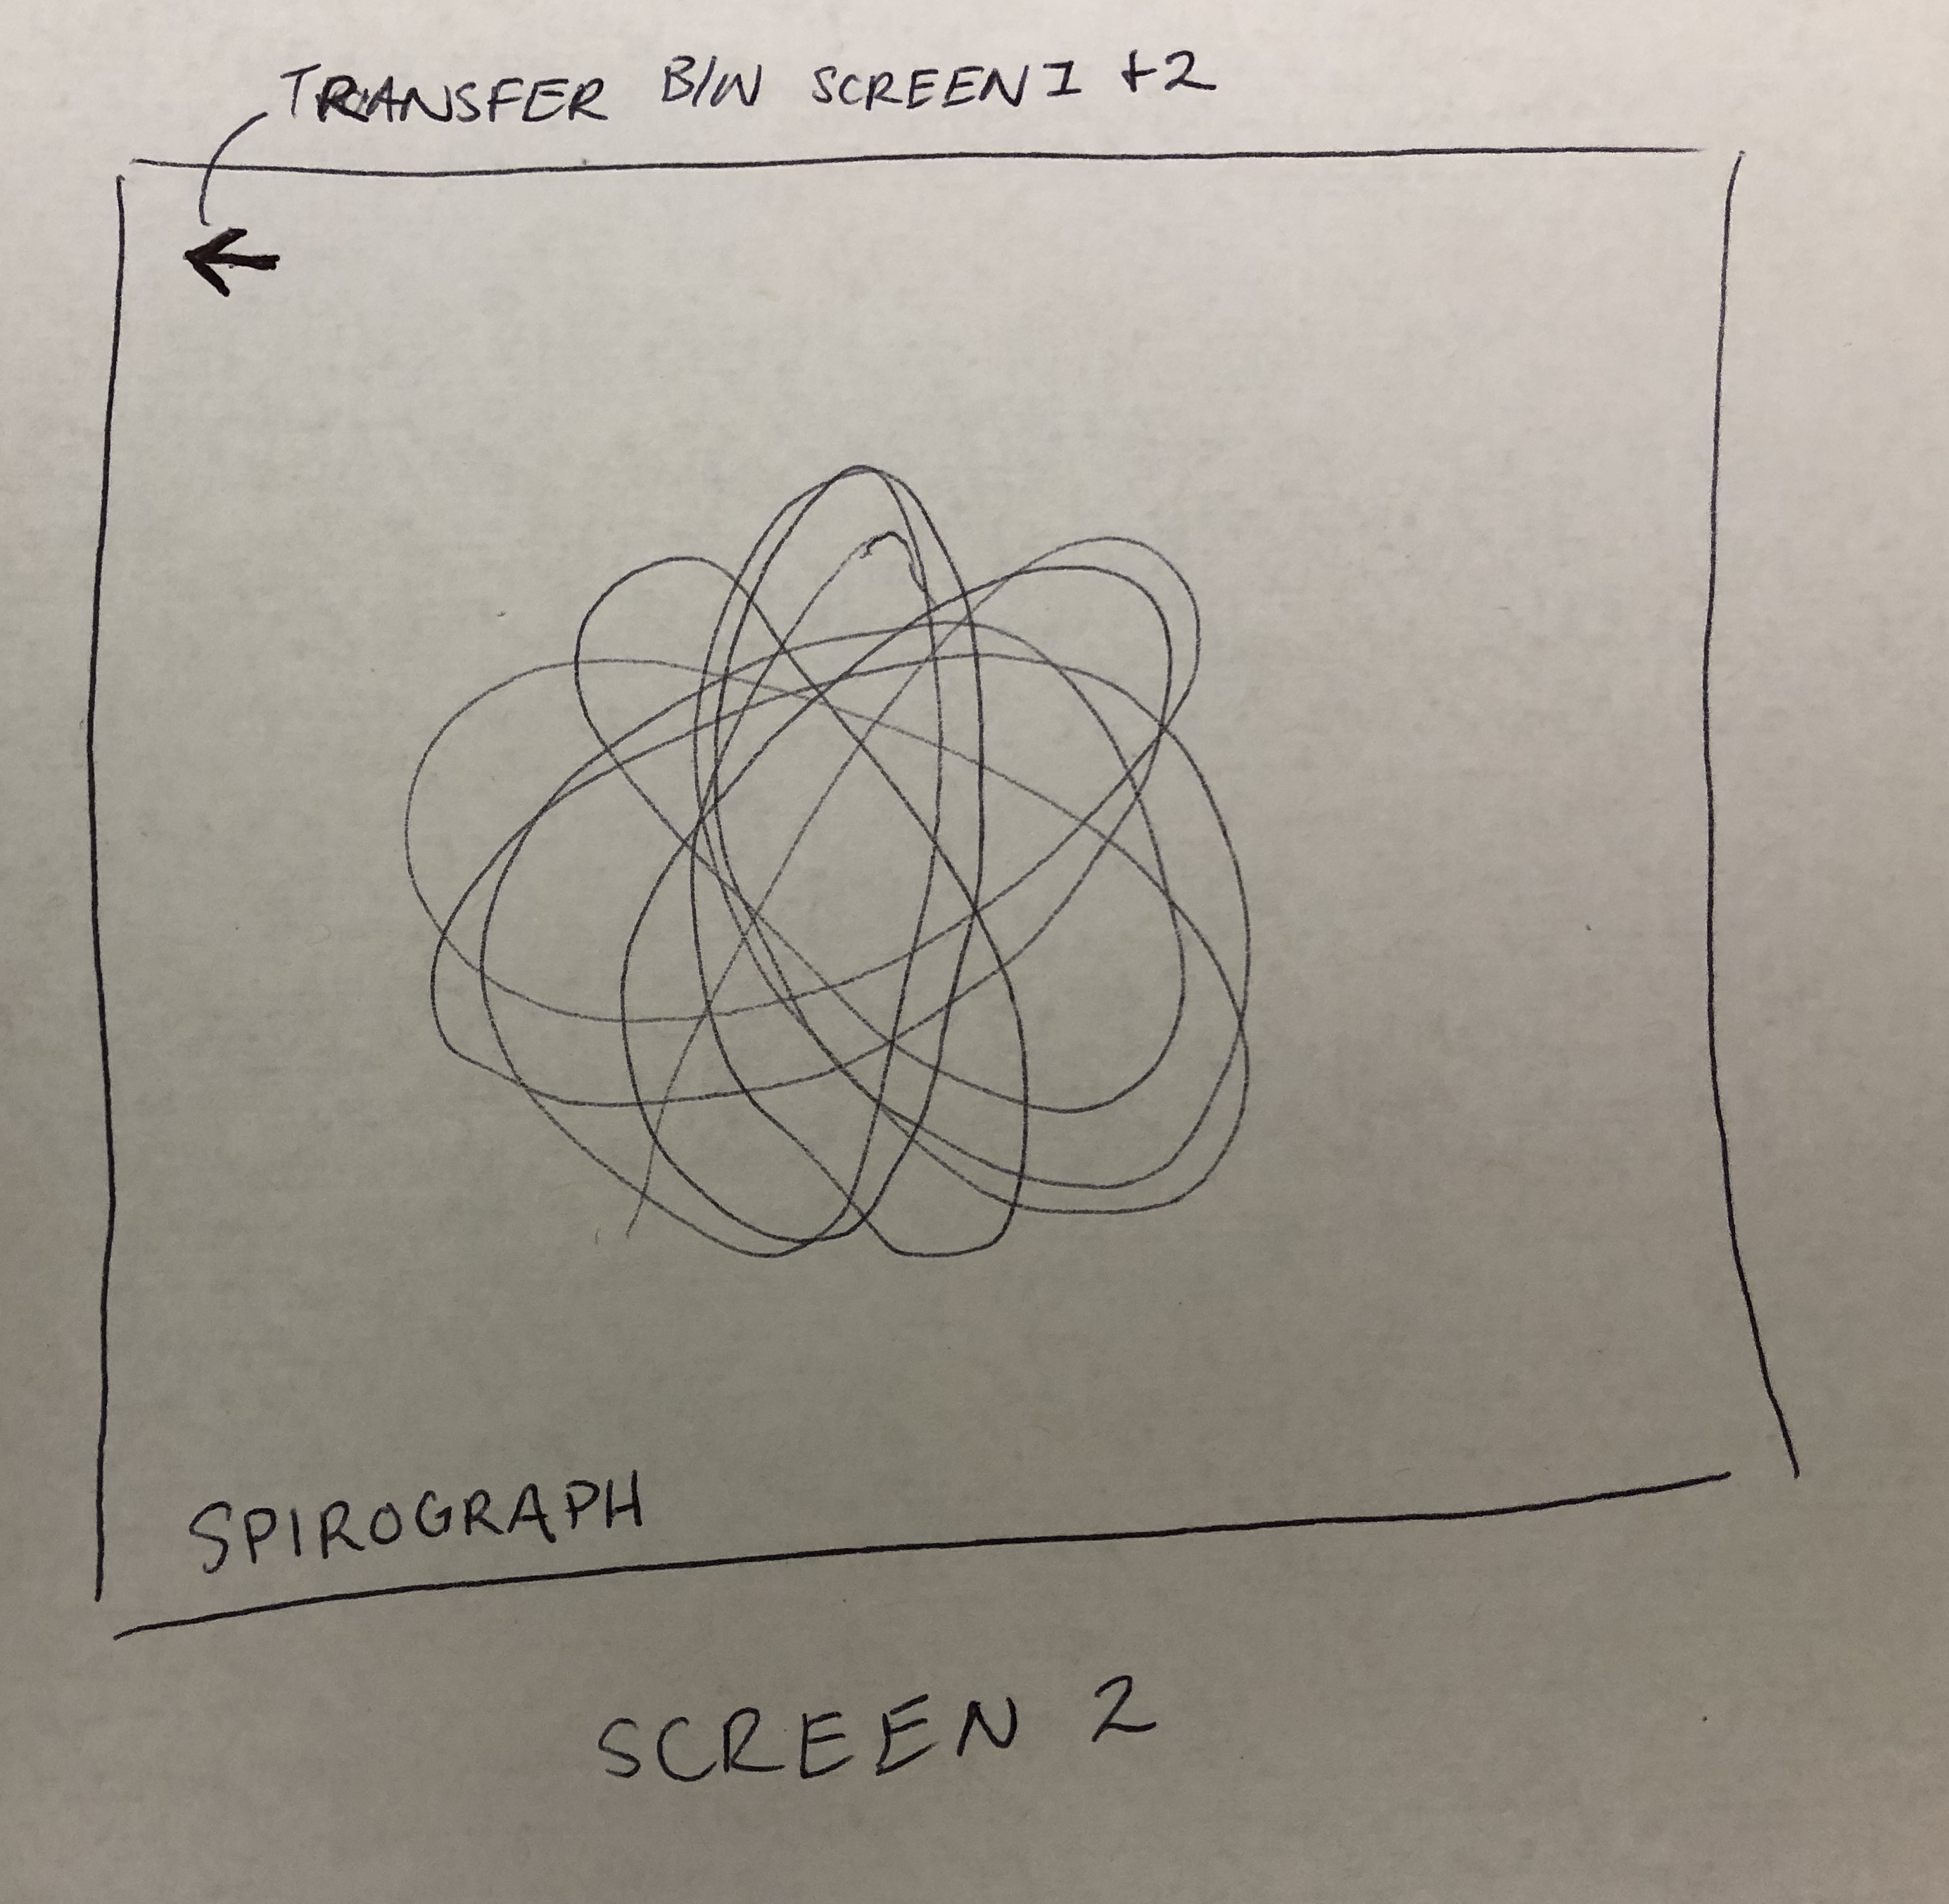
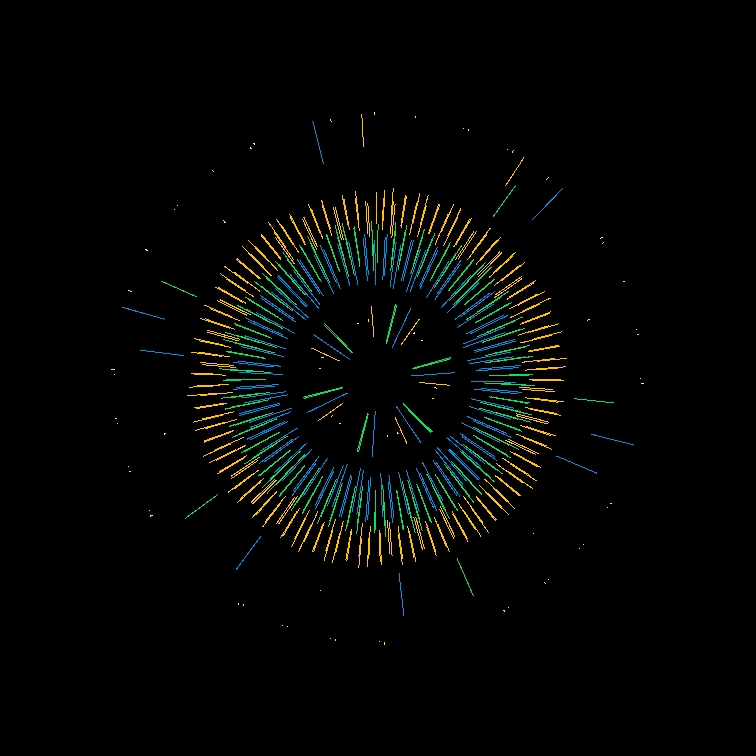
My project is a spirograph application. You can move the two radius sliders, and vary the line length to change the design the math equation will create (the radii must be different values for the DRAW button to work). There are three different math equations you can use to create different designs (spirograph, epitrochoid, or another cool equation). The square in the top right hand corner allows you to set the pen color when you click on the box. This will open up a color gradient. Click anywhere and the box in the bottom righthand will show you a preview of the color you clicked on. Once you are happy with your pen color, hit “ENTER”. This will take you back to the set up screen. Hit the DRAW button to watch your design be created. When watching your drawing, you may hit the back arrow button or press “LEFT ARROW” key to go back to the set up screen. That’s it! Enjoy being mesmerized by art created with math.

finalProject-ENM

/* Emma Nicklas-Morris
enicklas
Section B
Final Project
*/ 

// radius1 46, radius2 31, LL 30 -- cool design

// point to draw the lines for the design
var x1;
var y1;
var x2 = x1;
var y2 = y1;

// used in sprigraph equations
var scaleN = 2.8;
var i = 0; // counter
var r1 = 10;
var r2 = 11;
var p = 2; // length of line from center

// used in other cool math equation
var l = p / r1;
var k = r1 / r2;

// epitrochoid equation variables
var a;
var b;

// drawing button
var drawing = false;
var justClicked = false; 
// back button
var backB = 30;
var backBX = 21;

var buttons = [];
var buttonText = [];
var equationText = [];
var equationCount = 1; // counts times the equation button is clicked
var e; // index to get the right equation displayed

var r1x = 25; // x position of radius 1 slider
var ry = 50; // y position for slider
var r2x = 175; // x position of radius 2 slider
var r1Min = 25; // min x position for radius 1
var r1Max = 125; // max x position for radius 1 
var r2Min = 175; // min x position for radius 2
var r2Max = 275; // max x position for radius 2
var radMin = 10; // user min for radii
var rad2Max = 70; // user radius 2 max
var rad1Max = 100; // user radius 1 max
var llMin = 2; // user line length min
var llMax = 65; // user line length max
var px = 315; // x position of line length (p)
var pMin = 315; // min x position of line length (p)
var pMax = 415; // max x position of line length (p)
var dragging = false;
var sliderCol = 170;

// which radius slider is clicked
var rad1 = false; 
var rad2 = false;
var lineL = false;
var rd = 12; // ball slider diameter
var r1Num = 10; // radius1 number displayed to user
var r2Num = 10; // radius2 number displayed to user
var lineNum = 5; // line length number displayed to user
var r12;        // radius1 - radius2
var diffRadii = false; // can't have the same radii

var backCol = 240; // background color
var userCol = 100; // intializes pen color
var gradSection = 84; // max width of each gradient section
var choosing = false;

var radius2; // object text for radius 2
var lineLen; // object text for line length

// location for elements on the screen
var diffRadX = 150;
var diffRadY = 100;
var eqX = 20;
var eqY = 30;
var rad2X = 190;
var llX = 320;
var colorX = 445;
var colorY = 25;
var colorMid = 165;
var colorPink = 147;
var eqW = 120;


function setup() {
	createCanvas(500, 400);
	background(backCol);
	frameRate(40);

}

function draw() {
	// stroke(cos(i/10)*(255/2), 0, sin(i/20)*(255/2), i);
	
	// screen mode: draws the spirograph
	if ((drawing) & (diffRadii)) {

		// back button on draw screen
		drawBackButton();

		// hide all setting buttons when in draw mode
		if (justClicked) {
            fill(backCol);
            rect(0, 0, width, height);
            justClicked = false; 
		}
		
        x1 = width / 2;
        y1 = height / 2;

        // spirograph
        if (e === 0) {
            spirograph();
            
        }

        // Epitrochoid
        else if (e === 1) {
            epitrochoid();
        }

        // other cool math equation
        else if (e === 2) {
            other();
        }

	}

	// screen mode: set the settings
	else {
		noStroke();
		// new screen -- hides drawing
		fill(backCol);
		rect(0, 0, width, height);

        // draws the buttons
		makeAndDrawButtons();
        makeTextForButtons();
        drawText();
        displayEquation();
        
        // which slider user is dragging
        checkDragging();

        // draw choose color button
        chooseColor();

        // draw radius sliders
        radiusSliders();

        // draws the example circles for the math
        exampleCircles();

        // line length (p)
        drawLineLength();

        // can't draw using the same radii
        checkRadii();

        // choosing pen color
        choosePenColor();

		// reset equation variables
		x1 = width / 2;
		y1 = height / 2;
		x2 = undefined;
		y2 = undefined;
		i = 0;   

	}

    i += 0.1;

}

function checkDragging() {
    if (dragging) {
        if (rad1) {
            r1x = mouseX;
        }
        else if (rad2) {
            r2x = mouseX;
        }

        else if (lineL) {
            px = mouseX;
        }
    }
}

function drawLineLength() {
    if (e === 0) { // spirograph color pallete
        stroke("#65cdca");
    }

    else if (e === 1) { // epitrochoid color pallete
        stroke("#c26571");
    }

    else if (e === 2) { // other cool equation color pallete
        stroke("#a0e3b9")
    }

    line(width/2 + r12, height/2, width/2 + r12 - lineNum, height/2);
    ellipse(width/2 + r12, height/2, 2, 2);
    ellipse(width/2 + r12 - lineNum, height/2, 3, 3);
}

function exampleCircles() {
    strokeWeight(2);
    noFill();
    // radius 1 circle
    stroke(0);
    ellipse(width/2, height/2, 2*r1Num, 2*r1Num);

    // radius 2 circle
    if (e === 0) { // spirograph
        stroke("#3f807e");
    }

    else if (e === 1) { // epitrochoid
        stroke("#82444c");
    }

    else if (e === 2) { // other cool equation
        stroke("#3d5747")
    }

    
    if ((e === 0) || (e === 2)) { // spirograph -- circles inside
        r12 = r1Num - r2Num;
    }

    else { // epitrochoid -- cirlces outside
        r12 = r1Num + r2Num;
    }

    ellipse(width/2 + r12, height/2, 2*r2Num, 2*r2Num);
    
}

function choosePenColor() {
    if (choosing) {
        noStroke();
        fill(255);
        rect(0 ,0, width, height);
        
        // the six color gradients
        gradient();

        // color box to see which color is clicked
        stroke(0);
        strokeWeight(2);
        fill(userCol);
        rect(445, 350, 30, 30);
    }
}

function checkRadii() {
    if (diffRadii == false) {
        noStroke();
        if (e === 0) { // spirograph
            fill("#65cdca");
        }

        else if (e === 1) { // epitrochoid
            fill("#c26571");
        }

        else if (e === 2) { // other cool equation
            fill("#a0e3b9");
        }
        
        textSize(18);
        text("Please choose two different radii", diffRadX, diffRadY);
    }
}

function spirograph() {
    // update spirograph variables according to user input
    r1 = r1Num;
    r2 = r2Num;
    p = lineNum;
    k = r2 / r1;

    x1 += scaleN*(r1 - r2)*cos(k*i) + p * cos((1-k)*i);
    y1 += scaleN*(r1-r2)*sin(k*i) - p * sin((1-k)*i);
    
    
    strokeWeight(2);
    stroke(userCol);
    // draw small portion of design
    line(x2, y2, x1, y1);
    noStroke();

    x2 = x1;
    y2 = y1;
}

function epitrochoid() {
    r1 = r1Num;
    r2 = r2Num;
    p = lineNum;
    a = r1 + r2;
    b = a / r2;
    scaleN = .9;

    x1 += scaleN*a*cos(i) - p * cos(b*i);
    y1 += scaleN*a*sin(i) + p * sin(b*i);

    stroke(userCol);
    strokeWeight(2);
    line(x2, y2, x1, y1); // draw small portion of design
    noStroke();
    x2 = x1;
    y2 = y1;
}

function other() {
    // update spirograph variables according to user input
    r1 = r1Num;
    r2 = r2Num;
    p = lineNum;
    l = p / r1;
    k = r2 / r1;
    scaleN = 2;

    x1 += scaleN*r1*((1-k)*Math.cos(i) + l*k*cos(i*((1-k)/k)));
    y1 += scaleN*r1*((1-k)*Math.sin(i) + l*k*sin(i*((1-k)/k)));
    
    stroke(userCol);
    strokeWeight(2);
    line(x2, y2, x1, y1); // draw small portion of design
    noStroke();
    x2 = x1;
    y2 = y1;
}

function makeAndDrawButtons() {
    // make the buttons
        var drawButton = makeButton(7/9 * width, 6/7 * height, 4 * eqX, eqY, "rect");
        drawButton.color(0);
        buttons.push(drawButton);

        var equationB = makeButton(eqX, 7/8 * height, diffRadX, eqY - 5, "rect");
        equationB.color(0);
        buttons.push(equationB);

        // draw all the buttons
        for (var b = 0; b < buttons.length; b++) {
            buttons[b].draw();  
        }
}

function makeTextForButtons() {
    // make text for buttons
        var textOnButton = makeText("DRAW", 7/9 * width + 9, height - eqY - 5, eqX);
        textOnButton.color(240);
        buttonText.push(textOnButton);

        var spiro = makeText("SPIROGRAPH", eqX * 2, height - eqY - 1, 16);
        spiro.color("#65cdca");
        equationText.push(spiro);

        var epi = makeText("EPITROCHOID", eqX * 2, height - eqY - 1, 16);
        epi.color("#c26571");
        equationText.push(epi);

        var other = makeText("COOL EQUATION 3", eqX + 6, height - eqY - 1, 15);
        other.color("#a0e3b9");
        equationText.push(other);

        var radius1 = makeText("Radius 1", eqX * 2, eqY, 18);
        radius1.color(0);
        buttonText.push(radius1);

        radius2 = makeText("Radius 2", rad2X, eqY, 18);
        radius2.color("#3f807e");
        buttonText.push(radius2);

        lineLen = makeText("Line Length", llX, eqY, 18);
        lineLen.color("#65cdca");
        buttonText.push(lineLen);
        
}

function drawText() {
    textAlign(LEFT);

    // change color pallete based on math equation
    
    if (e === 1) { // purple-pink: epitrochoid
        lineLen.color("#c26571");
        radius2.color("#753d45")
    }

    else if (e === 2) {
        lineLen.color("#a0e3b9");
        radius2.color("#3d5747");
    }

    // draw the button's text
    for (var t = 0; t < buttonText.length; t++) {
        buttonText[t].draw();
    }
}

function radiusSliders() {
    ellipseMode(CENTER);
    stroke(sliderCol);
    strokeWeight(3);
    // radius 1
    line(r1Min, ry, r1Max, ry);
    noStroke();
    fill(0);
    r1x = constrain(r1x, r1Min, r1Max);
    ellipse(r1x, ry, rd, rd);
    textAlign(CENTER);
    r1Num = floor(map(r1x, r1Min, r1Max, radMin, rad1Max));
    text(str(r1Num), r1x, ry + 2 * rd);

    // radius 2
    stroke(sliderCol);
    strokeWeight(3);
    line(r2Min, ry, r2Max, ry);
    noStroke();
    fill(0);
    r2x = constrain(r2x, r2Min, r2Max);
    ellipse(r2x, ry, rd, rd);
    r2Num = floor(map(r2x, r2Min, r2Max, radMin, rad2Max));
    text(str(r2Num), r2x, ry + 2 * rd);

    // line length
    stroke(sliderCol);
    strokeWeight(3);
    line(pMin, ry, pMax, ry);
    noStroke();
    fill(0);
    px = constrain(px, pMin, pMax);
    ellipse(px, ry, rd, rd);
    lineNum = floor(map(px, pMin, pMax, llMin, llMax));
    text(str(lineNum), px, ry + 2 * rd);

    // radii can't be same size
    if (r1Num === r2Num) {
        diffRadii = false;
    }
    
    else {
        diffRadii = true;
    }
}


// button for the user to chose their pen color
function chooseColor() {
    stroke(0);
    strokeWeight(2);
    fill(userCol);
    rect(colorX, colorY, eqY, eqY);
}

function gradient() {
    //gradient red to orange
    for (var r = 0; r < gradSection; r += 2) {
        var startR = color(255, 0, 0); // red
        var endO = color(255, colorMid, 0); // orange
        for (var c = 0; c < height; c += 2) {
            var interCol1 = lerpColor(startR, endO, r/(width/6));
            var white = color(255);
            var interLight1 = lerpColor(interCol1, white, c/height);
            fill(interLight1);
            rect(r, c, 2, 2);
        }
    }

    // gradient orange to yellow
    for (var r = 0; r < gradSection; r += 2) {
        var startO = color(255, colorMid, 0); // orange
        var endY = color(255, 255, 0); // yellow
        for (var c = 0; c < height; c += 2) {
            var interCol2 = lerpColor(startO, endY, r/(width/6));
            var interLight2 = lerpColor(interCol2, white, c/height);
            fill(interLight2);
            rect(r + gradSection, c, 2, 2);                
        }
    }

    // gradient yellow to green
    for (var r = 0; r < gradSection; r += 2) {
        var startY = color(255, 255, 0); // yellow
        var endG = color(0, 255, 0); // green
        for (var c = 0; c < height; c += 2) {
            var interCol3 = lerpColor(startY, endG, r/(width/6));
            var interLight3 = lerpColor(interCol3, white, c/height);
            fill(interLight3);
            rect(r + 2 * gradSection, c, 2, 2);               
        }
    }

    // gradient green to blue
    for (var r = 0; r < gradSection; r += 2) {
        var startG = color(0, 255, 0); // green
        var endB = color(0, 0, 255); // blue
        for (var c = 0; c < height; c += 2) {
            var interCol4 = lerpColor(startG, endB, r/(width/6));
            var interLight4 = lerpColor(interCol4, white, c/height);
            fill(interLight4);
            rect(r + 3 * gradSection, c, 2, 2);               
        }
    }

    // gradient blue to purple
    for (var r = 0; r < gradSection; r += 2) {
        var startB = color(0, 0, 255); // blue
        var endPp = color(colorMid, 0, colorMid); // purple
        for (var c = 0; c < height; c += 2) {
            var interCol5 = lerpColor(startB, endPp, r/(width/6));
            var interLight5 = lerpColor(interCol5, white, c/height);
            fill(interLight5);
            rect(r + 4 * gradSection, c, 2, 2);               
        }
    }

    // gradient purple to pink
    for (var r = 0; r < gradSection; r += 2) {
        var startPp = color(colorMid, 0, colorMid); // purple
        var endPk = color(255, eqX, colorPink); // pink
        for (var c = 0; c < height; c += 2) {
            var interCol6 = lerpColor(startPp, endPk, r/(width/6));
            var interLight6 = lerpColor(interCol6, white, c/height);
            fill(interLight6);
            rect(r + 5 * gradSection, c, 2, 2);               
        }
    }
}

function displayEquation() {
    // switch between the 2 equations

        if (equationCount % 3 === 1) {
            e = 0; // spirograph
        }

        else if (equationCount % 3 === 2) {
            e = 1; // Epitrochoid
        }

        else if (equationCount % 3 === 0) {
            e = 2;
        }

        // draw the equation name
        eText = equationText[e];
        fill(eText.tColor);
        textSize(eText.size);
        text(eText.t, eText.x, eText.y);
}

// back button to setting screen
function drawBackButton() {
	var backButton = makeButton(backB, backB, backB, backB, "ellipse");
		backButton.color(0);
        noStroke();
		backButton.draw();
		stroke(255);
		strokeWeight(2);
        // arrow
		line(backBX, backB, backB, backB + 8);
		line(backBX, backB, backB, backBX + 1);
		line(backBX, backB, backB + 9, backB);
}

// Object: Creates Buttons
function makeButton(bx, by, bw, bh, bShape) {
	var button = {x: bx, y: by, bColor: color(0),
				  shape: bShape, w: bw, h: bh,
				  draw: displayButton, color: setbColor}
	return button
}

// draws the buttons
function displayButton() {
	fill(this.bColor);
	if (this.shape == "rect") {
		rect(this.x, this.y, this.w, this.h);
	}
	else if (this.shape === "ellipse") {
		ellipse(this.x, this.y, this.w, this.h);
	}
}

// sets the button color
function setbColor(c) {
	this.bColor = color(c);
}

// Object: Creates text
function makeText(input, tx, ty, tSize) {
	var textForButton = {x: tx, y: ty, size: tSize, tColor: color(backCol),
						 t: input, draw: displayText, color: setTColor}
	return textForButton;
}

// draw the text
function displayText() {
	fill(this.tColor);
	textSize(this.size);
	text(this.t, this.x, this.y);
}

// set the text color
function setTColor(c) {
	this.tColor = color(c);
}

function mousePressed() {

	// click draw button to go to draw mode
	if ((mouseX > 7/9 * width) & (mouseX < 7/9 * width + 80) 
		&& (mouseY > 6/7 * height) && (mouseY < 6/7 * height + 30)
		&& (drawing == false) && (diffRadii)) {
		drawing = ! drawing;
		justClicked = true;
	}

    // back button -- send to settings screen
	else if (dist(mouseX, mouseY, backB, backB) <= backB / 2) {
		drawing = false;
	}

    // 3 math equations -- button to rotate the math equations
    else if ((mouseX > eqX) & (mouseX < eqX + eqW) 
        && (mouseY > 7/8 * height) && (mouseY < 7/8 * height + eqY - 5)
        && (drawing == false)) {
        equationCount += 1;
    }

    // drag radius 1 slider
    if (dist(r1x, ry, mouseX, mouseY) < rd / 2) {
        dragging = true;
        rad1 = true;
        justClicked = false;
        drawing = false;

    }

    // drag radius 2 slider
    else if (dist(r2x, ry, mouseX, mouseY) < rd / 2) {
        dragging = true;
        rad2 = true;
        justClicked = false;
        drawing = false;
    }

    // drag line length slider
    else if (dist(px, ry, mouseX, mouseY) < rd / 2) {
        print("t");
        dragging = true;
        lineL = true;
        justClicked = false;
        drawing = false;

    }

    // click inside color box
    if ((mouseX <= colorX + eqY) & (mouseX >= colorX)
        && (mouseY <= colorY + eqY) && (mouseY >= colorY) 
        && drawing === false) {
        choosing = true;
    }

    // set pen color to user's click
    if (choosing) {
        userCol = color(get(mouseX, mouseY));
    }
}

function mouseReleased() {
    dragging = false;
    rad1 = false;
    rad2 = false;
    lineL = false;
}

function keyPressed() {
    // use left arrow key to go back to the settings screen
    if ((drawing) & (keyCode === LEFT_ARROW)) {
        drawing = false;
    }

    // set pen color by hitting enter key
    if ((choosing) & (keyCode === ENTER)) {
        choosing = false;
    }
}

Emma NM-Project-12(Proposal)

For my final project, I want to create an interactive create your own spirograph! Spirographs change and look different based on two circle radii, so I want to let the user choose the different sizes of the circles to create different spirographs. I also plan on including other types of math equations that create cool looking designs. This way the user can have the choice of what math equation and then also be able to set the size of certain aspects to change the design. I will have buttons and key presses for the user to be able to choose what he/she wants. I also plan on letting them chose the color. I am interested in experimenting with shapes as the lines.

I would like to be able to have two different “screens.” One to show the user the size of the circles to help them visualize the choices they’re making, and the second one is actually drawing the design.

Emma NM-LO-12

Playful Geometries project is a user generated visual and sound project. Users can pick up a tablet and push, toggle, or slide buttons to produce different images and sounds on the screen. Visuals stem from geometric shapes and use bright colors. artifish is a project that encapsulates a digital aquarium. The working prototype serves to represent fish moving in a pond. Future versions aim to allow users to add to the digital aquarium with a variety of unique digital creatures and vegetation. In Playful Geometries, I really like the experience of giving the user the ability to create their own art using shapes. I have always been drawn to geometry when having to start with a blank canvas. In artifish, I really like the potential of adding unique digital creatures and vegetation. The visuals they have for the other creatures and vegetation look like they stem from geometry/math.

In artifish, I think their fish look more like tadpoles/sperm than fish, so I think they could improve upon their visuals. As for Playful Geometries, I think it would’ve been cool to have user input to create their own shapes (new geometry) and see it inputed into the visual.

Playful Geometries (2014)

By Davide Della Casa and Patrick Gaunt

Playful Geometries in action

artifish (2014) by Richard Rodkin

artifish prototype

Cool digital creatures and vegetation they want to implement in future versions.

Emma NM-Project-11(Landscape)

generativeLandscape

/* 
Emma Nicklas-Morris
Section B
enicklas
Project-11
Generative Landscape
*/

var waterSpeed = 0.0002;
var waterDetail = 0.002;
var c2, c5; // gradient colors

var yPos = []; // water y position
var tubers = [];

var r1 = 50;

function setup() {
    createCanvas(450, 300);
    frameRate(10);

    // colors for water gradient
    c2 = color("#8cbaba");
    c5 = color("#005364");
}
 
function draw() {
    setGradient(c2, c5);
    // draw water
    water();

    // the sun
    noStroke();
    fill("#FFE484");
    ellipse(width - r1, r1, r1+10, r1+10);
    fill("#FFCC33");
    ellipse(width - r1, r1, r1, r1);

    updateAndDisplayTuber();
    removeTubers();
    addTuber();

}

function water() {
    noFill(); 
    beginShape();
    stroke("skyblue");

    // draw the water that varies in height
    for (var x = 0; x < width; x++) {
        var t = (x * waterDetail) + (millis() * waterSpeed);
        var y = map(noise(t), 0,1, height/2, 3/4*height);
        line(x, y, x, -300); // illusion that the bottom water is changing height
        
        // only keep y positions that are on the screen
        if (yPos.length > width) {
            yPos.shift();
        }
        yPos.push(y);
    }
    endShape();
}

function addTuber() {
    var probability = 0.08;
    // randomly make a new tuber as long as there are no more than
    // 5 tubers on screen at once
    if ((random(0,1) < probability) & (tubers.length < 5)){
        var yT = yPos[width];
        var t = makeTuber(width, yT - 15);
        // set the color of the tube
        var r = random(255);
        var g = random(255);
        var b = random(255);
        var c = color(r, g, b);
        t.setColor(c);
        tubers.push(t); // add tuber into list
    }
}

function removeTubers() {
    for (var j = 0; j < tubers.length; j++) {
        // if the tuber goes off the screen, remove from list
        if (tubers[j].x + 50 < 0) {
            tubers.splice(j, 1);
        }
    }
}

function makeTuber(x1, y1) {
    var tuber = {x: x1, y: y1, hSize: 17, bWidth: 10, bH: 25, 
                 color: color(128), move: moveTuber,
                 drawT: drawTuber, setColor: setTubeColor
                }
    return tuber;
}

// draw and update position of tuber
function updateAndDisplayTuber() {
    for (var i = 0; i < tubers.length; i++) {
        tubers[i].drawT();
        tubers[i].move();
    }
}

function moveTuber() {
    this.x -= 12.0;
}

function drawTuber() {
    noStroke();
    fill(0);

    // head
    ellipse(this.x, this.y, this.hSize, this.hSize);
    
    // torso
    push();
    translate(this.x + this.bWidth, this.y + this.bWidth);
    rotate(radians(30));
    ellipse(0, 1, this.bH + 5, this.bWidth);
    pop();

    // thighs (legs)
    push();
    translate(this.x + 3 * this.bWidth, this.y + this.bWidth);
    rotate(radians(-20));
    ellipse(0, 5, this.bH, this.bWidth);
    pop();

    // calves (legs)
    push();
    translate(this.x + 2 * this.bH, this.y + 2 * this.bWidth);
    rotate(radians(40));
    ellipse(0, 0, this.bH, this.bWidth);
    pop();

    // tube
    fill(this.color);
    ellipse(this.x + 20, this.y + 20, this.bH * 2, 1.5 * this.bWidth);
}

function setTubeColor(c) {
    this.color = c;
}

// color gradient for the water
function setGradient(c1, c2) {
  noFill();
  for (var z = height/2; z < height; z++) {
    var inter = map(z, height/2, height, 0, 1);

    var c = lerpColor(c1, c2, inter);

    stroke(c);
    line(0, z, width, z);
  }
}


I struggled a lot to get my object of Tubers to work and move with my water. There were a lot of “moving” parts to figure out and I had trouble when I tried to add lots of different elements at once. So once I slowed down and tried to get small parts, one at a time, I began to make more progress. I really like how my water looks. It was fun to experiment with gradients this project. Enjoy tubing 🙂

Sketch of my landscape

Emma NM-Project-10(Interactive Sound)

To hear the animal’s sound, click on the image. The four sounds are a dog barking, duck quacking, cat meowing, and cow mooing. To turn the sound off, click the image again.

sound

/* 
Emma Nicklas-Morris
Section B
enicklas
Project-10
Interactive Sound
*/


var cowSound;
var duckSound;
var catSound;
var dogSound;

var dogImg;
var cowImg;
var duckImg;
var catImg;
var adj = 10;


function preload() {
    // load my 4 animal sounds and images
    cowSound = loadSound("https://courses.ideate.cmu.edu/15-104/f2019/wp-content/uploads/2019/10/cow.wav");
    duckSound = loadSound("https://courses.ideate.cmu.edu/15-104/f2019/wp-content/uploads/2019/10/duck.wav");
    catSound = loadSound("https://courses.ideate.cmu.edu/15-104/f2019/wp-content/uploads/2019/10/cat.wav");
    dogSound = loadSound("https://courses.ideate.cmu.edu/15-104/f2019/wp-content/uploads/2019/10/dog.wav");

    catImg = loadImage("https://i.imgur.com/nliPYUx.jpg");
    duckImg = loadImage("https://i.imgur.com/mwzKbS9.jpg");
    cowImg = loadImage("https://i.imgur.com/u6LpEOD.jpg");
    dogImg = loadImage("https://i.imgur.com/0tT7kPQ.jpg");

}


function setup() {
    createCanvas(500, 400);
    useSound();

}


function soundSetup() {
    cowSound.setVolume(.5);
    catSound.setVolume(2);

}


function draw() {

    background("lightblue");

    // display the 4 animal images
    image(catImg, width/2 - adj, 0, catImg.width/2, catImg.height/2);
    image(duckImg, 0, 0, duckImg.width/5, duckImg.height/5);
    image(dogImg, -3 * adj, height/2, dogImg.width/2, dogImg.height/2);
    image(cowImg, width/2 + adj + 6, height/2, cowImg.width/1.5 , cowImg.height/1.5);

}


function mousePressed() {
    // when you click on duck picture, play quack sound
    // to turn off, click again.
    if ((mouseX < duckImg.width/5) & (mouseY < duckImg.height/5)) {
        if (duckSound.isLooping()) {
            duckSound.stop();
        }
        else {
            duckSound.loop();
        }

    }

    // when you click on cat picture, play meow sound
    // to turn off, click again.
    else if ((mouseX > duckImg.width/5) & (mouseY < height/2)) {
        if (catSound.isLooping()) {
            catSound.stop();
        }
        else {
            catSound.loop();
        }

    }

    // when you click on dog picture, play barking sound
    // to turn off, click again.
    else if ((mouseX < width/2 + adj + 6) & (mouseY > duckImg.height/5)) {
        if (dogSound.isLooping()) {
            dogSound.stop();
        }
        else {
            dogSound.loop();
        }

    }

    // when you click on cow picture, play mooing sound
    // to turn off, click again.
    else if ((mouseX > width/2 + adj + 6) & (mouseY > height/2)) {
        if (cowSound.isLooping()) {
            cowSound.stop();
        }
        else {
            cowSound.loop();
        }

    }
}

I struggled a lot to get my sounds to work, most of it was something I didn’t quite understand with how p5.js needs to have the sound library called in the html. I also learned that sounds take up a lot of browsing cache, so to help keep your page refreshing properly, you need to clear your cache often when using sounds. My idea is geared towards a pre-school/kindergarten activity. It would allow them to learn what animals make what sounds.

Emma NM-LO-10

Sonic Playground in Atlanta

Sonic Playground (2018) – Yuri Suzuki Design

Sonic Playground was an outdoor sound installation in Atlanta, Georgia that features colorful sculptures that modify and transmit sound in an unusual but playful way. I admire how the art installation engages the community in an art experience and gives people the opportunity to explore how sound is constructed, altered, and experienced. I like that it is for all people, regardless of age. Anyone can enjoy it. The installation itself is not computational, but they used Rhinoceros 3D to create a raytracing tool that allows the user to choose certain aspects of the sounds path. Users could “select a sound source and send sound in a certain direction or towards a certain geometry, in this case the shape of the acoustic mirrors or the bells at the start and end of the pipes to see how the sound is reflected and what is the interaction with the object.”

The artist’s creativity comes out in the path and shapes he chose for the final sculptures, thus influencing the sound that comes out. He decided which sounds were more interesting and the path it takes to make that sound. 

Sonic Playground Installation
Raytracing using Rhinoceros 3D

Emma NM-LO-11

Caroline Sinders Nudge

Caroline Sinders created a prototype of a wearable watch that told time in terms of user’s schedule. She uses Python, Google Calendar API, Arduino, LEDs, Illustrator to create this prototype. I like that it is a new way of thinking about time and the idea makes sense to me. We typically only want to know the time in reference to an event, so this watch will tell us how much time we have left until that event. I would be curious to try this way of telling time out and see how it works for me.

Caroline Sinders is in her own words a “machine learning designer/user researcher, artist, and digital anthropologist.” She is interested in natural language processing and how it intersects with artificial intelligence, abuse, online harassment, and politics in digital, conversational spaces. She founded Convocation Design + Research agency. Here they focus on the intersections of machine learning, user research, designing for public good, and solving difficult communication problems.

Emma NM-Project-09(Custom Pixels)


customPixels

/* 
Emma Nicklas-Morris
Section B
enicklas
Project-09
Custom Pixels
*/

var portraitImg;

function preload() {
    var myImageURL = "https://i.imgur.com/Zfspsky.jpg";
    portraitImg = loadImage(myImageURL);
}

function setup() {
    // canvas proportional to image size
    createCanvas(portraitImg.width / 6, portraitImg.height / 6);
    background(255);
    portraitImg.loadPixels();
    frameRate(150);

}

function draw() {
    // get pixel color at that random location in image
    var ix = floor(random(portraitImg.width));
    var iy = floor(random(portraitImg.height));
    var colorLoc = portraitImg.get(ix, iy);

    noStroke();
    fill(colorLoc);

    // scale it to canvas size
    x = map(ix, 0, portraitImg.width, 0, width);
    y = map(iy, 0, portraitImg.height, 0, height);
    
    // creates a spiral like look
    var d = dist(width / 2, height / 2, x, y);
    d = d % 10;

    // draws the hexagons
    polygon(x, y, d, 6);


}

// https://p5js.org/examples/form-regular-polygon.html 
function polygon(x, y, radius, npoints) {
  let angle = TWO_PI / npoints;
  beginShape();
  for (let a = 0; a < TWO_PI; a += angle) {
    let sx = x + cos(a) * radius;
    let sy = y + sin(a) * radius;
    vertex(sx, sy);
  }
  endShape(CLOSE);
}

I really enjoyed this project. It was fun to see it come about. I wanted to make my generative pixel image to be a bit more interesting by adding a circular/spiral like look and use hexagons instead of circles or rectangles. 

Emma NM-LO-09

Jenny Lee’s LO-06

eCLOUD by Aaron Koblin

I took a look at Jenny Lee’s Looking Outward post for week 6. It examined the project eCLOUD, which is an every change sculpture of a cloud. I think this project is so cool. The way the cloud changes the degree of brightness based on the weather to emulate a real cloud is so fascinating. I saw a bit in the video of when it was storming, the cloud flashed white briefly to mimic lightning. I would agree with my peer’s thoughts. She and I both agree this project is really cool based on it’s physical appearance and the connection to real weather. One thing that I don’t like very much is that the eCLOUD changes cities every few moments. I feel like the audience would not even realize that the cloud changed city when looking at it for a longer time than minute. I would also love to visit this airport to see it in person, but I wonder if updates could be provided after so many years? Maybe look into changing the shape of the cloud in addition to the brightness of each panel?

eCLOUD installed in San Jose Airport

Permanent Installation between gates 22 and 23 in San Jose International Airport

Emma NM-LO-08

Dear Data

Giorgia Lupi is an information designer at Accurat (data-driven research, innovation, and design), based in New York and Milan. She works to create visual narratives that use data to connect it to what it is: knowledge, behaviors, people. Stefanie Posavec is a data designer from the UK. She tends to use hand-crafted methods to create non-traditional representations of data from language, literature, or scientific areas.

I really enjoyed how they collaborated together and learned new things about each other through data and drawings. I am also really interested in design, so for the dear data project cards to hold data, but in an interesting visual way was cool to me. I liked their thought process of how they created the data visualization.

They talk a lot about their thought process and how they were feeling/felt throughout it. They also mentioned their insights and a reflection of the project. To convey the project, they almost told it as if it were story, after all, postcards are short stories. I think it’s important to include insights and reflection/things you learned when sharing a project. It shows that the project was more than just “moving through the motions” and helps you understand what you’ve learned.