Emma NM-Project-07(Curves)

curves

/* 
Emma Nicklas-Morris
Section B
enicklas
Project-07
Curves
*/

var numP = 200;


function setup() {
    createCanvas(400, 400);

}

function draw() {
    background("#F9CDAD");
    
    // curve name
    noStroke();
    textAlign(CENTER);
    textSize(24);
    fill("black");
    text("Hypocycliod", width / 2, 35);

    // draws hypocycloids
    drawHypocycloid(10, 0, "#FC9D9A"); // light pink one 
    drawHypocycloid(7, 30, "#FE4365"); // bright pink one
    drawHypocycloid(4, 60, "#AE1F3A"); // dark pink one
    drawHypocycloid(1, 90, "#610819"); // maroon one
}

function drawHypocycloid(scale, rotation, color) {
    // Hypocycliod:
    // http://mathworld.wolfram.com/Hypocycloid.html

    // effects number of points and the shape of the hypocycloid and size
    var a = constrain(mouseX, 118, 300) / 20;
    // as the mouse moves down, number of points decrease
    var b = constrain(mouseY, 20, 200) / 100;
    var n = a / b;
    var o = mouseY - (mouseX / 75); // outline size on shape

    strokeWeight(o);
    stroke(color);
    noFill();

    push();
    translate(width / 2, height / 2); // center of canvas
    rotate(rotation);
    beginShape();
    for (var i = 0; i < numP; i++) {
        var p = map(i, 0, numP, 0, TWO_PI);

        // equation for hypocycloid
        var x = ((a / n) * ((n - 1) * cos(p) - cos((n - 1) * p)));
        var y = ((a / n) * ((n - 1) * sin(p) + sin((n - 1) * p)));
        vertex(scale * x, scale * y);

    }
    endShape(CLOSE);
    pop();
}


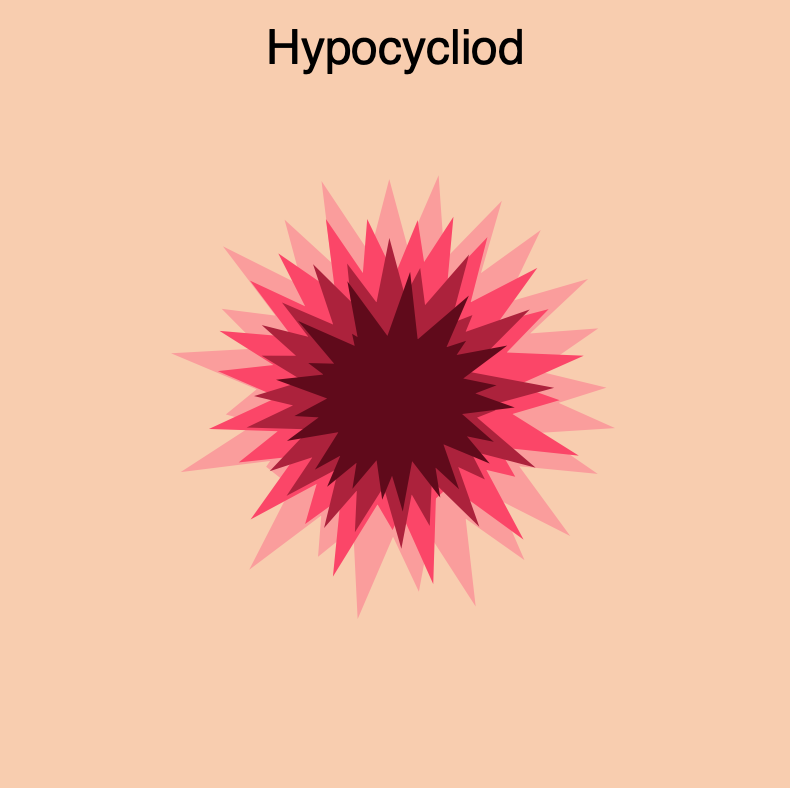
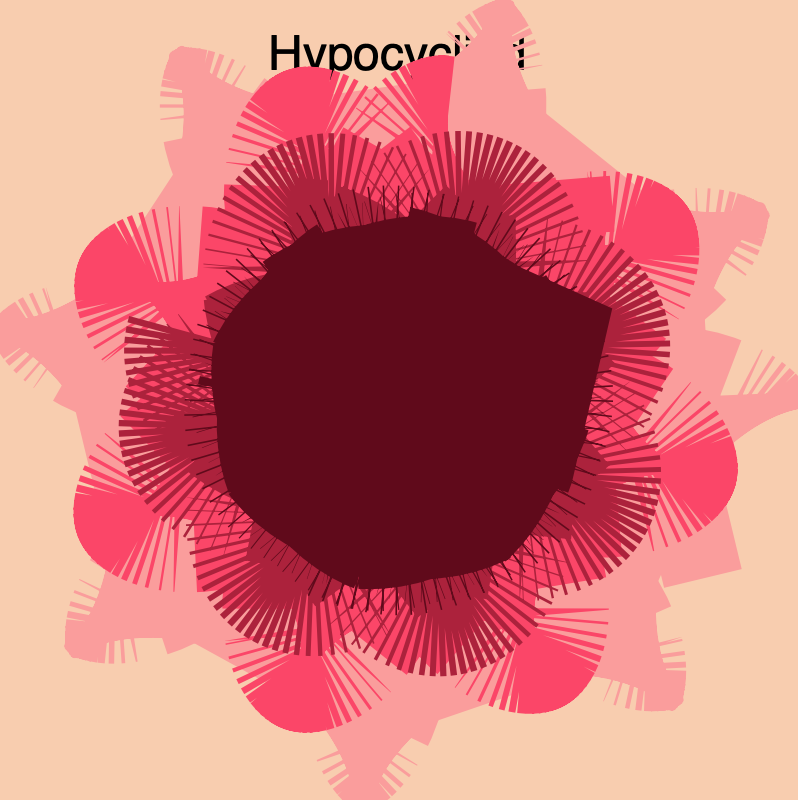
This project seemed daunting at first because I have not done any math in awhile, but once I realized that I could just type the equation for creating a curve it became more exciting. It took me a while to choose a curve. I was interested in one that had multiple points or leafs. I also wanted to use mouseX and mouseY to control how many points/leaf were show at a time. Then, I thought about using mouse position to also control the outline size. Finally, I decided to use scale to make several hypocycloids to make the drawing more interesting. I find the upper right hand corner most interesting and the lower right hand corner the least interesting. Ideally, I wish the maroon hypocycloid didn’t look like such a big blog when the mouse is in the bottom right hand corner because the lines beneath it seem interesting, but the top one block it. I think this was a fun assignment to play with.

Emma NM-LO-07

Stamen Design — Mapping the World’s Friendships

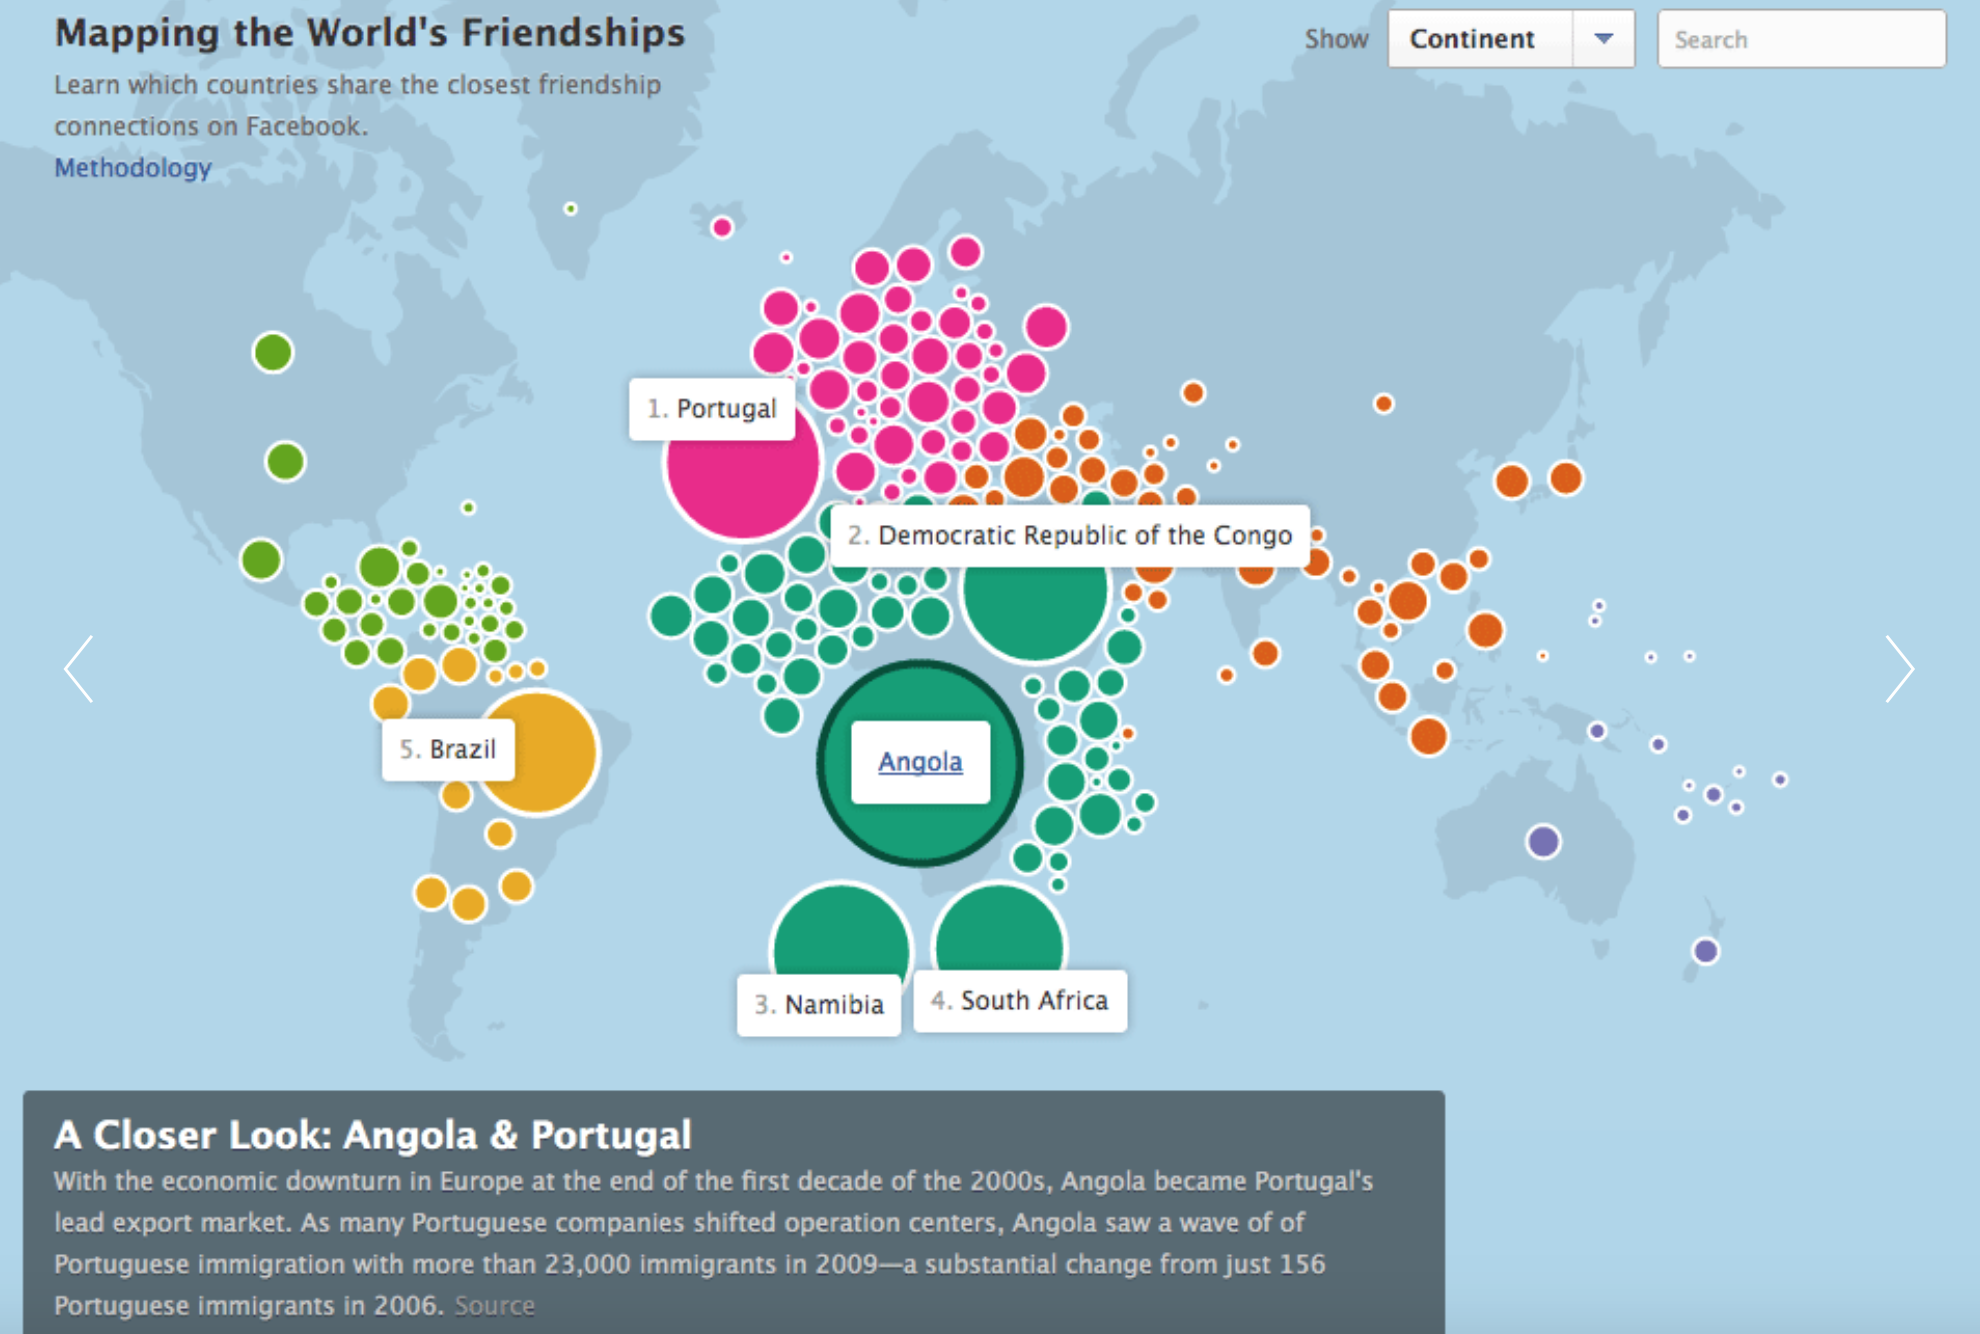
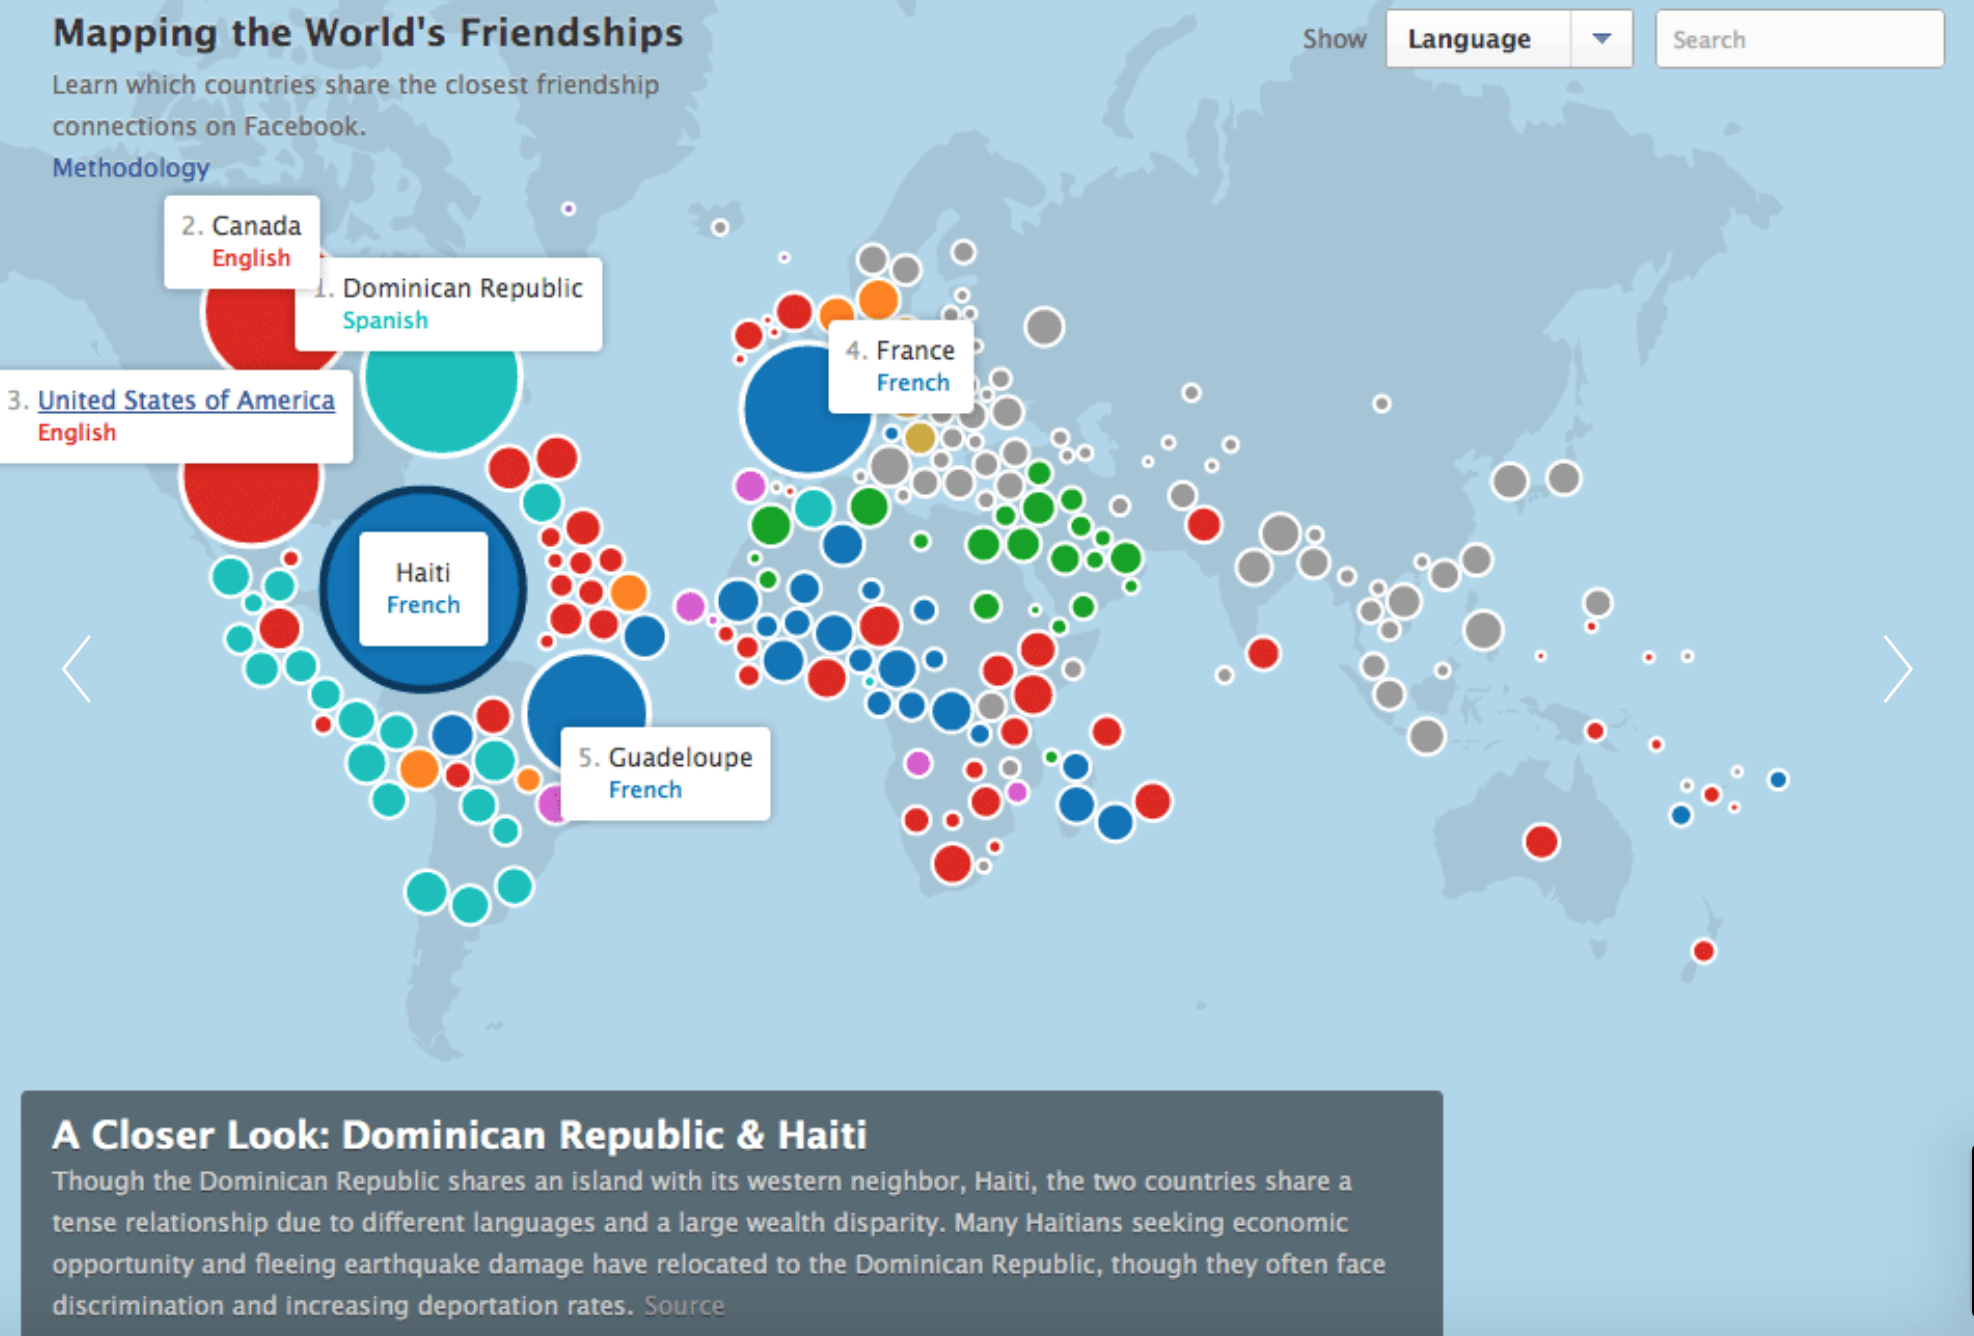
Data visualization is really interesting and cool to me. I found Stamen Design that mapped the world’s friendships through data visualization. It uses Facebook friendships the new stories feature to map interconnectedness between countries. The countries are divised by how many Facebook friendship there are between the countries, and the total number of Facebook friendships in that country. I found it interesting because you can see a bit of history through this project. You can tell where a country has been (ie. US occupied some far island in the 1980s). I think it is also really great to see us connecting outside of our country. It is important to have diverse friendships to learn about different cultures and nuances. The algorithm must map number of friendships to size and also group countries that have friendships together in the same color. The creator’s artistic sensibilities come through by how he/she chose to represent the data, specifically, the colors chosen and the use of circles to represent areas.

Emma NM-Project-06(Abstract Clock)

abstractClock

/* 
Emma Nicklas-Morris
Section B
enicklas
Project-06 (Abstract clock)
*/

var adj = 85;
var rMin = 200; // radius of min circle
var rH = 300; // radius of hour circle
var rectW = 18;
var rectH = 8;
var totMin = 60;
var hours = 12;
var mAngle = 6; // minute angle
var hAngle = 30; // hour angle
var start;
var stop;
// for color gradient
var center = 128;
var width2 = 127;
var y = - 165; // y position of rectangle


function setup() {
    createCanvas(400, 400);
     
}

function draw() {
    background("#f2f2f2");
    
    // sets the time
    var sec = nf(second(), 2);
    var min = nf(minute(), 2);
    var hourCir = hour() % hours; // accounts for a 12 hour clock, not 24 hour
    if (hourCir === 0) { // if 0, set to 12
        hourCir = numHours;
    }

    // draws the current time in the corner
    time = hourCir + ":" + min + ":" + sec; 
    textSize(20);
    fill("black");
    text(time, width - adj, adj/3);
    
    // draw hours circle
    drawHours();

    // draw minute circle
    drawMinute();
    
    // draws seconds on the outside
    drawSeconds();

}

function drawSeconds() {
    var secs = nf(second(), 2);
    var freq = .1;

    push();
    translate(width/2, height/2);
    for (var s = 0; s < 60; s ++) {
        rectMode(CENTER);

        // rotate the rectangles to make different circular patterns each second
        rotate(secs * mAngle);

        // color changes every second
        noStroke();
        red = sin(freq * secs) * width2 + center;
        b = sin(freq * secs + 2) * width2 + center;
        g = sin(freq * secs + 4) * width2 + center;
        fill(red, g, b);

        // draws rectangles
        rect(0, y, rectW, rectH);
            
    }

    pop();
}

function drawMinute() {
    // set minute value
    var mins = nf(minute(), 2);
    push();
    translate(width/2, height/2); // put in center of canvas
    noStroke();

    // // angles to get the left side of the purple wedge at 12 o'clock
    var top = 270;
    pAngle = mins / totMin; // slowly rotates circle constantly
    // smooth rotation for the minute 
    currAngle = mins * mAngle + (mAngle * pAngle);
    rotate(radians(currAngle + top));
    for (var m = 0; m < 360; m += 6) {
        var freq = .1;
        if (m === 0) { // if its the first wedge, start at 0
            start = 0;
        }
        else { // set the start position to the previous wedge's stop position 
            start = stop;
        }
        stop = start + TWO_PI * (1 / totMin); // sets the current wedge's stop position
        
        // colors based on sin wave to make rainbow
        i = m / 6;
        red = sin(freq * i) * width2 + center;
        b = sin(freq * i + 2) * width2 + center;
        g = sin(freq * i + 4) * width2 + center;
        fill(red, g, b);
        arc(0, 0, rMin, rMin, start, stop, PIE);
    }
    pop();
}

function drawHours() {
    //set the hour and minutes
    var hCir = hour() % hours;
    var mins = nf(minute(), 2);
    
    push();
    translate(width/2, height/2); // put in center of canvas
    noStroke();

    // angles to get the left side of the purple wedge at 12 o'clock
    var top = 270;
    partAngle = mins / totMin; // slowly rotates circle constantly
    // smooth rotation for the hour
    currAngle = hCir * hAngle + (hAngle * partAngle);
    rotate(radians(currAngle + top));

    // draws the 12 wedges
    for (var h = 0; h < 360; h += 30) {
        var freq2 = .2;
        if (h === 0) { // if its the first wedge, start at 0
            start2 = 0;
        }
        else { // set the start position to the previous wedge's stop position 
            start2 = stop2;
        }
        stop2 = start2 + TWO_PI * (1 / hours); // sets the current wedge's stop position
        
        // colors based on sin wave to make rainbow
        hWedge = h / 12;
        red2 = sin(freq2 * hWedge) * width2 + center;
        blue = sin(freq2 * hWedge + 2) * width2 + center;
        green = sin(freq2 * hWedge + 4) * width2 + center;
        fill(red2, green, blue);
        arc(0, 0, rH, rH, start2, stop2, PIE);
    }
    pop();
}


For this project I knew I wanted to use something with colors and have it still be readable to some degree. I came up with the idea of having the different colors being the “numbers” on the clock. For the seconds, I was thinking of doing rectangles increasing as it goes around the circle, but what I have in my final product, I think looks “cooler.” The most difficult part was trying to get the color gradient to work how I envisioned. As you play with the frequency, the colors change. Also, for the second, I struggled to get what I originally intended, but a happy accident happened and I like my final product. You can still tell the time to some degree. At 12:00:00 both circles will have the purple wedge at the top (left side exactly at top). And the 00 seconds have one single purple rectangle at the top too.

Emma NM-LO-06

Perlin noise was created by Ken Perlin in 1983 for a film he was working on, Tron. It helps to add randomness to CG renderings of natural elements like smoke, fire, and water. I admire that he created something most people don’t consider. When people watch movies, we don’t think to ourselves “hey that smoke looks random.” He created something that people “take for granted” as we watch movies and see realistic fire. The algorithms don’t use the random() function, but works to interpolate between random values which creating smoother transitions. The creator’s artistic sensibilities come through knowing when he/she has reached randomness that looks aesthetic, or in Perlin’s case, realistic.

Emma NM-Project-05(Wallpaper)

My Wallpaper

/* 
Emma Nicklas-Morris
Section B
enicklas
Project-05
Wallpaper
*/

// width and height of diamonds (squares)
var big = 100;
var med = 90;
var sm = 80;
var smaller = 70;
var smallest = 60;
var tiny = 20;

// space between diamonds (based off the large one)
var space = 20; 

function setup() {
    createCanvas(500, 500);
    background("#F5DEBB");
    for (var i = 0; i < 10; i++) {
        for (var j = 0; j < 10; j++) {
            noStroke();
            rectMode(CENTER);
            drawBig(i, j);
            drawMed(i, j);
            drawSm(i, j);
            drawSmaller(i, j);
            drawSmallest(i, j);
            tinyDiamond(i, j);
            blueDiamond(i, j);
        }
        
    }
    noLoop();

}

// Draws large purple diamond (square rotated)
function drawBig(i, j) {
    push();
    translate(width/2, -height/2);
    rotate(radians(45));
    fill("#581845")
    rect(big * i + space * i, big * j + space * j, big, big);
    pop();
}

// Draws medium purple-pink diamond (square rotated)
function drawMed(i, j) {
    adj = 7.5;
    push();
    translate(width/2, -height/2 - adj);
    rotate(radians(45));
    fill("#900C3F");
    nSpace = big - med + space
    rect(med * i + nSpace * i, med * j + nSpace * j, med, med);
    pop();
}

// Draws small magenta diamond (square rotated)
function drawSm(i, j) {
    adj = 15;
    push();
    translate(width/2, -height/2 - adj);
    rotate(radians(45));
    fill("#C70039");
    nSpace = big - sm + space
    rect(sm * i + nSpace * i, sm * j + nSpace * j, sm, sm);
    pop();
}

// Draws smaller orange diamond (square rotated)
function drawSmaller(i, j) {
    adj = 22.5;
    push();
    translate(width/2, -height/2 - adj);
    rotate(radians(45));
    fill("#FF5733");
    nSpace = big - smaller + space
    rect(smaller * i + nSpace * i, smaller * j + nSpace * j, smaller, smaller);
    pop();
}

// Draws smallest yellow diamond (square rotated)
function drawSmallest(i, j) {
    adj = 30;
    push();
    translate(width/2, -height/2 - adj);
    rotate(radians(45));
    fill("#FFC30F");
    nSpace = big - smallest + space
    rect(smallest * i + nSpace * i, smallest * j + nSpace * j, smallest, smallest);
    fill("#F5DEBB");
    rect(nSpace * i * 2, 0, space, height * 3); // split the diamonds into smaller ones
    rect(0, nSpace * j * 2, width * 3, space); // split the diamonds into smaller ones
    pop();
}

// Draws blue diamond on top of big diamond 
function blueDiamond(i, j) {
    push();
    translate(width/2, -height/3);
    rotate(radians(45));
    fill("#13B9BD");
    b = tiny /2;
    nSpace = big - b + space
    rect(b * i + nSpace * i, b * j + nSpace * j, b, b);
    pop();
}

// Draws tiny green diamond on top 
function tinyDiamond(i, j) {
    adj = 58.5
    push();
    translate(width/2, -height/2 - adj);
    rotate(radians(45));
    fill("#88D840");
    nSpace = big - tiny + space
    rect(tiny * i + nSpace * i, tiny * j + nSpace * j, tiny, tiny);
    pop();
}


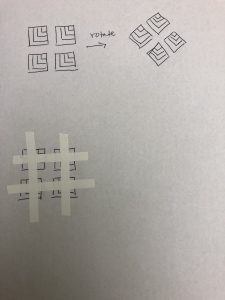
I knew I wanted to do something geometric and repetitive with the use of a nice color palette. I started with the idea of creating squares that would be rotated to look like diamonds. From there, I knew I wanted to create a bullseye-like effect where all of the diamonds start at the top corner. Once that was created, I played with the idea of creating more diamonds inside those larger diamonds. Finally, I created my color palette based the rainbow and incorporated smaller diamonds to add to the complexity.

Sketch of my Wallpaper

Emma NM-LO-05

Andreas Wannerstedt Instagram

“Waves” (2019)

"Waves by Andreas Wannerstedt

I like this project by Andreas Wannerstedt because it is so mesmerizing, yet simple. It causes a little tension for the viewer because the ball could get off pace and run into the poles. However, it never does, which makes it difficult to pull away from watching it. It reminds me of the now popular ASMR (autonomous sensory meridian response) videos. It is meant to relax the viewer. I also really like the design of it. The color choices work well together to make the video feel softer and more soothing. The algorithms must have been thought out to make sure that the speed of the balls never hit the poles as their speed also stayed constant. The creator’s artistic sensibilities are shown through color choice and object choice. They could have chosen different objects that move in a repetitive, hypnotic motion, yet they chose cylinders and balls.

Emma N-M-Project-04(String Art)


stringArt1

/* 
Emma Nicklas-Morris
Section B
enicklas
Project-04
String Art
*/

var x1StepSize = 4;
var y1StepSize = 1;
var x2StepSize = -2;
var y2StepSize = -20;
var x1;
var x2;
var y1;
var y2;


function setup() {
    createCanvas(400, 300);
    background("black");
    x1 = 0;
    y1 = 0;
    x2 = width/3 + 100;
    y2 = height/3 + 50;


}
 
function draw() {
    
    for (var i = 0; i < 350; i += 5) {
        push();
        translate(width/2, height);
        stroke(23, 233, 250);
        line(x1, y1, x2, y2);
        x1 += x1StepSize;
        y1 += y1StepSize;
        // x2 += x2StepSize;
        // y2 += y2StepSize;
        pop();

        stroke("hotpink");
        push();
        translate(width, height/2);
        rotate(degrees(90));
        line(x1, y1, x2, y2);
        // x1 += x1StepSize;
        // y1 += y1StepSize;
        x2 += x2StepSize;
        y2 += y2StepSize;
        pop();

        push();
        translate(0, 0);
        rotate(degrees(10));
        stroke("yellow");
        line(x1, height, width, y2);
        x1 += x1StepSize;
        pop();

        if (i % 25 === 0) {
            stroke("limegreen");
            line(0, y1, width-x2*2, height);
        }
    

    }

    
}

I started with playing around with different x and y positions, but then I didn’t like how static and boring it looked. So I moved to making circles with only lines.

stringArt2

/* 
Emma Nicklas-Morris
Section B
enicklas
Project-04
String Art
*/


var midpoinX;
var midpointY;
var r;
var ai;
var slope;
var b;
var x3;
var y3;
var x4;
var y4;
var k; 
var cosAg;
var sinAg;
var sinAi;
var scaledR;


function setup() {
    createCanvas(400, 300);
    

}
 
function draw() {
    background("black");

    var maxInc = 90; // maximum step increase in the for loop
    var minInc = 3; // minimum step increase in the for loop
    var d = (maxInc - minInc)/width; // value to change mouse position to a smaller value

    // keeps the mouse value inside the canvas
    if (mouseX >= width) {
        mouseX = width;
    }
    else if (mouseX < 0) {
        mouseX = 0;
    }

    if (mouseY > height) {
        mouseY = height;
    }
    else if (mouseY < 0) {
        mouseY = 0;
    }

    var r1 = mouseY/6 + 50; // as mouseY increases, radius increases (max radius = 100, min radius = 50)
    var r2 = 100 - mouseY/6; // as mouseY increases, radius decreases (max radius = 100, min radius = 50)
    var change1 = int(d * mouseX) + minInc; // mouseX changes the amount of lines to make the cirlce (max lines = 120, min lines = 4)
    var change2 = maxInc - int(d * mouseX); // mouseX changes the amount of lines to make the cirlce (max lines = 120, min lines = 4)
    
    // draws pink circle
    push();
    translate(width/3, height/2);
    circles(r2, 8, change1, "hotpink");
    pop();

    // draws light green circle
    push();
    translate(2 * width/3, height/2);
    circles(r1, 8, change2, "lightgreen");
    pop();

    // draws yellow circle
    push();
    translate(width/6, height - change1);
    circles(r1, 8, change1, "yellow");
    pop();

    // draws blue circle
    push();
    translate(width - change2, height/6);
    circles(r2, 8, change2, "aqua");
    pop();

} 


function circles(r, k, inc, hue) {
    for (var ag = 0; ag <= 360; ag += inc) {
        angleMode(DEGREES);
        ai = 90 - ag; // 3rd angle in the triangle created from the tangent line and x axis
        cosAg = cos(ag);
        sinAg = sin(ag);
        sinAi = sin(ai);
        scaledR = k * r; // makes the line longer (or shorter)
        midpointX = r * cosAg; // line's midpoint x position
        midpointY = r * sinAg; // line's midpoint y position

        if ((ag === 0) || (ag === 180)) { // verticle lines
            x3 = r * cosAg;
            y3 = -scaledR;
            x4 = r * cosAg;
            y4 = scaledR;
        }

        else if ((ag === 90) || (ag === 270)) { // horizontal lines
            x3 = -scaledR;
            y3 = r * -sinAg;
            x4 = scaledR;
            y4 = r * -sinAg;
        }

        // not a verticle or horizontal line
        // uses geometry, law of sines, and unit circle to get end points of line
        else {
            slope = ((r * -sinAg) / (r * cosAg - (r / sinAi)));
            b = -slope * (r / sinAi);
            x3 = r * cosAg - scaledR;
            y3 = (slope * x3) + b;
            x4 = r * cosAg + scaledR;
            y4 = (slope * x4) + b;
        }

        stroke(hue);
        line(x3, y3, x4, y4);
    }
}

It took a while to get the lines to move around tangential to the circle. There was a lot of math and geometry that I needed a refresher on to get the lines to make a circle. Once the circles were drawn statically, I then used the mouse position to make the circle change in various ways. 

Emma N-M LO-04

TuneTable (2016) 

By: Xambo, A., Drozda, B., Weisling, A., Magerko, B., Huet, M., Gasque, T., and Freeman, J

TuneTable demo in Museum of Design Atlanta 

TuneTable is a project that provides an interactive tabletop application to teach basic computer programming concepts. Users can compose short musical snippets with visual displays by arranging the blocks in different locations to build chains of blocks of code. I admire the fun aspect of creating a learning activity for kids and also how easy it is to make music and visuals without having to think very hard. For the algorithms, I think the blocks placed on the table have special outputs based on where it is placed and also the rotation of it. The creator’s artistic sensibilities comes into play in the musical and visual algorithms created for the blocks that get put down onto the table.

Emma NM-Project-03(Dynamic Drawing)


Emma’s dynamic drawing

I knew I wanted to create a dynamic drawing with circles so I started there and then moved into changing size, position, translation, and rotation based on mouse position. I added one more feature of if you click the screen you can change between circles and squares.

/* 
Emma Nicklas-Morris
Section B
enicklas@andrew.cmu.edu
Dynamic Drawing
*/

var b = 255;
var r = 200;
var cir = true;

function setup() {
    createCanvas(640, 480);
    
    
}

function draw() {
    background("black");
    b = mouseX/3;
    r = mouseY/2;

    // Changes dot color as you move your mouse
    // Red color is controlled by mouseY and Blue is controlled by mouseX position
    fill(r, 50, b);
    noStroke();

    // Dots increase if mouse moves right or up. 
    // Dot position depends on mouse position from the width or height
    if (cir) {
        ellipse(width-mouseX/2, height-mouseY/2, mouseX/2, mouseX/2); 
        ellipse(width-mouseX, height-mouseY, mouseY/2, mouseY/2);
    }
    else {
        rect(width-mouseX/2, height-mouseY/2, mouseX/2, mouseX/2); 
        rect(width-mouseX, height-mouseY, mouseY/2, mouseY/2);
    }
    
    // Create smaller dots to the left and up on the grid. Follows same principles as above
    push();
    translate(-width/3, -height/3);
    if (cir) {
        ellipse(width-mouseX/2, height-mouseY/2, mouseX/3, mouseX/3);
        ellipse(width-mouseX, height-mouseY, mouseY/3, mouseY/3);
    }
    else {
        rect(width-mouseX/2, height-mouseY/2, mouseX/3, mouseX/3);
        rect(width-mouseX, height-mouseY, mouseY/3, mouseY/3);
    }
    pop();

    // Rotates grid based on mouseX position and follows principles above. Dots are smaller than above
    push();
    translate(-width/3, -height/3);
    rotate(radians(mouseX/3));
    if (cir) {
        ellipse(width-mouseX/2, height-mouseY/2, mouseX/4, mouseX/4);
        ellipse(width-mouseX, height-mouseY, mouseY/4, mouseY/4);
    }
    else {
        rect(width-mouseX/2, height-mouseY/2, mouseX/4, mouseX/4);
        rect(width-mouseX, height-mouseY, mouseY/4, mouseY/4);
    }
    pop();

    // Rotates grid based on mouseY position. Follows same principles as above
    push();
    translate(width/3, 0);
    rotate(radians(mouseY/4));
    if (cir) {
        ellipse(width-mouseX/2, height-mouseY/2, mouseX/4, mouseX/4);
        ellipse(width-mouseX, height-mouseY, mouseY/4, mouseY/4);
    }
    else {
        rect(width-mouseX/2, height-mouseY/2, mouseX/4, mouseX/4);
        rect(width-mouseX, height-mouseY, mouseY/4, mouseY/4);
    }
    pop();


}

// By clicking the mouse you switch back and forth between circles and squares
function mousePressed() {
    if (cir == true) {
        cir = false;
    }

    else {
        cir = true;
    }
	
}

Emma N-M LO-03

Digital Stimulation by David McLeod

Piplines by David Leod (2015)

This parametric 3D fabrication project explores generative abstract forms. A digital dynamic stimulation was created to help inform what shapes to sculpt and what material should be used. I found this project to be inspirational because you can get lost in the forms created by the fluid movements. I also enjoyed how the artist used the digital stimulation and created sculptures to represent certain frames of the digital stimulation. There are algorithms used in the digital stimulation and with small tweaks to it, the stimulation can become drastically different. The algorithms were suppose to emulate objects in a turbulent situation. The creator’s artistic sensibilities manifest through interpreting the digital forms created and translating them into something physical (a sculpture). By using the final shapes to inform him on the texture treatment for the sculptures, each one is very different from the others, yet they come from the same place.