![[OLD FALL 2019] 15-104 • Introduction to Computing for Creative Practice](https://courses.ideate.cmu.edu/15-104/f2019/wp-content/uploads/2020/08/stop-banner.png)
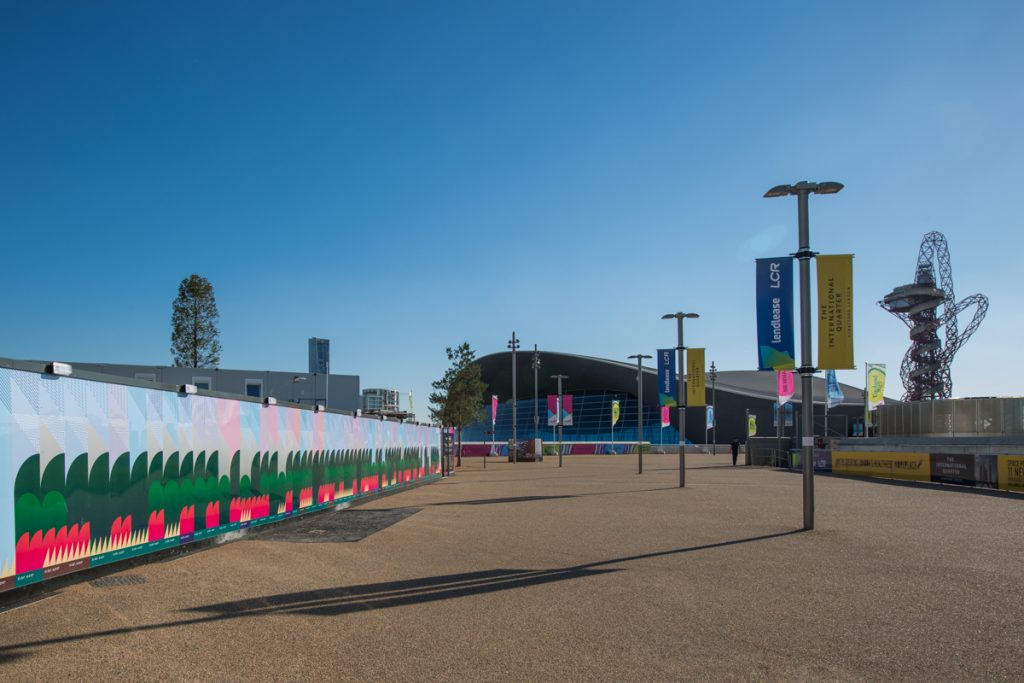
This week, I chose to look at Stefanie Posavec’s art.park.data, a 32.5m long data visualization drawing in Queen Elizabeth Olympic Park, created from data collected by students participating in Space Studios’ “School’s (Not Quite) Out for Summer.” The students, who were from the nearby neighborhoods, and transitioning from elementary to middle school, explored the park with Raspberry Pis fitted with special sensor Hardware Attached on Top (HATs), in order to collect data like the latitude and longitude of their locations, the humidity and temperature, the sounds they heard, the types of plants around them, and even the emotions they felt in that place.
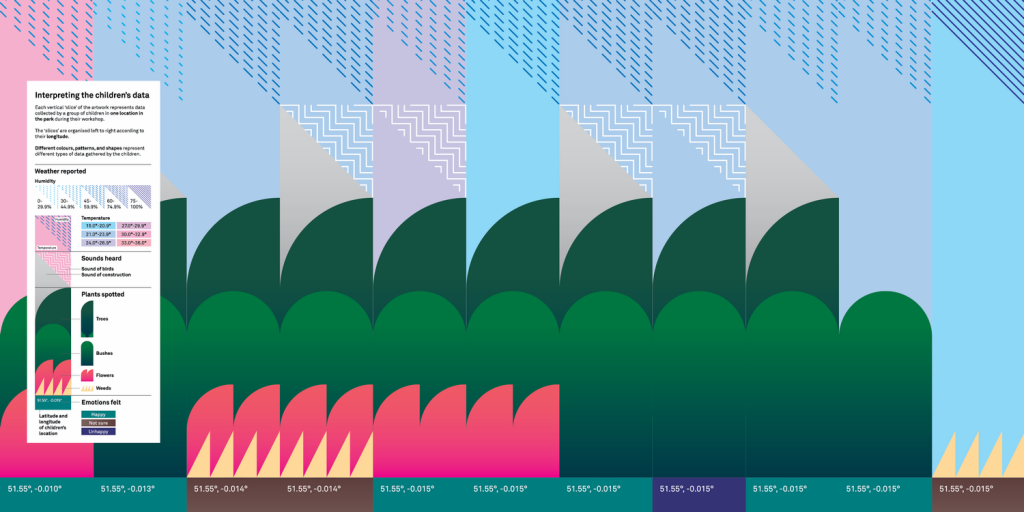
I particularly admire this project, as the students were able to explore the park, make observations, write down notes, and afterwords, use arts and crafts materials to create their own personal visualizations of the data, making this experience more meaningful for the students, and centered solely around them and their perspectives. Although data visualization can sometimes seem impersonal or distant, through Posavec’s use of bright colors, graphic forms, and simple composition, she was able to create a friendly, interesting, and playful snapshot of the park through the eyes of the children who visit it.