![[OLD FALL 2019] 15-104 • Introduction to Computing for Creative Practice](https://courses.ideate.cmu.edu/15-104/f2019/wp-content/uploads/2020/08/stop-banner.png)
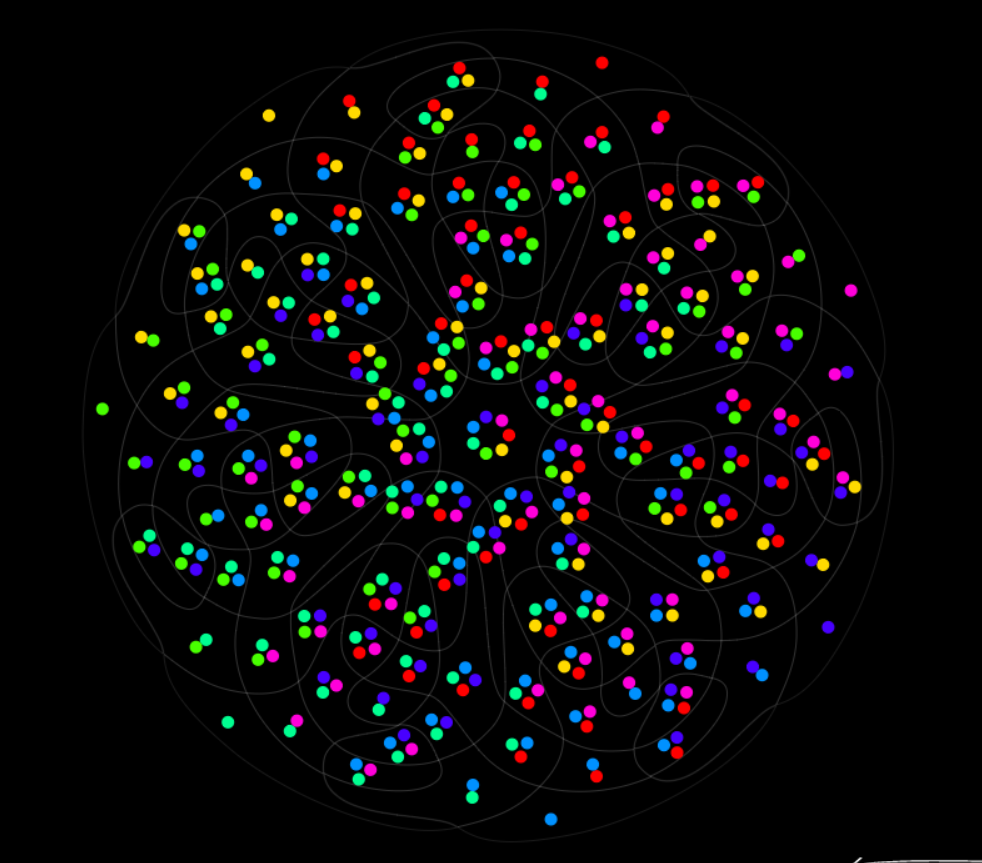
Side A of the Venn Diagram. 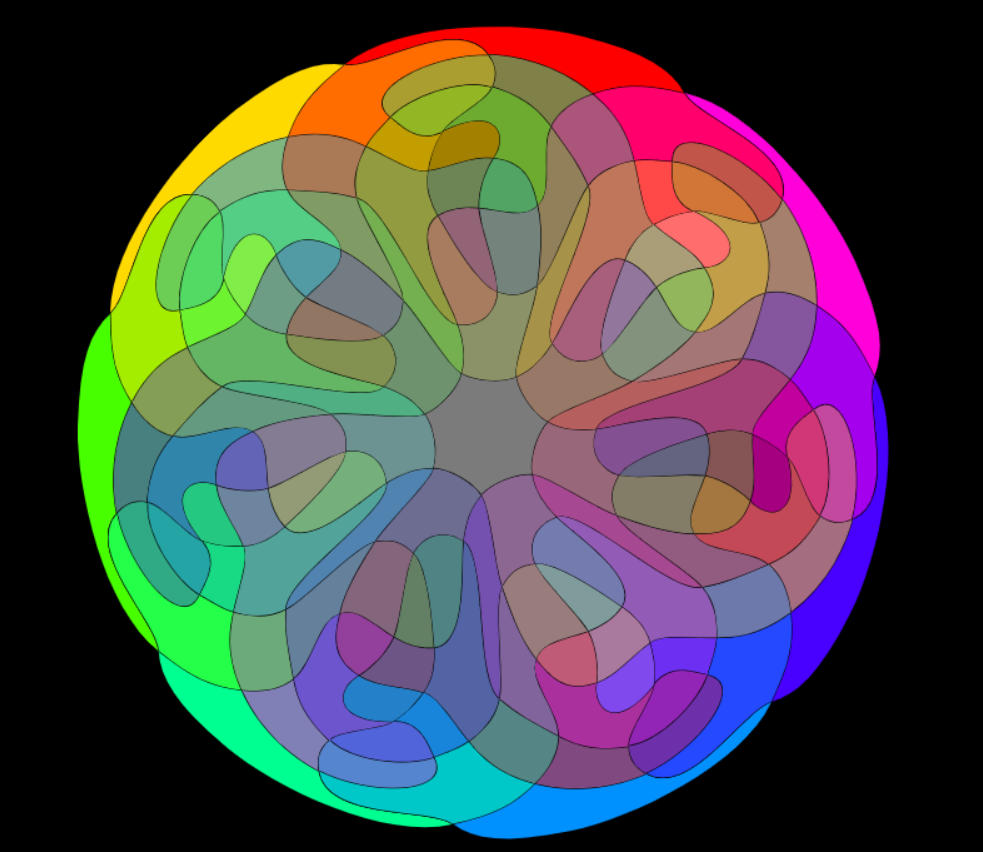
Side B of the Venn Diagram.
7 Sets Venn Diagram is a creative visual by Santiago Ortiz that replicates the color wheel in a way that represents different mixtures of colors. He was inspired by Newton’s theories on light and color spectrum and used the actual colors instead of numbers. Ortiz created the wheel so that on Side A, there are little circles that when you hover your mouse over the names of the colors appear in the bottom. On Side B, the mandala consists more of filled in sections, but similarly has the names of the hues shown after you hover over the color.
Santiago Ortiz is the Head at Moebio Labs which consists of data visualization developers and designers. Ortiz also specializes in interactive information visualization which this project is an example of the type of work he may do in that field.