The Architecture Radio shows the user a visualization of the network traffics of cell phone towers, wifi routers, navigation and observation satellites, and their signals. We currently live in a world where our visual experience is generated through invisible transfers that takes place without us understanding them.
I have no idea how it sees different networks and visualizes them. The only way that I can imagine is having a predetermined location and data about different sources of network signals and just showing them on the display. I wonder if this visualization process happens realtime or not.
This application is available on App Store for iPads and can be downloaded easily and brings to the user’s fingertips an entrance to a world unseen.
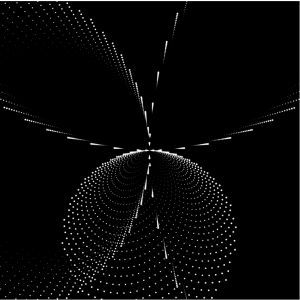
I tried using Vivani spacial curve for this project. I was curious how a 3D function would appear on a 2D surface. It was definitely an interesting exploration, but was also difficult to play with. I wanted to make the visualization look as if the circles are constantly being absorbed into the void, but couldn’t make it happen. Below are some screenshots.
//Danny Cho
//changjuc@andrew.cmu.edu
//Section A
//Composition with Curves


var a = 0;

function setup() {
  createCanvas(480, 480);
  frameRate(10);
}

function draw() {
    background(0)
    translate(width / 2, height / 2)
    fill(255);
    a = mouseX;
    vivani();
    vivani();
    vivani();
    vivani();
}

function vivani() {
    var x = 0;
    var y = 0;
    var move = 1;
    strokeWeight(0);
    rotate(PI / 2);
    for (var i = 0; i < mouseY * 3; i++) {
        x = a * (1 + cos(i * 10));
        y = a * sin(i * 10);
        circle(x, y, i / 500)
        a += 0.1;
    }
}
var x = [0];
var y = [0];
var Xoffset = 0;
var Yoffset = 0;
var col = 255;
var resetclr = 0;
var sc = [0];
var gRate = 0; //gradient speed
var activity = 0;


function setup() {
  createCanvas(480, 480);
  background(0);
  frameRate(30);
  var H = hour();
  var M = minute();
  var S = second();
}

function neuron() {
  col = random(0, 255);

stroke(col, 80)
  beginShape()
  for (i = 0; i < x.length; i++){
    vertex(x[i], y[i]);
  }
  endShape()
  Xoffset = random(-10, 20);
  Yoffset = random(-10, 20);
  x.push(x[x.length-1]+Xoffset);
  y.push(y[y.length-1]+Yoffset);
  if (i % 60 == 0) {
    x[i] = 0;
    y[i] = 0;
    background(0)
    endShape()
    beginShape()
  }
  if (second() % 5 == 0) {
    fill(0, 0, 0, resetclr);
    noStroke();
    rect(-50,-50, width + 50, height + 50);
    x = [0];
    y = [0];
    resetclr ++;
  }

}
//function to determine the breathing rate
function activeness(){
  //fast breathing during the active hours of the day
  if (hour() > 6 & hour() < 23) {
  activity = 2;
}
  //slow breathing due to sleep
  if (hour() < 6 || hour() > 23) {
    activity = 0.3
  }
  //medium speed breathing when waking up and going to bed
  if (hour() == 6 & hour() == 23) {
  activity = 1;
}
}

//changing the gradient to represent breathing
function breathing(){
  var c = map(sin(radians(gRate)), -1, 1, 0, 255);
  for (j = 0; j < 255; j++) {
      stroke(abs(j - abs(sin(radians(gRate))) * 255));

      circle(width / 2, height / 2, j);
      print(c);
    }
}

function draw(){
noFill();
//the
for (rota = 0; rota < 4; rota ++) {
  push()
  translate(width / 2, height / 2);
  rotate(PI / 2 * (rota + 1))
  neuron()
  pop()
}

if (second() % 6 == 0) {resetclr = 0;}
activeness();
breathing();


gRate = gRate + activity;
}
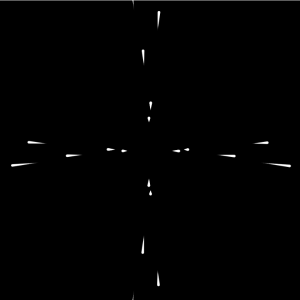
I made a biological clock trying to describe two phenomenons that happen within our bodies constantly: breathing and information exchange between neurons. The gradient circle in the middle represents breathing and the electricity-looking lines represent the signals being transferred between the neurons.
The breathing speed changes depending on the hour of the day. I took into account how a person’s activeness affects their breathing. When the person is asleep, 12am – 5am, breathing is the slowest, medium speed at 6am and 11am, when people state of activeness is transitioning, and fastest from 7am to 10pm, which are the active hours for me.
I really enjoy the simplicity of the contrast in the color and how the overlaying of gradience creates a sense of 3D space. Also, the art is at the subliminal boundary of solid and gas. The tool that was used is Action Script, which is something I never have heard of before. I am willing to look into it see how I might be able to manipulate it.
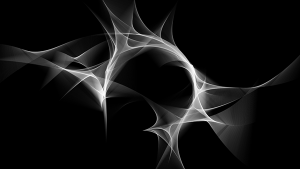
It looks like motion blur of an object’s movement. However, I am curious, if this was drawn over time, which part is the starting point and the ending point. The artist only shows the shot of the final image, so it’s hard for me to imagine the process.
Alexey Kashpersky animated the transaction process different components of our respiratory system. As I was watching this animation, though I knew that this is not a literal representation of how the system works, I was greatly mesmerized. This beautiful abstraction of how our body works allows us to broaden our perspective towards it and remind us the wonders of each of us being some kind of a universe.
I think Alexey Kashpersky did a great job of not visually articulating the system, but also doing it in such way that grabs the viewers and takes them on an immersive tour.
It seems like he used a type of 3D rendering tool such as Cinema 4D, which is a very desirable software that I am really looking forward to learning. It really amazes me how much the software can do.
// Danny Cho
// changjuc
// Section: A
// Project: Wallpaper
var waveHeight = 4/5;
var move = 0;
var speed = 0;
var evenOdd = 0;
var tailSize = 20;
var tailHeight = 20;
var fishSize = 10;
function setup(){
createCanvas(600, 600);
}
//creating waves
function waves(R, G, B, size, y, offset){
fill(R, G, B);
strokeWeight(0);
stroke(255);
//was trying to make the waves move, but not enough time & confusion
for (j = 0; j < (width + 1000) / size; j++){
var cirlceX = j * size * waveHeight + offset;
if (cirlceX > width + 500){
cirlceX = size * waveHeight + offset;
ellipse(cirlceX, y, size, size);
}
else {
ellipse(cirlceX, y, size, size);
}
}
}
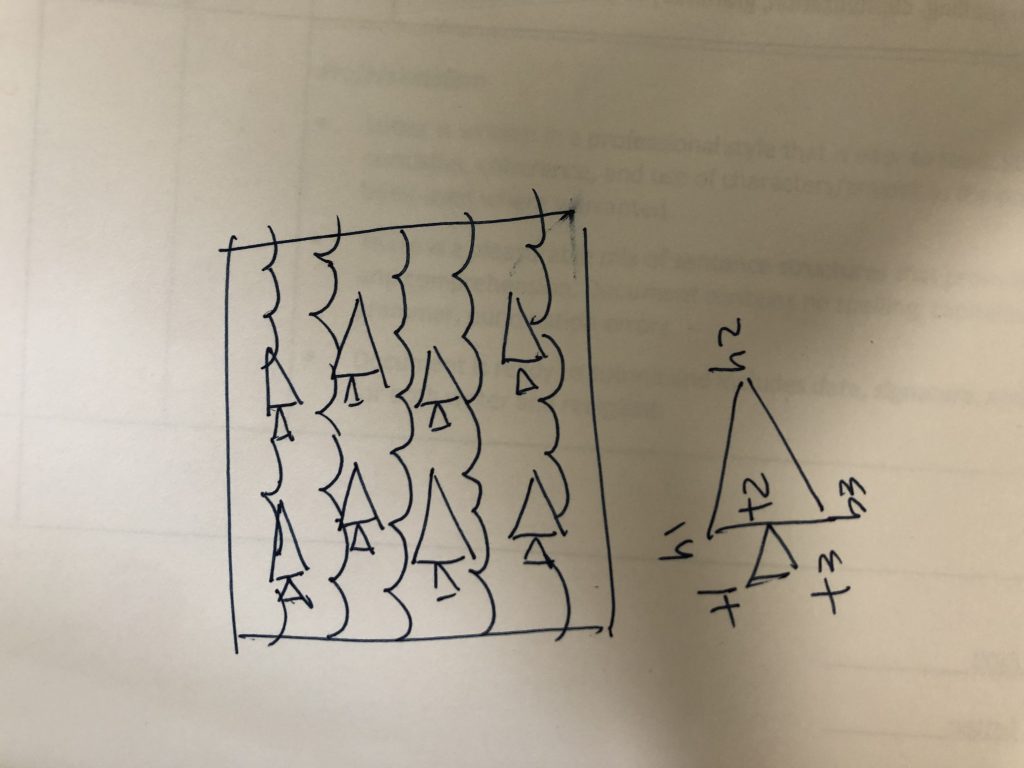
//drawing fish out of two triangles
function fish(a){
fill(231, 239, 233);
var v = height / 200;
var h = width / 200;
//tail
var t1x = a * h * 15;
var t1y = a * v * 15 + 10;
var t2x = a * h * 15 + tailSize;
var t2y = a * v * 15 + tailSize;
var t3x = t1x;
var t3y = a * v * 15 + 2 * tailHeight - 10;
print("t1x is" + t1x);
print("t1y is" + t1y);
//head
triangle(t1x, t1y, t2x, t2y, t3x, t3y);
var h1x = t2x;
var h1y = t2y - fishSize;
var h2x = t2x + 3 * fishSize;
var h2y = t2y;
var h3x = t2x;
var h3y = t2y + fishSize;
triangle(h1x, h1y, h2x, h2y, h3x, h3y);
}
function draw(){
for (i = 0; i <= 16; i++) {
var count = (i % 2);
if (count == 0) {
waves(15, 146, 167, 100, 600 - (40 * i), -50);
//every other waves are different color
}
else if (count == 1) {
waves(20, 188, 199, 100, 600 - (40 * i), 0);
}
}
for (row = 0; row <= 10; row ++){
push()
translate(row * 100 - 500, 0);
for (k = 0; k <= 12; k++){
fish(k);
}
pop()
}
noLoop();
}
I originally wanted to make the waves move and have a ship or fish moving in between them, but I realized the way that I created the waves and how they overlap on top of each other didn’t allow it. So I decided to just overlay fish on top of the waves.
I love how the sound of piano is directly translated in to a warming visual. Personally, when I play piano, I enjoy playing subtle music as jazz or acoustic music, and this kind of visualization of sound matches it really well. At Cooper Hewitt, I encountered this creation and thought it was so beautiful and fun to play with, especially in a bigger scale. It is also available online at https://dotpiano.com with different types of displays.
Each note is assigned a color and a path to move in. The intensity of the sound and the volume determines how bright, fast, saturated the colored circle will be.
I would like to create some kind of collaboration between sound and coding in this course.
// Danny Cho
// changjuc
// Section: A

var rate1 = 0;
var rate2 = 0;
var rate3 = 0;
var rate4 = 0;

function setup() {
  createCanvas(400, 300);

  noStroke();
}


function draw(){
	background(0);
	//living vertex with two moving curves (exploration)
	noFill();
	strokeWeight(1);
	for (var i = 0; i <= 20; i++) {
	noFill();
	strokeWeight(1);
	stroke(100);
	beginShape();
	vertex(0, 30 * cos(radians(rate2)));
	quadraticVertex(20 * i, i * 30 * cos(radians(rate2)), 400, 300);
	quadraticVertex(20, i * 30 * sin(radians(rate2)), 0, 20 * i);
	vertex(400, 0);
	endShape();
	}

	//first curve: waves horizontally at rate1
	for (var i = 0; i <= 20; i++) {
			stroke('green');
		line(20 * i * cos(radians(rate1)), 0, 0, 300 - (20 * i) * sin(radians(rate1)));
	}
	rate1 = rate1 + .6;
	//second curve: waves horizontally at rate2

	for (var i = 0; i <= 20; i++) {
		stroke('blue');
		line(20 * i * sin(radians(rate2)), 0, 0, 300 - (20 * i) * cos(radians(rate2)));
	}
	rate2 = rate2 + 1;
	//third curve: waves in a clockwise direction
	for (var i = 0; i <= 20; i++) {
			stroke('red');
		line(0, 300 - (20 * i) * cos(radians(rate4)), 20 * i * tan(radians(rate4)), 0);
	}
	rate4 = rate4 + .6;
	//fourth curve: waves of changing strokeweight

	for (var i = 0; i <= 40; i++) {
		if (i%2 == 0) {strokeWeight(5);}
		else {strokeWeight(1);

		}
		stroke(200);
		line(400, i * 10 * cos(radians(rate3)), width - (i * 10 * cos(radians(rate3))), 300);
	}
	rate3 = rate3 + 0.8;


}
I wanted to continue to work with constantly changing geometry at an organic rate. The next step might be making a solid form that also morphs in an organic way?
One of the things that I held against computational design was how artificial it looks when tries to describe the natural process. However, this project, “Wanderers”, executes the visualization of the organic movement and growth in a very high quality.
What I am now able to assume, because of what I have learned working on the dynamic drawing project, is that Neri Oxman might have used some kind of trigonometry. In my project, I used sine and cosine, and it resulted in motions that seem relatively organic compared to forcefully created movements. From this experience, I think the natural looking growth of these pieces would also include some trig functions.
I wonder if she used Cinema 4D or any other types of software, and what her inspirations were as she was sketching and ideating these initially.
This is the generation process for the “Wanderer” Project
Neri Oxman’s aesthetics of organic form and colors are displayed through the usage of colors as well as the slow, but steady pace of the video. Especially, the way she presents not just the final images, but the process of them being created also shows her interest as an artist.
var orbitX = 0;
var orbitY = 0;
var speed = 10;
var ellipseX = 0;
var ellipseY = 0;
var width = 640;
var height = 480;
var bgColor = 255;
var strkColor = 0;

function setup() {
  createCanvas(640, 480);
  noStroke();
}


function draw(){
	background(bgColor);
  stroke(strkColor);
  //the lines from top and bottom follow the mouse
  for (var i = 0; i * 10 <= width; i++) {
    line(10 * i, -100, mouseX + orbitX, mouseY + orbitY);
    line(10 * i, 580, mouseX + orbitY, mouseY + orbitX);
    i++;

  }
  //the ellipses follow the mouse
  push();
  translate(mouseX, mouseY);
  ellipse(0, 0, 3 * orbitX, 3 * orbitY);
  ellipse(0, 0, 3 * orbitY, 3 * orbitX);
  pop();

  orbitX = 20 * sin(-speed);
  orbitY = 20 * cos(speed);
  speed = speed + 0.0002 * mouseX;
  push();
  translate(mouseX, mouseY);
  //mouseX controls the number of the ellipses
  for (var i = 0; i + floor(mouseX/60) <= 10; i++) {

  rotate(radians(speed * 10));
  noFill();
  ellipseMode(CENTER);
  //mouseY controls the size of the ellipses
  ellipse(ellipseX + 5 * i, ellipseY + 5 * i, mouseY / 2, mouseY / 2);
  ellipseX = 100 * sin(speed) + mouseX / 10;
  }
  //depending on the mouse position, the color scheme changes
  if (mouseX - mouseY <= 0) {
    bgColor = 0;
    strkColor = 255;
  }
  else {
    bgColor = 255;
    strkColor = 0;
  }

}
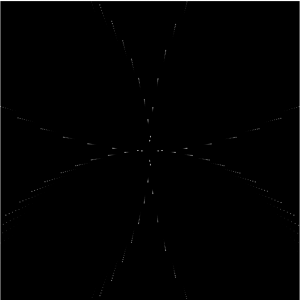
I got interested in radians and trigonometry during this course and wanted to explore it with interactiveness that was a requirement for this project. The position of the mouse controls 4 variables: number of circles orbiting, scale of the circles, speed of their movement, and black and white color scheme.
![[OLD FALL 2019] 15-104 • Introduction to Computing for Creative Practice](https://courses.ideate.cmu.edu/15-104/f2019/wp-content/uploads/2020/08/stop-banner.png)