Jina Lee – Project 07

sketch

//Jina Lee
//jinal2@andrew.cmu.edu
//Section E
//Project 07

var numLines = 30;
var angle = 0;
var angleX;
var circleW;
var r;
var g;
var b;

function setup() {
    createCanvas(480, 480);
}

function draw() {
    background(0);
    //r is a random number between 0 - 255
    r = random(255);
    //g is a random number betwen 0 - 255
    g = random(255);
    //b is a random number between 0 - 255
    b = random(255);
    for(var i = 0; i < numLines; i++){
        noFill();
        push();
        //changing the speed of ellipse
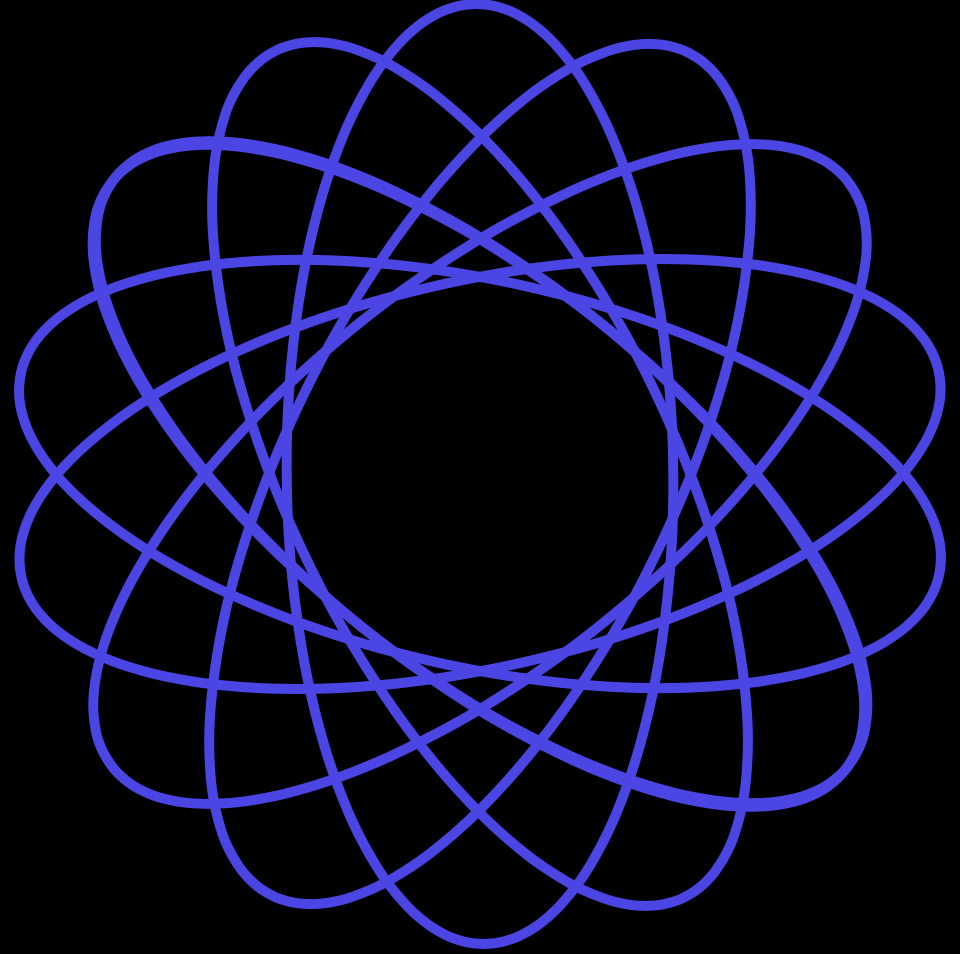
        angleX = map(mouseX, 0, 400, 0, 90);
        //changing the amount of lines drawn
        numLines = map(mouseY, 0, 400, 5, 50);
         //changing the ellipse width
        circleW = map(mouseY, 0, 400, 200, 50);
        //color is random
        stroke(r, g, b);
        strokeWeight(5);
        //move it so it is random
        translate(width / 2, height / 2);
        rotate(radians(angle));
        ellipseMode(CENTER);
        ellipse(0, 0, circleW, 470);
        pop();
        angle += angleX;

    }
}

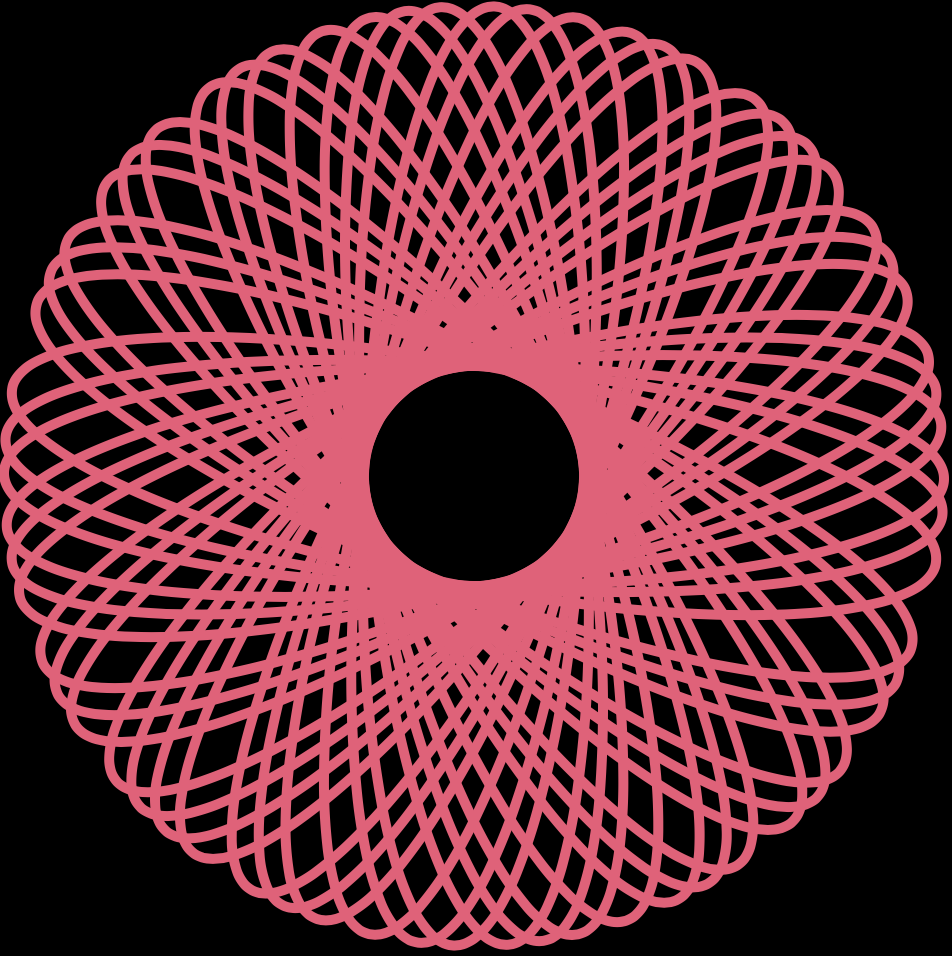
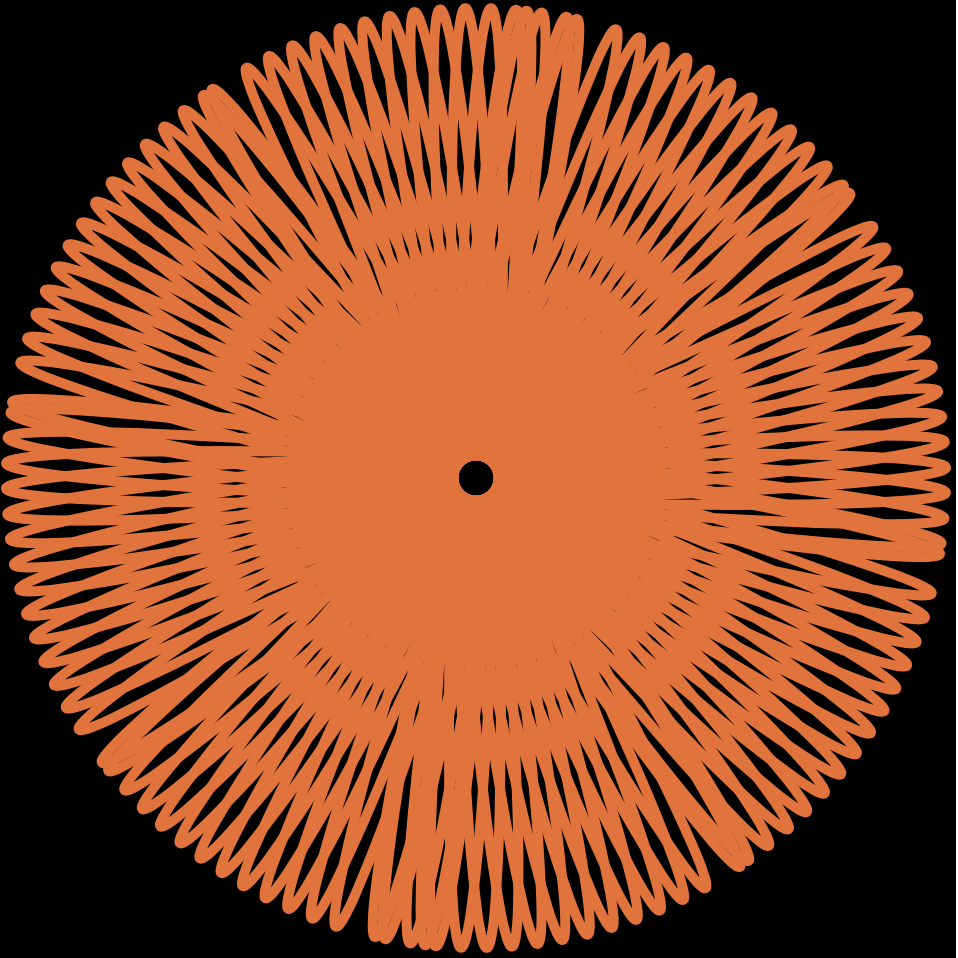
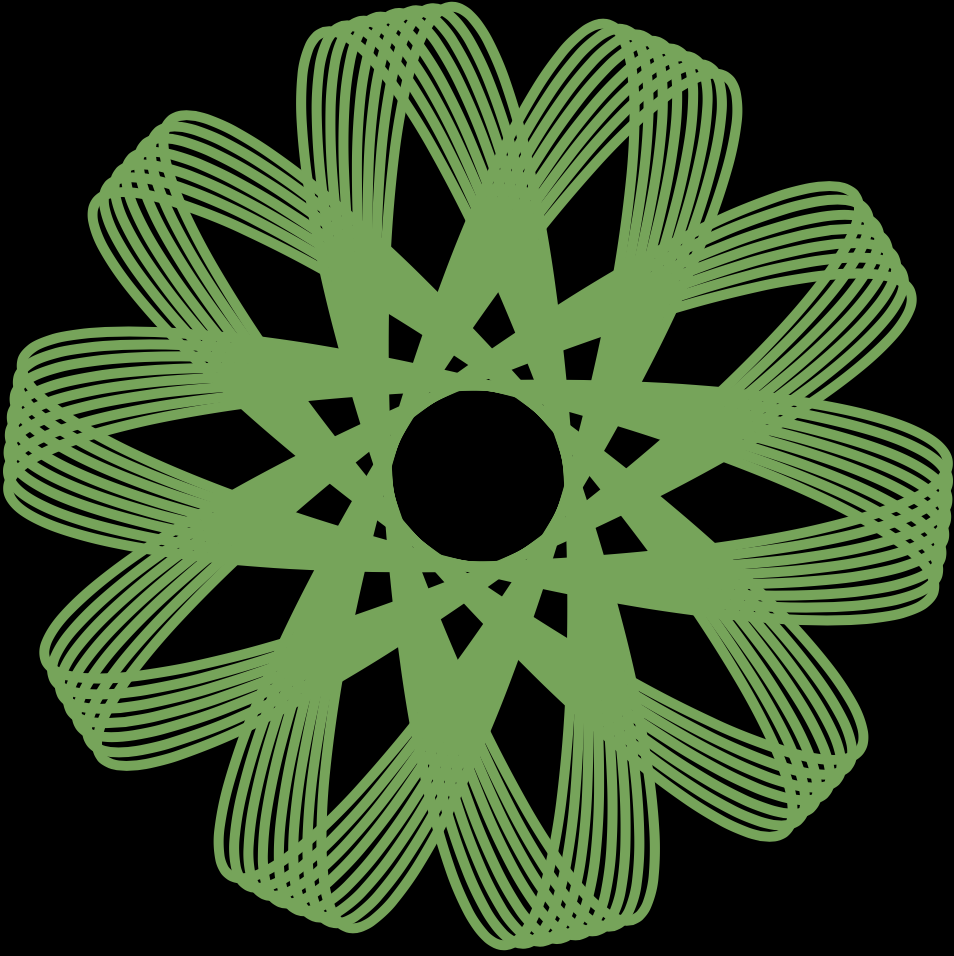
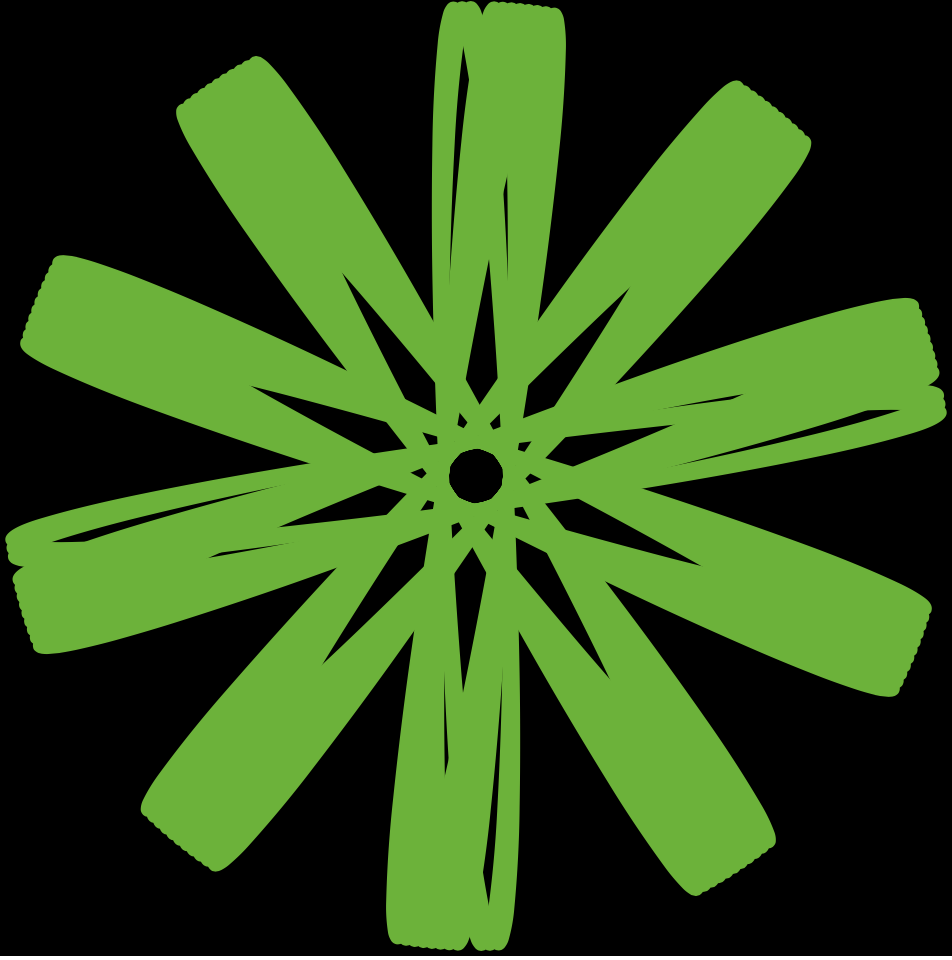
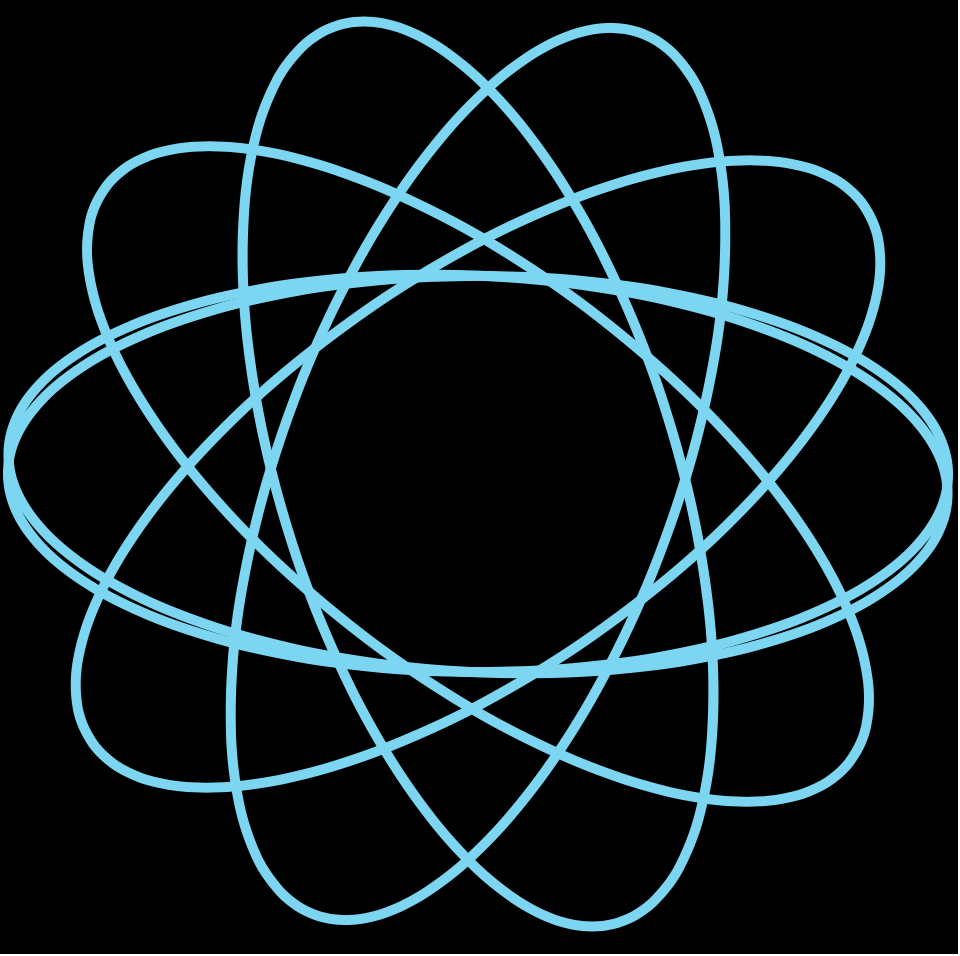
For this project, I was really worried on how to start because the shapes seemed so difficult and complex. As I was working, I realized that it was not as bad as I thought. as long as I defined my variables properly and used a for loop to draw the pattern, it worked. I used the map function to control the to control the speed, number of lines, and width of ellipse.

When the mouse is at the top left corner.
When the mouse is at the center.
When the mouse is at the bottom corner.
When the mouse is at the right side of the canvas.
When the mouse is at the bottom right corner.
When the mouse is at the bottom left corner.
When the mouse is at the top right corner.

Jina Lee – Looking Outwards 07

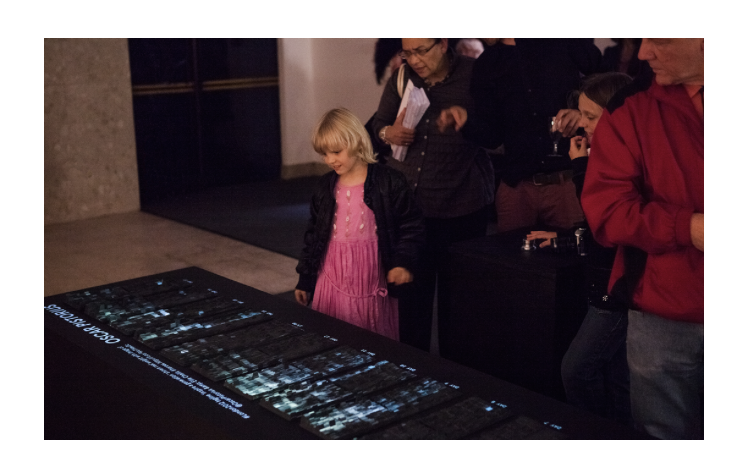
This is the physical installation created by Studio NAND.

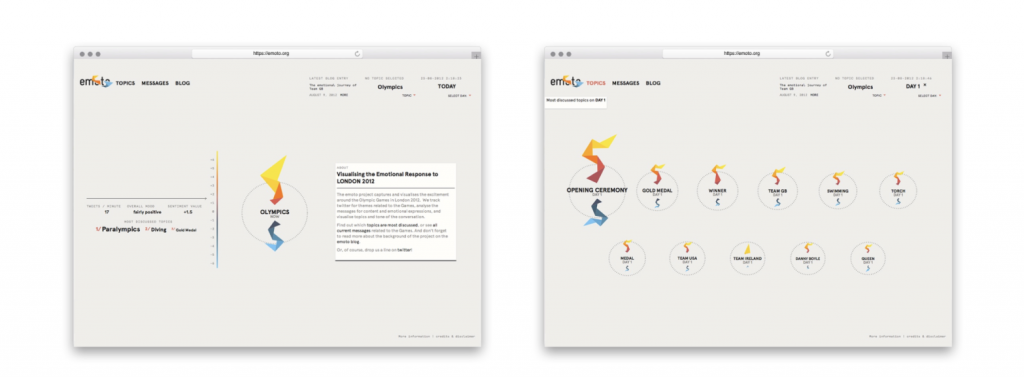
This week, I looked at emoto’s project for the London 2012 Olympics. I thought this design was interesting because it was able to capture and visualize the global response to the 2012 Olympic Games. Studio NAND created emoto. Emoto is a dual part project that is an online visualization and physical installation that showed the responses to the Olympics. This project seems extremely interesting because you are able to see responses from all around the world, allowing you to see new perspectives.

On the left image, it shows the Twitter activity. On the right image, it shows the Topic view, which shows the most discussed topics on the first day of the Games.

For their data, they used millions of tweets that talked about events, players, and teams during the Olympics. The live online component occurred at the same time as the games and translates “real-time global sentiment into custom visualizations.” This platform allowed people to utilize online discussions through tweets which helped calculate the sentiment.

The interactive installation allowed people to scroll through the data that represented the emotional response of the Games.
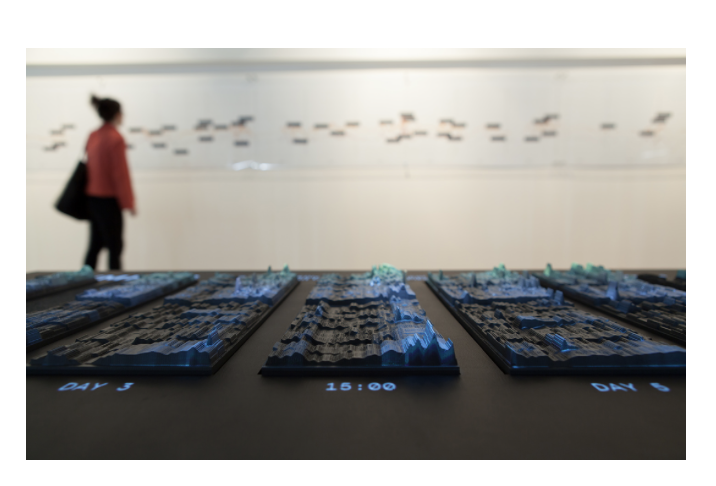
The phys­ical data visualization in combination with a 10 meters long printed timeline.

The physical model had a button to start the experience. Once you press it, it starts the time which helps go through all the tweets that were made during the Olympics. I thought it was interesting because you can see everyones opinion in such a tight space. In addition, they would show the tweet above the physical model. It would project what tweet was made. Visitors could navigate a generative physical sculpture representing all responses over time with over layered information from posted tweet.

https://nand.io/projects/emoto

Jina Lee – Project 06

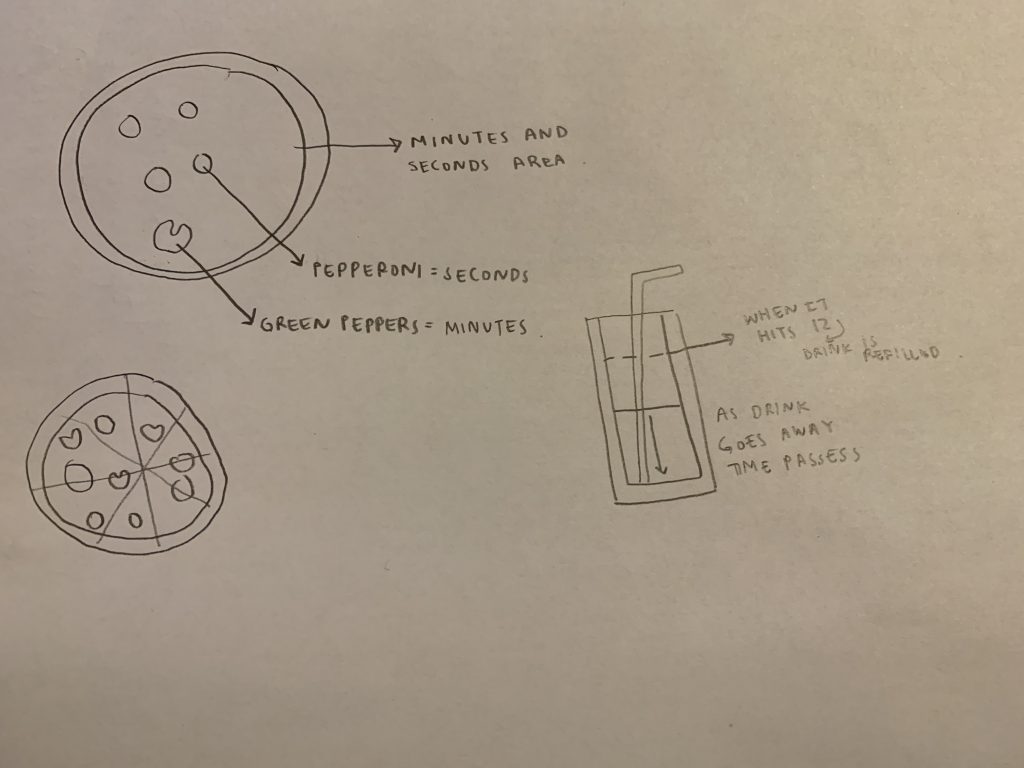
This was my draft about what I wanted my abstract clock to be like.

My clock is of a pizza and soda. At first, I wanted the hours to portrayed by slices, so as the hours go by, a slice of the pizza gets eaten. While doing so, I realized that the seconds and minutes did not have much space when the hours went by. The seconds and minutes were the topics of the pizza. Due to that issue, I changed it so that the minutes and seconds continues to be added on to the pizza, while the hours was a separate object. I created a soda so that the drink can do down as the time gets closer to 12:00. Once it hits 12:00, the drink is refilled. I really enjoyed this project because there was so much you could do with it.

sketch

//Jina Lee
//jinal2@andrew.cmu.edu
//Section E
//Project 06

var h;
var s;
var m;
var g;
var pepperonix = [];
var pepperoniy = [];
var greenPepperx = [];
var greenPeppery = [];

function setup() {
    createCanvas(480, 480);
    background(176, 223, 229);

    //seconds
    //clarifying there are 60 seconds
    for (i = 0; i <= 59; i++) {
        //random location of pepperonix
        pepperonix[i]= random(60, 270);
        //random location of pepperoniy
        pepperoniy[i] = random(70, 250);
    }

    //minutes
    //clarifying there are 60 minutes
    for (g = 0; g <= 59; g++) {
        //random location of pepperonix
        greenPepperx[g]= random(60, 270);
        //random location of pepperoniy
        greenPeppery[g] = random(70, 250);
    }
}

function draw() {
    //the hours are in 12 not 24
    h = hour() % 12;
    s = second();
    m = minute();
    //variable that fits the hours to specific area
    var mapH = map(h, 12, 0, height / 3, 0);

    //light blue
    background(176, 223, 229);

    //crust
    noStroke();
    fill(128, 90, 70);
    ellipse(170, 170, 300, 300);
    fill(174, 141, 103);
    ellipse(170, 170, 260, 260);

    //cheese
    fill(248, 222, 126)
    ellipse(170, 170, 200, 200);
    fill(248, 222, 126)
    ellipse(170, 170, 200, 200);
    ellipse(100, 100, 80, 80);
    ellipse(200, 130, 150, 150);
    ellipse(200, 200, 150, 200);
    ellipse(220, 170, 150, 200);
    ellipse(150, 170, 200, 200);
    ellipse(160, 200, 200, 200);

    //drink
    fill(255);
    rect(340, 260, 100, 200);
    fill(176, 223, 229);
    rect(350, 260, 80, 190);
    fill(63, 32, 6);
    rect(350, 303, 80, 147);

    //straw
    strokeWeight(9);
    stroke(141, 2, 31);
    line(420, 240, 370, 430);
    line(420, 240, 460, 240);

    //hour
    //as the hours go on the drink slowly goes away
    //once the hour hits 12, the drink refills
    fill(176, 223, 229);
	  noStroke();
	  rect(350, 303, 80, mapH);

    //straw
    strokeWeight(9);
    stroke(141, 2, 31);
    line(420, 240, 370, 430);
    line(420, 240, 460, 240);

    //ice cube
    push();
    rotate(PI / 10.0);
    noStroke();
    fill(200);
    rect(500, 250, 20, 20);
    rect(440, 160, 20, 20);
    pop();
    push();
    noStroke();
    rotate(PI / 5);
    fill(200);
    rect(510, 70, 20, 20);
    pop();

    //number of seconds on clock
    //each pepproni is a second
    for (i = 0; i < s; i++) {
        //pepperoni
		    fill(141, 2, 31);
		    ellipse(pepperonix[i], pepperoniy[i], 5, 5);
	  }

    //number of minutes on clock
    //each greenpepper is a minute
    for (g = 0; g < m; g++) {
        //green pepers
		    stroke("green");
        arc(greenPepperx[g], greenPeppery[g], 10, 10, 0, PI + QUARTER_PI);
	  }
}

Jina Lee – Looking Outwards 06

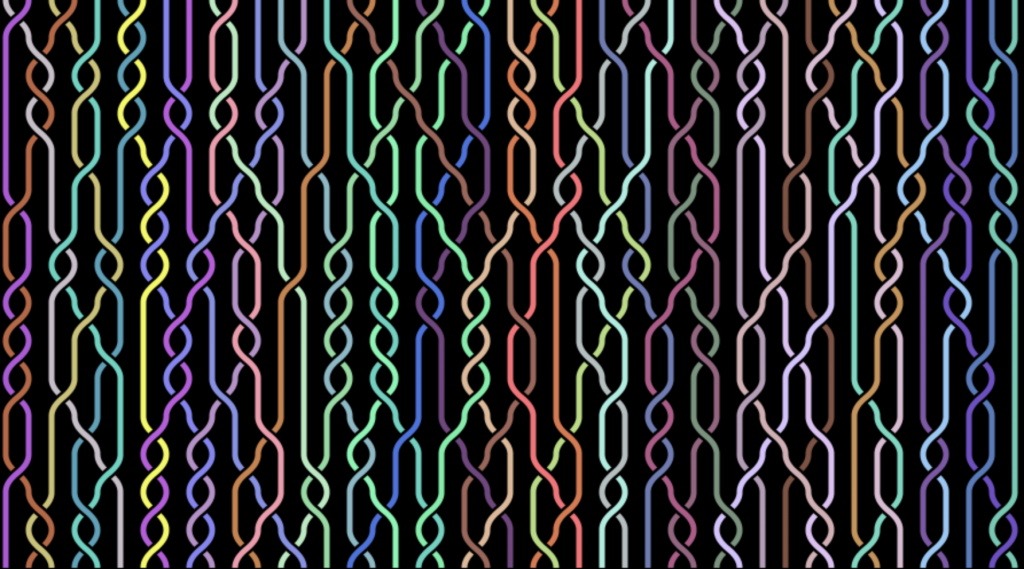
This was the flat braid that the Dan Gries created.

http://rectangleworld.com/blog/archives/733

For this week, I stumbled upon Random Braids. This was created by Dan Gries. I thought this project was interesting because of the process the designer went through to create his work. He has a blog that shows different types of generated artworks. Random Braids stood out the most to me, because when you think about braids, they are very systematic. By generating random braids, it is interesting to see how they intertwine with each other.

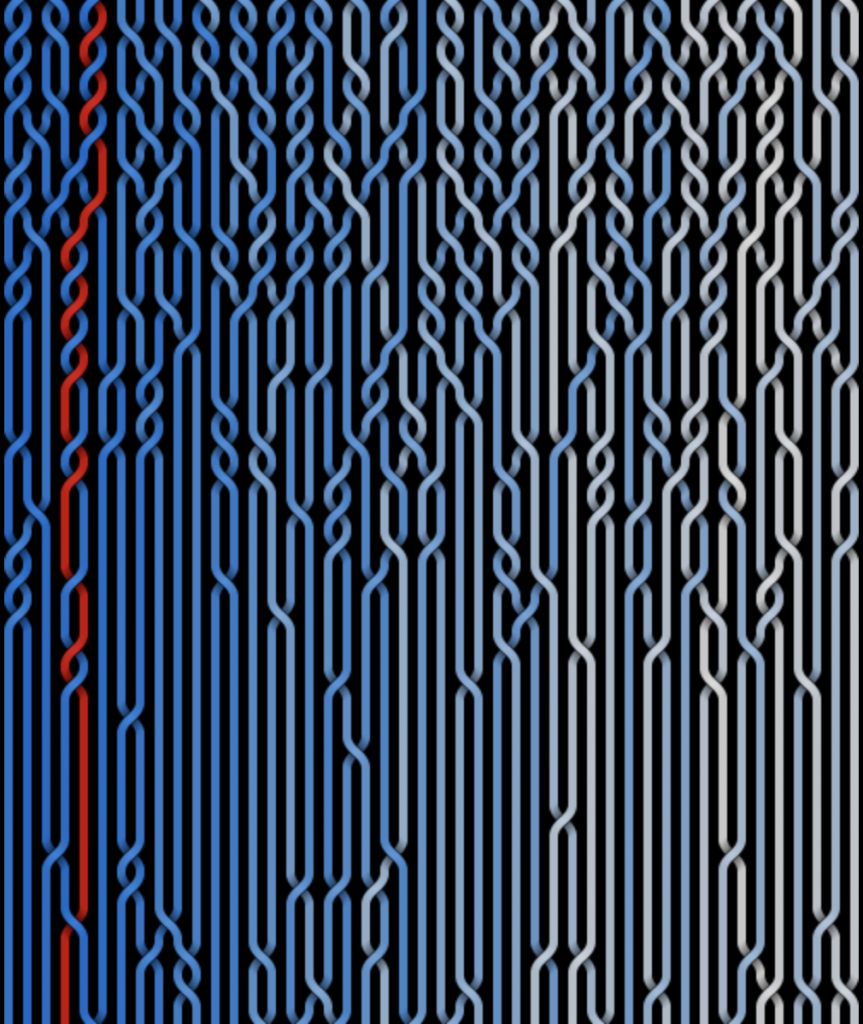
This is the Blue Scrolling. It is animated and scrolls endlessly.
http://rectangleworld.com/demos/Braids/braids_blue_scroll.html

In order to create this design, he used JavaScript and HTML5 canvas. There are two versions of fixed images of the braids and two versions of the braids scrolling endlessly. Before getting to his final iterations, he did a lot of research. The braids show the intersection of the mathematical areas of abstract algebra, topology, and knot theory. The braids were made by a set of simple braids which have a single crossing of strings. If the top braid is attached to its inverse, the strings can become untangled. 

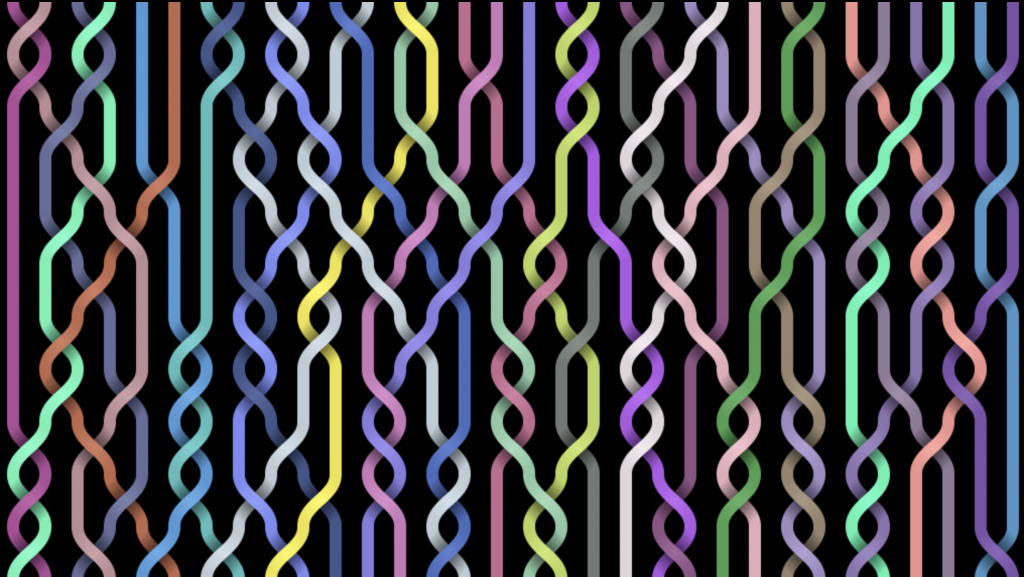
This is called gradient. Gries made non moving gradient braids and scrolling gradient braids.
http://rectangleworld.com/demos/Braids/braids_scroll.html

What I admire about the work is how simple yet aesthetically pleasing the end product ended up being. My understanding of randomness in algorithms is mostly limited to what I have been learning in p5.js. In order for Gries to code this, he had to draw the strings row by row. He would randomly select positive or negative crossings. Through the arrays, the colors were chosen. More information about how the algorithm work can be found on his blog post about random braids.

Jina Lee – Looking Outwards 05


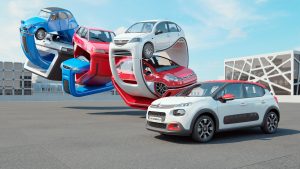
This video is about Chris Labrooy’s project “Automobile Citroen.”

This is what he created for Citroen.

For this week, I stumbled upon Chris Labrooy. He graduated from the RCA with a MA in design products. Labrooy first started to use 3D as a simple tool to visualize ideas for furniture and products. As time passed, 3D technology and software evolved drastically, allowing Labrooy to explore CGI. He is based in Scotland. You can also see his work in UK, Europe, and the U.S.

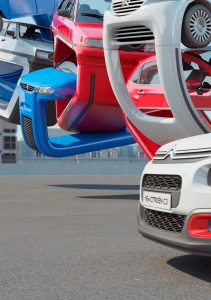
This is a close up of his design.

Citroen asked him to create a 3D sculpture that explored the genealogy of the new Citroen C3 car. The cars featured in his design include the 2CV, Visa, AX, Saxo, C3 gen 1, C3 gen 2 and the new Citroen C3. In order to create this, he used Cinema 4D. For his rendering, he used V-Ray.

I thought his work was extremely interesting, because you usually do not see cars being ringed together. In addition, he did not change the cars completely. He keep all the elements of the cars. Though he distorted the cars, he was able to maintain key elements that the cars have. For example, if you look at the photo below, the white car has an opening at the front of its car, while the blue car next to it, has a long vent.

In order to create this, I belie that Labrooy had to make multiple layers. I feel like he had a separate file for the background so that it is easier to render. And then, he made the front undistorted car by itself. The other cars that are intertwined with each other are all rendered in a file together.  I am unsure how he was able to create such a complex yet extremely detailed work. When I zoom into the work, I am always surprised at how detailed the overall piece is.

This photo is a close up of the cars, which gives viewers a better idea of how he was able to keep the elements of the car while distorting them.

Jina Lee – Project 05


sketch

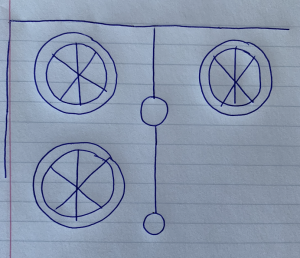
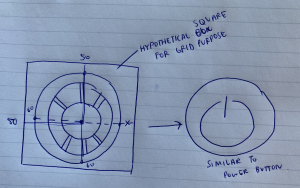
When I first started this project, I was thinking about fruits, particularly oranges. So I created a design that had half oranges everywhere. While doing so, I played around with the color and other ellipses and tried something else.

This was the sketch idea I had for my first iteration.

This was my first iteration with half oranges. On the lines are full oranges.

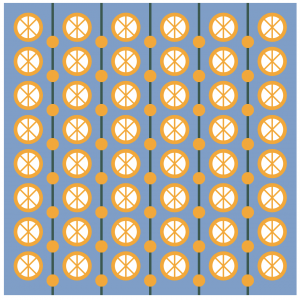
In the end, I added on to the old design by making it seem more similar to  power buttons. In addition, the colors that I chose gives a tropical feeling that I was looking for. 

Here is my process to getting to my final.


//Jina Lee
//Section E
//jinal2@andrew.cmu.edu
//Project-05

var x;
//random colors
var r;
var g;
var b;

function setup() {
    createCanvas(600,600);
    //light blue
    background(119, 158, 203);
}

function draw () {
    //dark green line inbetween the circles
    for (x = 0; x < 5; x ++) {
        stroke(30, 70, 45, 200);
        strokeWeight(5);
        line((x * 100) + 100, 0, (x * 100) + 100, height);
    }

    //vertical forloop for y
    for (var y = 50; y <= height; y += 70) {
        //horizantal forloop for x
        for (var x = 50; x <= width; x += 100) {
            //call drawMain shape which are the circles
            drawMain (x,y);
        }
    }
    noLoop();
}

// cirlces, x y variable coordinates to be called in for loop
function drawMain ( x, y) {
    //r is a random number between 0 - 255
    r = random(255);
    //g is a random number betwen 100 - 200
    g = random(100,200);
    //b is a random number between 0 - 100
    b = random(100);
    //main circles
    noStroke();
    fill(r, g, b);
    ellipse(x, y, 60, 60);
    fill(255);
    ellipse(x, y, 45, 45);
    strokeWeight(3);
    stroke(r, g, b);
    line(x, y - 25, x, y + 25);
    line(x - 20, y - 20, x + 20, y + 20);
    line(x - 20, y + 20, x + 20, y - 20);
    //circles inside the bigger one
    noStroke();
    fill(r, g, b);
    ellipse(x, y, 30, 30);
    //dots on the line
    for (var x = 50; x <= 500; x += 100) {
        noStroke();
        fill(r, g, b);
        ellipse(x + 50, y + 30, 25, 25);
    }
}

Jina Lee – Project 04


For this project, I played around with curves. I wanted to give a disco/chaotic vibe. When move your mouse around the canvas, the lines move making it seem more busy. I enjoyed this project because there were so many ways I could make my strings move. In the future, I want to add more curves to make it seem like a camera lens opening and closing with the string curve. This assignment helped me better understand how loops work and how I can manipulate curves with mouseX and mouseY.

sketch

//Jina Lee
//Section E
//jinal2@andrew.cmu.edu
//Project-04

function setup() {
    createCanvas(300, 400);
}

function draw() {
    //background is random
    red = random(255);
    green = random(255);
    blue = random(255);
    background(red, green, blue, 40);

    //lines that just go up and down
    //as the mouse goes right the lines appear
    for (var i = 0; i <= mouseX; i += 50) {
        stroke(255);
      	strokeWeight(1);
      	line(i, 0, i, height + i);
    }
	  //top left corner and bottom right
    //it curves down
	  for (var a = 0; a < mouseX; a += 20) {
	      stroke(255);
		    strokeWeight(1);
		    line(a, 0, width, a);
	  }
    //top right and left bottom
	  for (var b = 0; b < mouseY; b += 5) {
		    stroke(255);
		    strokeWeight(1);
		    line(width + b, b, width - b, height);
    }
	  //left top and bottom right
	  for (var c = 0; c < mouseX; c += 20) {
		    stroke(255);
		    strokeWeight(1);
		    line(width - c, height, 0, height - c);
    }
	  //left bottom and top right
	  for (var d = 0; d < mouseY; d += 5) {
		    stroke(255);
		    strokeWeight(1);
		    line(0, height - d, d, 0);
    }
}

Jina Lee – Looking Outwards – 04


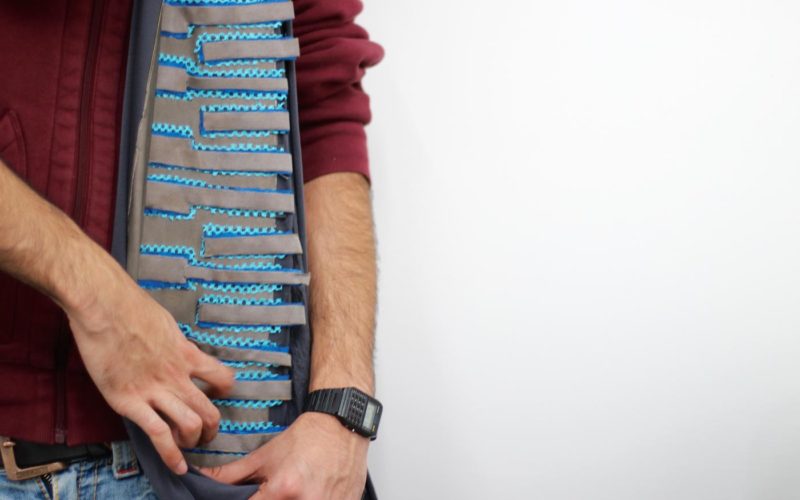
This video helps showcase the fabric keyboard. 


One project that I thought was extremely interesting is “FabricKeyboard.” I believe that it is a good example of a design that works with both sound and coding. In addition, there is a twist because this design is made out of stretchable fabric that works as a musical instrument. This device was created by the Responsive Environments Team at the MIT Media Lab.

I thought it was a fun and cool device as it is able to use stretchable fabric “sensate media” as an instrument. They were able to create this device by using textile sensors, stretchable fabrics and digital music instruments.

This is a person exampling how to use this computational fabric instrument.

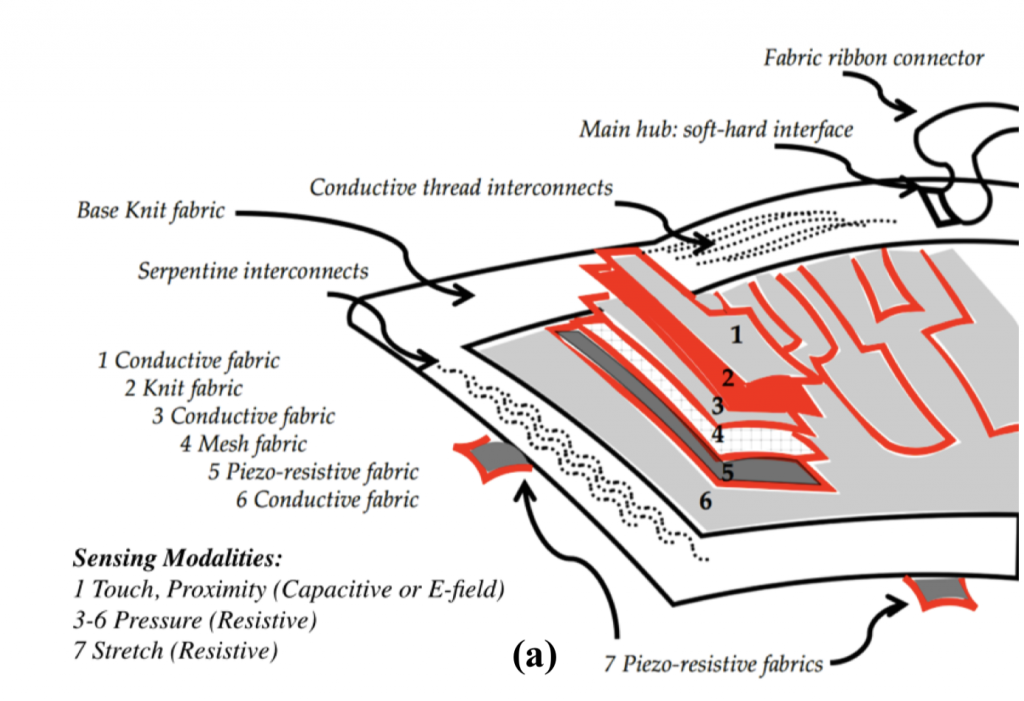
In order to create this design, the team had to research textile sensors and integrations of system-on-textile to better understand how to compute sound with it. To make the fabric give off an instrument vibe, they sewed multi-layer fabric sensors in a keyboard pattern. The fabrics used were knit fabrics, conductive fabrics, piezo-resistive fabrics. All the fabrics were sewn with conductive thread. The design uses MIDI and OSC. MIDI was used to plug in to audio workstations while OSC allows for wireless.

This is a diagram of the layers of fabric that is used for this interactive instrument.

I thought that this project was interesting because you are able to manipulate your feeling sense and hearing sense with fabric. I believe that it was a good idea to reference a key board, because pianos are extremely well known. If they used a different design that is not similar to an actual instrument that most people know, it will be harder for the user to understand how to use because they have never seen anything like that. In addition, this product can be used by young children to start learning about instruments, because it seems like every year, the number of children being able to play an instrument depletes every year.

I am unsure of how the product was algorithmically created. But, I think that they used certain hardwares which connect to a computer. Once someone pressed or stretches the fabric, it sends a message to the computer which allows the code to function by making a sound when it is triggered.

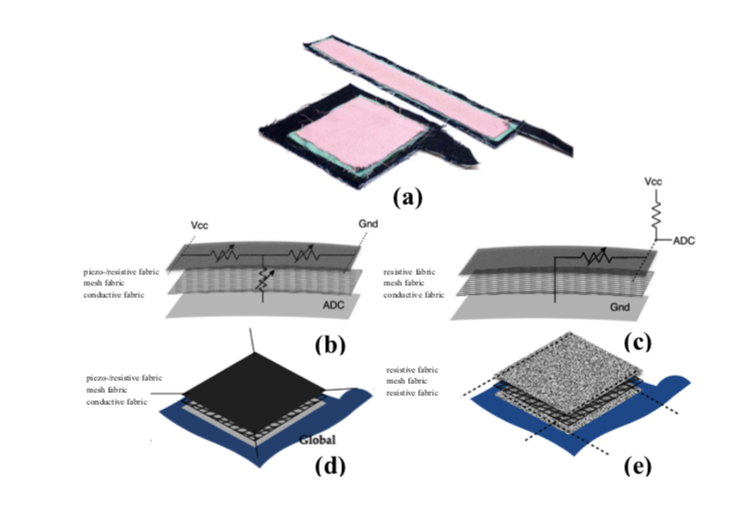
This is another diagram that shows the fabric trackpad and ribbon-controller.

Overall, I think this project is extremely complicated and cool and would like to be able to better understand how it was produced once I have a better understanding of how to code. I think that if I truly understand how this project works, I would need to research different types of fabric and how they work with hardware.

https://www.creativeapplications.net/objects/fabrickeyboard-stretchable-fabric-sensate-media-as-a-musical-instrument/

Jina Lee – Project-03


For this assignment, I used a fish for my main theme. As the fish food gets closer to the bowl, the view zooms in. Also, the fish rotates  when the fish food gets closer to the bowl. The box tilts towards the fish bowl as soon as it hits the top of the fish bowl. In addition, as the mouse moves down, the background changes from dark to light. It took me a long time to understand how to use the if statements properly. I enjoyed this project. In the future, I want to be able have the fish bowl get bigger as the mouse moves. 

sketch

//Jina Lee
//Section E
//jinal2@andrew.cmu.edu
//Project-03

// variables
var fishX = 50;
var fishY = 20;
var fbX = 60;
var fbY = 90;
// background color
var rColor = 70;
var gColor = 70;
var bColor = 130;

function setup() {
    createCanvas(480, 640);
}

function draw() {
    // background changes color as mouse moves up and down
    var rColor1 = min(mouseY + rColor, 244);
    var gColor1 = min(mouseY + gColor, 244);
    var bColor1 = min(mouseY + bColor, 150);
    // by manipulating rColor, gColor, and bColor based on mouseY position
    // background is random
    background(rColor1, gColor1, bColor1);

    // fishbowl
    noStroke();
    fill(131, 172, 219);
    // once the mouse is past 150 on y axis - the fish bowl gets bigger
    if (mouseY >= 200){
        ellipse(fbX * 4, fbY * 5, 450, 450);
        rect(fbX / 2, fbY * 2, fbX * 7, fbY + 50, 20);
    }
    // fishbowl when it is not past 150 on y axis
    ellipse(fbX * 4, fbY * 5, 350, 350);
    rect(fbX + 5, fbY * 3, fbX * 5.8, fbY + 10, 20);

    // goldfish body
    noStroke();
    fill(214, 135, 53);
    // what happens when mouse goes past 200 on y axis
    if (mouseY >= 200) {
        // movement of goldfish when mouse is past 200 on y axis
        push();
        // the fish gets bigger to seem like zooming in
        scale(1.2);
        // the fish starts moving away from the mouse
        rotate(radians(mouseY / 70));
        // goldfish body
        ellipse(fishX * 2.2, fishY * 15, 30, 15);
        ellipse(fishX * 3, fishY * 15, fishX * 1.5, fishX * 1.5);
        triangle(fishX * 3, fishY * 15, fishX * 3.5, fishY * 18, fishX * 2,
                 fishY * 18);
        // goldfish face
        noStroke();
        fill(94, 94, 94);
        ellipse(fishX * 3, fishY * 14, 10, 10);
        // goldfish scales
        noFill();
        stroke(94, 94, 94);
        strokeWeight(2);
        arc(fishX * 2.84, 315, 15, 15, PI, PI / 3);
        arc(fishX * 3.15, 320, 15, 15, PI, PI / 3);
        arc(fishX * 3.06, 306.2, 15, 15, PI, PI / 2);
        pop();
    }

    // what happens when mouse stays between 199 on y axis
    if (mouseY <= 199) {
        // goldfish stays still when mouse go stays between 199 on y axis
        noStroke();
        //goldfish body
        ellipse(fishX * 2.2, fishY * 20, 30, 15);
        ellipse(fishX * 3, fishY * 20, fishX * 1.5, fishX * 1.5);
        triangle(fishX * 3, fishY * 20, fishX * 3.5, fishY * 23, fishX * 2, fishY * 23);
        // goldfish face
        noStroke();
        fill(94, 94, 94);
        ellipse(fishX * 3, fishY * 19, 10, 10);
        // goldfish scales
        noFill();
        stroke(94, 94, 94);
        strokeWeight(2);
        arc(fishX * 2.82, 414, 15, 15, PI, PI / 3);
        arc(fishX * 3.1, 410, 15, 15, PI, PI / 3);
        arc(fishX * 3.07, 421, 15, 15, PI, PI / 2);
        pop();
    }

    // fishfood box
    //the fishfood box position is slightly slanted
    translate(mouseX - 70, mouseY - 150);
    rotate(-50, -50, 55, 55);
    // when the mouse goes past 200 on y axis - fishfood tilts the opposite way
    if (mouseY >= 200) {
        rotate(-26, -26, 0, 0);
        translate(5, 0);
        // fishfood pebbles show after mouse goes past 200 on y axis
        fill(94, 77, 54);
        ellipse(fbX / 2, fbY / 1.5, 20, 20);
        ellipse(fbX / 1.8, fbY, 20, 20);
        ellipse(fbX / 9, fbY, 20, 20);
    }

    // box
    noStroke();
    fill(176, 56, 55);
    rect(50, 40, 125, 200, 10, 10, 10, 10);
    // logo
    fill(94, 94, 94);
    rect(fbX, fbY + 10, 100, 30);
    rect(fbX, 140, fbX + 40, 90);
    fill(214, 135, 53);
    ellipse(fbX + 50, 180, 40, 40);
    triangle(fbX * 2, 190, 110, 210, 140, 200);
}
Jina Lee – Looking Outwards 03

https://n-e-r-v-o-u-s.com/projects/albums/hyphae/

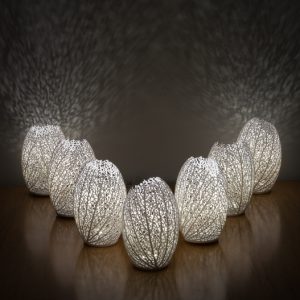
As I was looking up computational fabrication, I stumbled upon the Hyphae Lamp. The co-founders are Jess Louise-Rosenberg and Jessica Rosenkrantz. In the science world, hyphae performs a variety of functions in fungi. In this context, Hyphae is a series of 3D-printed lamps that were inspired by the “vein structures that carry fluids through organisms from the leaves of plants to our own circulatory systems.” They were able to build it by looking at the stages of leaves, starting from when they were seeds to when they were fully grown. Each lamp is unique because it is completely one of a kind. They are 3D-printed in nylon plastic. They are run by eco-friendly LEDS.

This is a photo of lights.

As I was looking up computational fabrication, I stumbled upon the Hyphae Lamp. In the science world, hyphae performs a variety of functions in fungi. In this context, Hyphae is a series of 3D-printed lamps that were inspired by the “vein structures that carry fluids through organisms from the leaves of plants to our own circulatory systems.” They were able to build it by looking at the stages of leaves, starting from when they were seeds to when they were fully grown. Each lamp is unique because it is completely one of a kind. They are 3D-printed in nylon plastic. They are run by eco-friendly LEDS. It was made with c++ using CGAL.

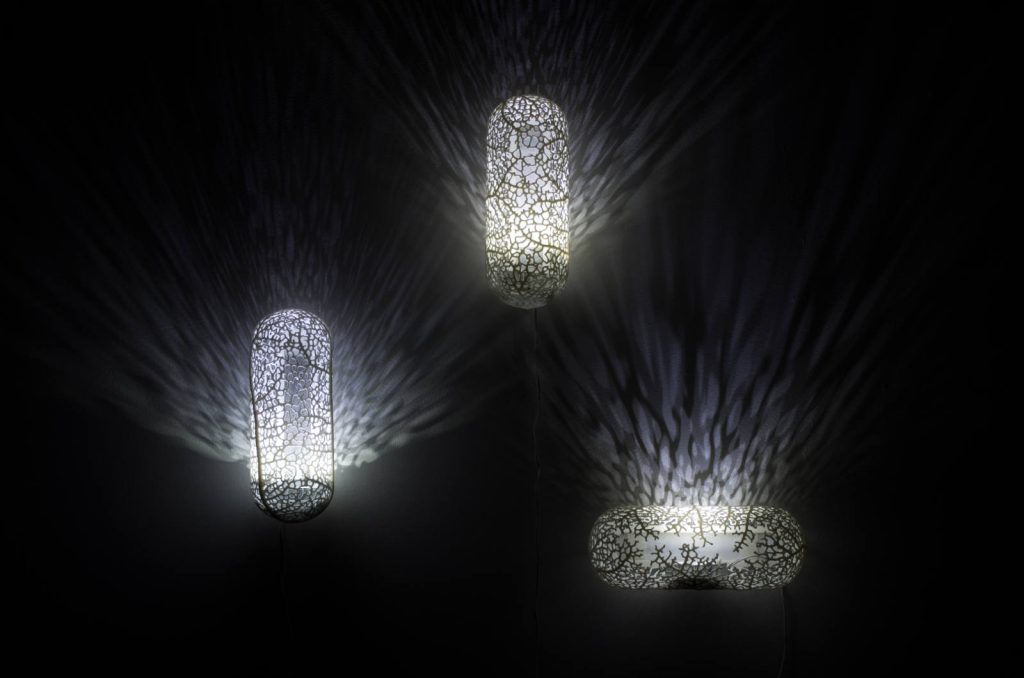
The lamps do not all posses the same shape. Some are chandeliers while others are just wall lights or lamps.

I thought that this project was interesting because I usually don’t see designs being influenced by science. I felt more connected to this project since last semester, in design, we created lamps out of paper. Being able to see the designer’s process and inspiration allowed me to better understand the purpose of the idea.  In the video, you are able to see the process of the lamp being built and it made me feel like I was watching the actual process of a leaf growing its veins. I enjoyed how the lamps do not posses the same body shape. Some are more circular while others are more natural and not a certain shape. There were even jewelry that followed the same algorithm and material. Overall, I really enjoyed researching this project because it is not just an aesthetic design. It educates people on hyphae while also acting as a lamp.

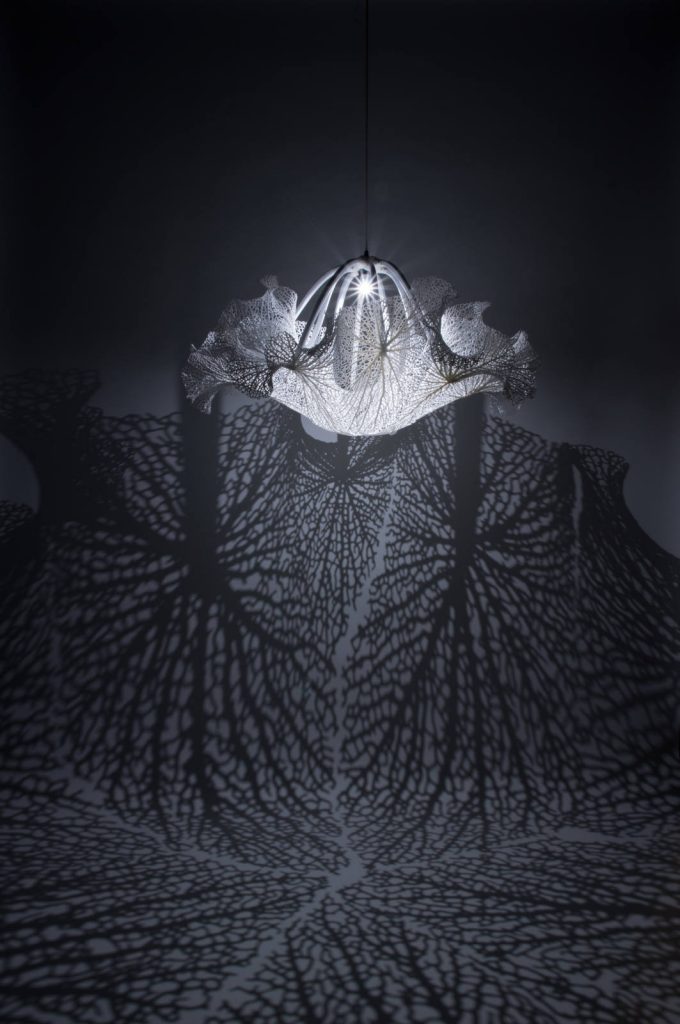
This lamp is the chandelier.
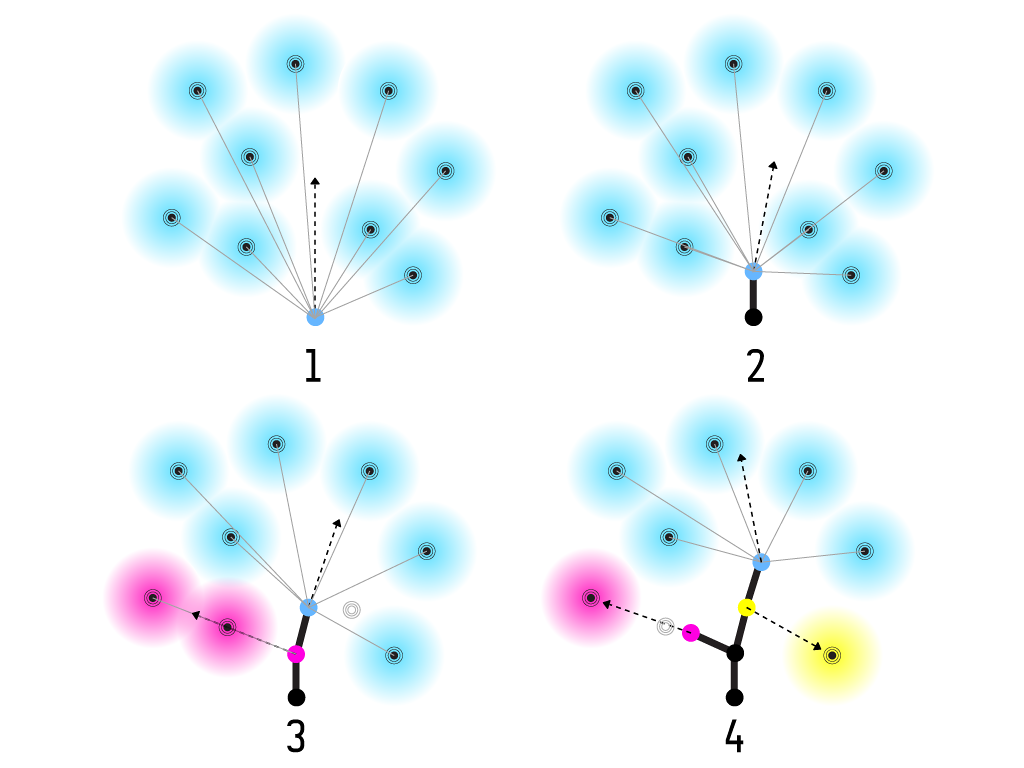
This is the algorithm diagram used to produce the lamps.