Lanna Lang – Project 07 – Curves

sketch

//Lanna Lang
//Section D
//lannal@andrew.cmu.edu
//Project 07 - Curves

var nPoints = 100;
var angle = 0;

function setup() {
    createCanvas(480, 480);
}

function draw() {
    background('#ffc5a1'); //pastel orange
    
    //call, translate, and rotate
    //the epitrochoid curve
    push();
    translate(width/2, height/2);
    rotate(radians(angle));
    drawEpitrochoid();
    angle += 10;
    pop();
    
    //call and translate the hypotrochoid curve
    push();
    translate(width/2, height/2);
    drawHypotrochoid();
    pop();
}

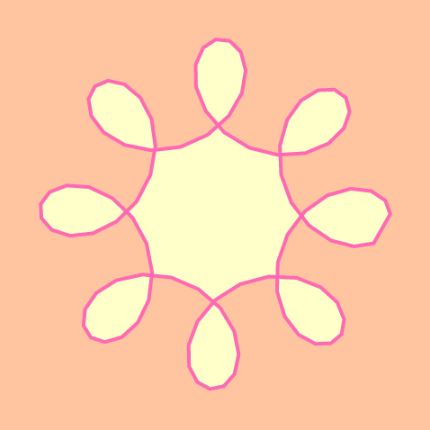
//Epitrochoid curve (biggest curve)
function drawEpitrochoid() {
    //http://mathworld.wolfram.com/Epitrochoid.html
    
    var x1;
    var y1;
    
    //scale and rotation based on mouseY and mouseX
    var a1 = map(mouseY, 0, 480, 10, 70);
    var b1 = 20;
    var h1 = mouseX;
    
    strokeWeight(4);
    stroke('lightyellow');
    fill(mouseX, 150, mouseY); //fill based on the mouse
    beginShape();
    for (var i = 0; i < nPoints; i++) {
        var t1 = map(i, 0, nPoints, 0, TWO_PI);
        //epitrochoid equation
        x1 = (a1 + b1) * cos(t1) - (h1 * cos((a1 + b1 / b1) * t1));
        y1 = (a1 + b1) * sin(t1) - (h1 * sin((a1 + b1 / b1) * t1));
        vertex(x1, y1);
    }
    endShape(CLOSE);
}

//Hypotrochoid curve
function drawHypotrochoid() {
    //http://mathworld.wolfram.com/Hypotrochoid.html
    
    //rainbow filled hypotrochoid
    var x2;
    var y2;
    
    //scale and rotation based on the mouse
    var a2 = map(mouseY, 0, 480, 80, 200);
    var b2 = 20;
    var h2 = mouseX / 10;
    
    strokeWeight(4);
    stroke('hotpink');
    fill(mouseX, mouseY, 200);
    beginShape();
    for (var i = 0; i < nPoints; i++) {
        var t2 = map(i, 0, nPoints, 0, TWO_PI);
        //hypotrochoid equation
        x2 = (a2 - b2) * cos(t2) + h2 * cos((a2 - b2) / b2 * t2);
        y2 = (a2 - b2) * sin (t2) - h2 * sin((a2 - b2) / b2 * t2);
        vertex(x2, y2);
    }
    endShape(CLOSE);
   
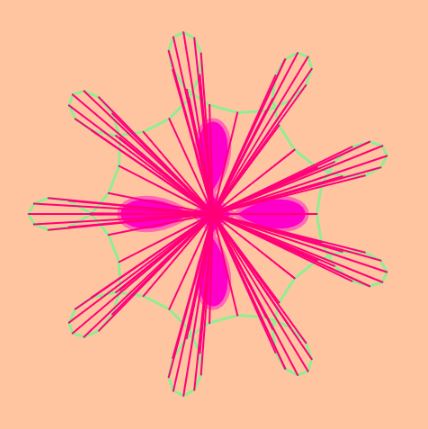
    //green hypotrochoid with lines
    var x3;
    var y3;
    
    var a3 = 180;
    var b3 = map(mouseY, 480, 0, 180, 20);
    var h3 = -mouseX / 10;
    
    //array for the lines inside the curve
    var lineX = [];
    var lineY = [];
    
    strokeWeight(3);
    stroke('lightgreen');
    noFill();
    beginShape();
    for (var i = 0; i < nPoints; i++) {
        var t3 = map(i, 0, nPoints, 0, TWO_PI);
        //hypotrochoid equation
        x3 = (a3 - b3) * cos(t3) + h3 * cos((a3 - b3) / b3 * t3);
        y3 = (a3 - b3) * sin(t3) - h3 * sin((a3 - b3) / b3 * t3);
        vertex(x3, y3);
        lineX.push(x3);
        lineY.push(y3);
    }
    endShape(CLOSE);
    
    //draw the lines inside the curve with a for loop
    for (var i = 0; i < lineX.length - 1; i++) {
        strokeWeight(2);
        stroke(mouseX + mouseY, mouseY, 120);
        line(0, 0, lineX[i], lineY[i]);
    }   
}

I was intimidated at first looking at the instructions that said we had to create an image based on math curve functions, and I thought it would be very difficult to do, but it turned out to be pretty simple. I had a lot of fun researching the different roulette curves and seeing which ones did cool things with code. I played a lot with mouseX and mouseY, as well as scale, map(), and color. My favorite part of this project is that if you stop your mouse at a different point on the canvas, the epitrochoid curve changes into a completely different curve each time; it’s so interesting to see the crazy curves it can create by changing its a, b, and h values with the mouse’s coordinates.

First state: only one hypotrochoid curves
Second state: with both hypotrochoid curves

Lanna Lang – Looking Outwards – 07

Aaron Koblin’s “Amsterdam SMS” // 2007

This project is a dynamic visualization of the mass volume of SMS messages that were transmitted on the night of New Year’s Eve across Amsterdam, revealing the city’s buildings and structures. This interactive tool was built with Processing and OpenGL. What inspires me about this project is that it usually isn’t the type of art I would normally gravitate towards, but it’s unique concept of taking the data of all the SMS messages from one of the busiest nights ever and forming a city’s cityscape with its volume is very intriguing and out-of-the-box.

I appreciate how Koblin includes a timelapse of how the SMS messages varied across the month of December, so that the drastic jump on January 1st  is exaggerated even further, displaying how many people were looking at their phone screens at the time of change of the new year. What Koblin got right was the message that this sends across by freezing the frame as soon as the date turned January 1st, and I would love to see this project redone now, and how modern technology has affected society even further than it did in 2007.

In general with Koblin and his use of data visualization art, Koblin was inspired by his interest in computer gaming and being exposed to the rich data of society that we live in, as well as learning from the two professors from UCLA who created Processing.

Aaron Koblin’s “Amsterdam SMS”

Lanna Lang – Looking Outwards – 06

John Pound’s “RAN DUM LOOP” // 1999

This project revolves around a program that writes and draws random comics and cartoon art onscreen endlessly. The program randomly combines words, colors, shapes, figures, objects, and scenes into random text stories, cartoon drawings, and comic books. What I find interesting about this project is how Pound used the program not as a passive tool, but as an active agent in making creative decisions, and the extent how Pound used randomness to create his comics – he didn’t just use it minimally on just a few panels with nonsense word balloons, he used it to create text, scribbles, figures, stories, and page layouts.

What I saw through the one screenshot Pound shared about this project is that it uses basic shapes that resemble figures and shapes, but I would like to see this recreated with modern technology that can now scan already published comics, cartoons, and comic books, and then the program can randomly generate new comics and cartoons from those. What Pound did right was his intent behind using randomness; the point of creating something random is the idea of total nonsense and something beyond our conscious that challenges both the artist and the viewers to think abstractly.

Pound was inspired by previous programs that could make random sentences by combining basic words and other programs that could draw random figures and scenes. He then had the thought of combining these two different types of programs to make nonsense Sunday comics.

The one screenshot Pound shared of “RAN DUM LOOP” that allows us to see a sneak peek as to how the randomly generated comics looked like

Lanna Lang – Project 06 – Abstract Clock

sketch

//Lanna Lang
//Section D
//lannal@andrew.cmu.edu
//Project-06-Abstract CLock

function setup() {
    createCanvas(470, 430);
    background(154, 233, 250);
  
    ellipseMode(CENTER);
    angleMode(DEGREES);
}

function draw() {
  
    //hours
    h = hour();
    //the radius changes depending on the hour
    var hRadius = map(h%12, 0, 12, 250, 350);
    //the circle color changes
    //as the hour changes
    var hPink = map(h%12, 0, 12, 0, 230);
    noStroke();
    fill(255, 183, hPink);
    ellipse(180, 215, hRadius);
    //white reflection arc
    strokeWeight(8);
    stroke(255);
    arc(240, 170, 60, 60, 300, 360);

    //minutes
    m = minute();
    //the radius changes depending on the minute
    var mRadius = map(m, 0, 60, 100, 170);
    //the circle color changes
    //as the minute changes
    var mGreen = map(m, 0, 60, 0, 150);
    noStroke();
    fill(mGreen, 205, 180);
    ellipse(180, 215, mRadius); 
  
    //seconds
    s = second();
    //the radius changes depending on the second
    var sRadius = map(s, 0, 60, 0, 70);
    //the circle color changes
    //as the second changes
    var sGreen = map(s, 0, 60, 0, 255);
    fill(255);
    ellipse(180, 215, sRadius);
  
    //light grey circle
    fill(220);
    ellipse(400, 120, 70, 70);
  
    //dark grey circle
    fill(127);
    ellipse(400, 120, 40, 40);
  
    //record player tone arm
    strokeWeight(30);
    stroke(250, 235, 154); //yellow
    line(430, 80, 410, 100);
    strokeWeight(10);
    line(410, 100, 310, 240);
    line(310, 240, 290, 250);
    strokeWeight(20);
    line(290, 250, 250, 260);
  
    //buttons on the bottom
    strokeWeight(10);
    stroke(247, 115, 125); //red
    line(20, 410, 40, 410);
    stroke(71, 171, 88); //green
    line(60, 410, 80, 410);
    stroke(47); //dark grey
    line(100, 410, 120, 410);
  
    //volume control
    stroke(127); //dark grey
    line(400, 270, 400, 390);
    strokeWeight(2);
    fill(220); //light grey
    rect(380, 300, 40, 20);
}

My process behind making this clock/record player was simple, but I wanted to familiarize myself with the map() function so I based my whole clock off the map() function. Each ellipse represents the seconds, minutes, or hours, and as time goes on, the circles enlarge and the colors lighten for the minutes and hours. I had fun creating this image and playing with colors.

My sketch

Lanna Lang – Project 05 – Wallpaper

sketch

//Lanna Lang
//Section D
//lannal@andrew.cmu.edu
//Project 05-Wallpaper

function setup() {
  createCanvas(590, 480);
  //navy blue for right quad
  //that peeks out
  background('#25363e'); 
}

function draw() {
  
//left triangle
  //repeat every 100 pixels down the canvas
  for (var y = 0; y < height; y += 100) { 
    //repeat every 60 pixels across the canvas 
    for (var x = 0; x < width; x += 60) {
      //fill with lighter brown
      fill('#af9477'); 
      triangle(x, y, x + 30, y + 20, x, y + 40);
    }
  }

//right triangle
  //repeat every 100 pixels down the canvas
  //
  for (var y = 0; y < height; y += 100) {
    //repeat every 60 pixels across the canvas
    //with additional 50 pixels off screen
    for (var x = 60; x < width + 50; x += 60) {
      //fill with darker brown
      fill('#7e5535');
      triangle(x, y, x - 30, y + 20, x, y + 40);
    }
  }
  
//center quad
  //repeat every 100 pixels down the canvas
  for (var y = 20; y < height; y += 100) {
    //repeat every 60 pixels across the canvas
    for (var x = 30; x < width; x += 60) {
      //fill with cream color
      fill('#fbe8bd');
      quad(x, y, x + 30, y + 20, x, y + 40, x - 30, y + 20);
    }
  }
  
//lower left quad
  //repeat every 100 pixels down the canvas
  for (var y = -60; y < height; y += 100) {
    //repeat every 60 pixels across the canvas
    for (var x =0; x < width; x += 60) {
      //fill with ochre color
      fill('#dcae56');
      quad(x, y, x + 30, y + 20, x + 30, y + 80, x, y + 60);
    }
  }
noLoop();
}

I wanted my wallpaper to be more geometric and include a bold, aesthetic color palette, but I didn’t want it to be a simple geometric design. I came up with this design that combined triangles and quadrilaterals, and that combination of shapes was the repeated image. I love the combination of ochre and blue, so I decided to revolve my palette around those two. This code relies solely on math and how the coordinates of each shape correlate with one another.

My sketch of what the repeated image would be and a sample of how it would look.

Lanna Lang – Looking Outwards – 05

Josh Pierce “Dailies”

I decided not to critique a single work of art that Pierce made simply because I love the whole collection that he calls “Dailies”. This collection is personal art pieces created using the programs Cinema 4D and Octane Render, which are software programs usually used by VFX artists and 3D computer graphic artists who want to create 3D objects through the computer that could interact with real space. What really inspires me and interests me is the sense of awe and tranquility his work gives me. The interaction between nature and technology is so mesmerizing to see as the two merge and collide and gives a sense of a fictional yet realistic environment.

These works of art are truly masterpieces that I cannot give any critiques that could make them better or more effective. This collection suggests some intriguing possibilities of what alternate universes, or the future world could look like, and it sends an aura of alien-like surroundings that are familiar yet different. What Pierce does fantastically with this collection is using Cinema 4D and Octane to create realistic images by matching the lighting of the sci-fi object with the created natural environment that makes it seem like it’s all in one space, instead of being computer-generated.

Pierce was inspired by the idea of colliding nature with technology and the juxtaposition that those two impose on each other and creating images that fall in fantasy and sci-fi.

One piece from his collection: “SON.OF.SUN”: I chose to include this one in my post because I love the interaction of every object and how the lights interacting with every object are so realistically depicted.
“Bubbles.”: Another piece that I included because I admired interaction between the fictional object and the rendered natural environment.
A video timelapse that shows how Pierce actually creates these images on Cinema 4D and Octane.

Lanna Lang – Project 04 – String Art

sketch_lanna2

//Lanna Lang
//Section D
//lannal@andrew.cmu.edu
//Project 04 String Art

var c1, c2; //variables for the sky gradient
var inches = 2; //variables for the person
var head = 6*inches; //variables for the person
var bodyH = 4*head; //variables for the person
var bodyW = bodyH*0.4; //variables for the person

function setup() {
    createCanvas(400, 300);

    c1 = color('#ab0068'); //sunset purple color
    c2 = color('#ff6c02'); //sunset orange color
    setGradient(c1, c2);

}

function draw() {
    noStroke();
    //draw the sea
    fill('#1b5f5e');
    rect(0, 200, width, height / 3);

    //draw the top left star
    //top left
    var x1 = 60;
    var y1 = 10;
    var x2 = 45;
    var y2 = 50;

    for (var i = 0; i < 5; i++) {
        stroke('#e3c878');
        line(x1, y1, x2, y2);
        x2 -= 7;
        y1 += 6;
    }
  
    //draw the top left star
    //top right
    var x1 = 60;
    var y1 = 10;
    var x2 = 75;
    var y2 = 50;

    for (var i = 0; i < 5; i++) {
        stroke('#e3c878');
        line(x1, y1, x2, y2);
        x2 += 7;
        y1 += 6
    }
  
    //draw the top left star
    //bottom left
    var x1 = 34;
    var y1 = 39;
    var x2 = 70;
    var y2 = 100;
  
    for (var i = 0; i < 5; i++) {
        stroke('#e3c878');
        line(x1 + 10, y1 + 10, x2, y2 - 6);
        x1 -= 7;
        y2 -= 6;
    }
  
    //draw the top left star
    //bottom right
    var x1 = 77;
    var y1 = 90;
    var x2 = 74;
    var y2 = 50;
  
    for (var i = 0; i < 5; i++) {
        stroke('#e3c878');
        line(x1 - 7, y1, x2, y2);
        x2 += 7;
        y1 -= 5;
    }

    //draw the bottom right star
    //top left
    var x1 = 360;
    var y1 = 90;
    var x2 = 345;
    var y2 = 130;

    for (var i = 0; i < 5; i++) {
        stroke('#e3c878');
        line(x1, y1, x2, y2);
        x2 -= 7;
        y1 += 6;
    }
  
    //draw the bottom right star
    //top right
    var x1 = 360;
    var y1 = 90;
    var x2 = 375;
    var y2 = 130;

    for (var i = 0; i < 5; i++) {
        stroke('#e3c878');
        line(x1, y1, x2, y2);
        x2 += 7;
        y1 += 6
    }
  
    //draw the bottom right star
    //bottom left
    var x1 = 334;
    var y1 = 119;
    var x2 = 370;
    var y2 = 180;
  
    for (var i = 0; i < 5; i++) {
        stroke('#e3c878');
        line(x1 + 10, y1 + 10, x2, y2 - 6);
        x1 -= 7;
        y2 -= 6;
    }
  
    //draw the bottom right star
    //bottom left
    var x1 = 377;
    var y1 = 170;
    var x2 = 374;
    var y2 = 130;
  
    for (var i = 0; i < 5; i++) {
        stroke('#e3c878');
        line(x1 - 7, y1, x2, y2);
        x2 += 7;
        y1 -= 5;
    }
  
    //draw the right sail
    var x1 = 200;
    var y1 = 50;
    var x2 = 230;
    var y2 = 230;

    for (var i = 0; i < 7; i++) {
        stroke('#ded8c0');
        line(x1, y1, x2, y2);
        x2 += 30;
        y1 += 5;
    }
  
    //draw the left sail
    var x1 = 200;
    var y1 = 50;
    var x2 = 220;
    var y2 = 230;
  
    for (var i = 0; i < 15; i++) {
        stroke( '#ded8c0');
        line(x1, y1, x2, y2);
        x2 -= 10;
        y1 += 10;
    }
  
    //draw the person
    stroke('#9ea9f0');
    fill('#ccc1ff');
    circle(130, 210, head);
    ellipse(130, 210 + head*0.5 + bodyH*0.5, bodyW, bodyH);
  
    //draw the brown boat
    noStroke();
    fill('#a34a28');
    beginShape();
    vertex(80, 230);
    vertex(420, 230);
    vertex(370, 280);
    vertex(130, 280);
    endShape(CLOSE);

}

//drawing a linear gradient 
//for the sunset
function setGradient(c1, c2) {
    noFill();
    for (var y = 0; y < height; y++) {
        var inter = map(y, 0, height, 0, 1);
        var c = lerpColor(c1, c2, inter);
        stroke(c);
        line(0, y, width, y);
    }
}

I tried experimenting using string art to create an actual image as people also do when they physically do string art, and I also played around with color and creating gradients, which I never attempted before. It was really difficult for me at first to envision how to create the stars, but once I started, I slowly understood what to do for each part.

Lanna Lang – Looking Outwards – 04

Yuri Suzuki’s “Sonic Playground” // 2018

“Sonic Playground” is an installation of six interactive sound sculptures that transmit and manipulate sound depending on where you’re standing, listening, or speaking. The software used in this project was Grasshopper as a plug-in for Rhinoceros 3D, and both programs aren’t acoustic software, but in certain situations with certain frequency ranges, it can be done using ray-tracing techniques. What inspires me about this project is the child-like fantasy with its playfulness and nod to the talk tubes on playgrounds from childhood, and how Suzuki plays it up with physics, engineering, and computer software, using the shape of the parabolic dishes that require time to find the exact spot where you can hear the reflection of sound at its optimum.

Suzuki makes this installation effective by using the raytracing tool to replicate the design of the internal surfaces of a concert hall to maximize the sound that reaches and envelops the audience. However, I wish that the artist made the appearance a little more interesting and different than the talking tubes that can be found on playgrounds, or somehow appeal more to the adults than the children in a way that brings the adults joy in reminiscing their childhood memories.

Suzuki was inspired by the public space in Japan and the UK and how strangers don’t tend to start conversations with strangers, and he wanted to create an experience between people who must communicate through audio. He was also inspired by the sound mirrors in Kent that were originally built by the UK’s national defense force in the early 19th century.

A static image of kids interacting with Yuri Suzuki’s “Sonic Playground”: demonstrates how people interact with the installation, and showing how kneeling or standing can change the sound.
Screenshots of how “Sonic Playground” was completed using Grasshopper and Rhinoceros 3D, showing how the computer software fits into this project.

Lanna Lang – Project 03 – Dynamic Drawing

lanna_project3_sketch

//Lanna Lang
//Section D
//lannal@andrew.cmu.edu
//Project 03 Dyanamic Drawing

var circW;
var angle1 = 0;
var angle2 = 0;

function setup() {
    createCanvas(640, 480);
}

function draw() {
    background(0);
   
//rotating white rectangle
    push();
    translate(200, 200);
    rotate(radians(angle2));
    noStroke();
    fill(255);
    rectMode(CENTER);
    //the size will increase/decrease as the mouse moves
    rect(0, 0, mouseX + 200, mouseY + 150);
    pop();
    //rotating counter clockwise
    angle2 = angle2 - 5;
  
//rotating colorful rectangle
    push();
    translate(200, 200);
    rotate(radians(angle1));
    noStroke();
    //as the mouse moves around, the color of the rect changes
    fill(170, mouseX, mouseY);
    rectMode(CENTER);
    //the size of the rect will increase/decrease as the mouse moves
    rect(0, 0, mouseX, mouseY + 50);
    pop();
    //rotating clockwise
    angle1 = angle1 + 5;

//as the mouse goes right, the size of the circle increases  
    if (mouseX > width/2) {
      circW = (width/2 + 50);
    } else {
      circW = (mouseX);
    }
 
//as the mouse moves around, the color of the circles change 
    stroke(0);
    fill(mouseX, 170, mouseY);
    circle(mouseX, mouseY, circW);
    
}

I really wanted to play around with gradient colors and seeing the after-effects of each shape’s fast movements. At first, I wanted to experiment with having my background(…); line of code in my function setup() and how that would change my drawing, but it wouldn’t work with my rotating rectangles, so maybe I’ll experiment in a future project.

Lanna Lang – Looking Outwards – 03

Benjamin Dillenburger & Michael Hansmeyer’s “Digital Grotesque” / 2013, 2017

Digital Grotesque is made up of two full-size grottos that were 3D printed out of sandstone. It is a highly ornamented structure that was designed by algorithms, depicting how new technology is leading to radical changes in architectural design, and Digital Grotesque demonstrates this by taking this new technology to a scale never done before – truly life-sized. What I find admirable is the absolute intricacy of each crevice in this piece. The work is a 3.2-meter-high, 16 square meters long room, and is crammed full of minute details that stand between chaos and order.

Nothing can make this project any more perfect than it already is. It suggests an unimagined richness that at a glance can be overwhelming, and all the viewers can do is marvel, become curious and bewildered. One “flaw” that could be said about this piece is the seams between each 3D printed section, but I actually enjoy seeing the seams as a viewer because it’s a reminder of where this was initially conceived from; it’s not pretending to be built from stone or marble, it’s accepting its 3D printed quality. I applaud the creators who perfectly executed the concept full of juxtaposition: complexity yet reductionism, chaos and order, natural and artificial, foreign and familiar through its architectural design, composition, and geometric processes.

This project was reminiscent towards the Church of Sagrada Familia by Spanish architect Antonio Gaudi, and the artists are architects, programmers, and professors who are passionate about exploring the vast opportunities that computation applications can affect design and fabrication of architectural forms.

An image of the view looking up in the grotto II that depicts the sheer vastness and how ornamental, chaotic, and beautiful it is.
A video of the behind the scenes process of building “Digital Grotesque”
A video that shows fragments of the digital fabrication of “Digital Grotesque” and the computer-generated render.