//Lanna Lang
//Section D
//lannal@andrew.cmu.edu
//Project 07 - Curves

var nPoints = 100;
var angle = 0;

function setup() {
    createCanvas(480, 480);
}

function draw() {
    background('#ffc5a1'); //pastel orange

    //call, translate, and rotate
    //the epitrochoid curve
    push();
    translate(width/2, height/2);
    rotate(radians(angle));
    drawEpitrochoid();
    angle += 10;
    pop();

    //call and translate the hypotrochoid curve
    push();
    translate(width/2, height/2);
    drawHypotrochoid();
    pop();
}

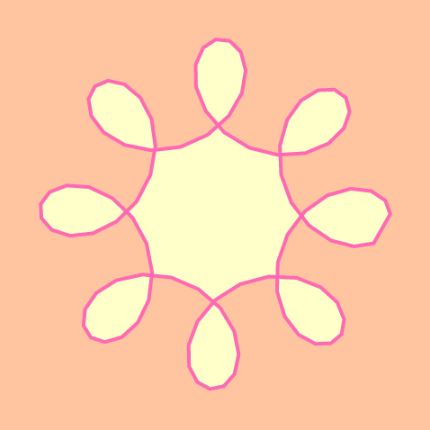
//Epitrochoid curve (biggest curve)
function drawEpitrochoid() {
    //http://mathworld.wolfram.com/Epitrochoid.html

    var x1;
    var y1;

    //scale and rotation based on mouseY and mouseX
    var a1 = map(mouseY, 0, 480, 10, 70);
    var b1 = 20;
    var h1 = mouseX;

    strokeWeight(4);
    stroke('lightyellow');
    fill(mouseX, 150, mouseY); //fill based on the mouse
    beginShape();
    for (var i = 0; i < nPoints; i++) {
        var t1 = map(i, 0, nPoints, 0, TWO_PI);
        //epitrochoid equation
        x1 = (a1 + b1) * cos(t1) - (h1 * cos((a1 + b1 / b1) * t1));
        y1 = (a1 + b1) * sin(t1) - (h1 * sin((a1 + b1 / b1) * t1));
        vertex(x1, y1);
    }
    endShape(CLOSE);
}

//Hypotrochoid curve
function drawHypotrochoid() {
    //http://mathworld.wolfram.com/Hypotrochoid.html

    //rainbow filled hypotrochoid
    var x2;
    var y2;

    //scale and rotation based on the mouse
    var a2 = map(mouseY, 0, 480, 80, 200);
    var b2 = 20;
    var h2 = mouseX / 10;

    strokeWeight(4);
    stroke('hotpink');
    fill(mouseX, mouseY, 200);
    beginShape();
    for (var i = 0; i < nPoints; i++) {
        var t2 = map(i, 0, nPoints, 0, TWO_PI);
        //hypotrochoid equation
        x2 = (a2 - b2) * cos(t2) + h2 * cos((a2 - b2) / b2 * t2);
        y2 = (a2 - b2) * sin (t2) - h2 * sin((a2 - b2) / b2 * t2);
        vertex(x2, y2);
    }
    endShape(CLOSE);

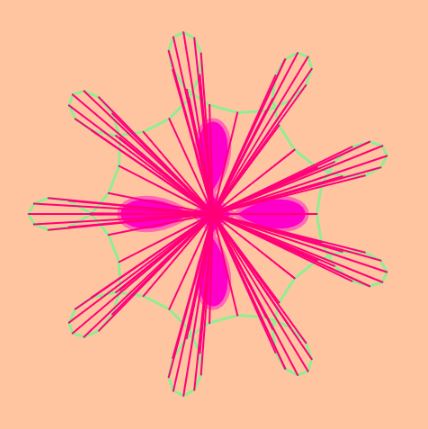
    //green hypotrochoid with lines
    var x3;
    var y3;

    var a3 = 180;
    var b3 = map(mouseY, 480, 0, 180, 20);
    var h3 = -mouseX / 10;

    //array for the lines inside the curve
    var lineX = [];
    var lineY = [];

    strokeWeight(3);
    stroke('lightgreen');
    noFill();
    beginShape();
    for (var i = 0; i < nPoints; i++) {
        var t3 = map(i, 0, nPoints, 0, TWO_PI);
        //hypotrochoid equation
        x3 = (a3 - b3) * cos(t3) + h3 * cos((a3 - b3) / b3 * t3);
        y3 = (a3 - b3) * sin(t3) - h3 * sin((a3 - b3) / b3 * t3);
        vertex(x3, y3);
        lineX.push(x3);
        lineY.push(y3);
    }
    endShape(CLOSE);

    //draw the lines inside the curve with a for loop
    for (var i = 0; i < lineX.length - 1; i++) {
        strokeWeight(2);
        stroke(mouseX + mouseY, mouseY, 120);
        line(0, 0, lineX[i], lineY[i]);
    }
}
I was intimidated at first looking at the instructions that said we had to create an image based on math curve functions, and I thought it would be very difficult to do, but it turned out to be pretty simple. I had a lot of fun researching the different roulette curves and seeing which ones did cool things with code. I played a lot with mouseX and mouseY, as well as scale, map(), and color. My favorite part of this project is that if you stop your mouse at a different point on the canvas, the epitrochoid curve changes into a completely different curve each time; it’s so interesting to see the crazy curves it can create by changing its a, b, and h values with the mouse’s coordinates.


![[OLD FALL 2019] 15-104 • Introduction to Computing for Creative Practice](https://courses.ideate.cmu.edu/15-104/f2019/wp-content/uploads/2020/08/stop-banner.png)