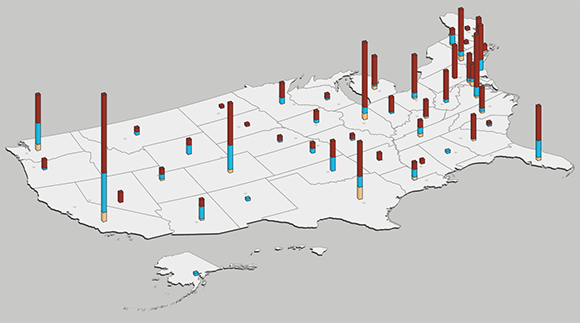
Wes Grubbs created an interactive data visualization software to collect data about Hate Flyering across the USA for the Southern Poverty Law Center.
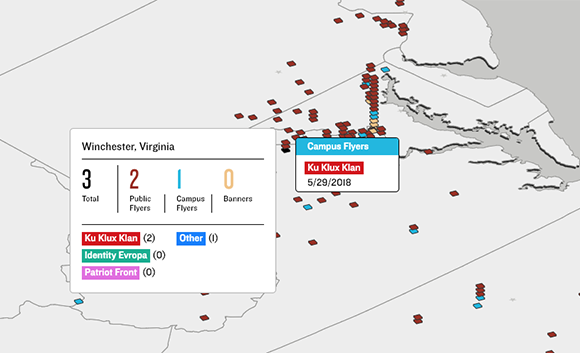
Users are able to zoom to view, select each state to see the statistics, and also see the change in Hate Flyering over time. The interactive visualization allows you to select the time range from 2018-2019, see the different groups of flyers and the types of flyering.
I really admire that Grubbs created an interactive visualization for something very prevalent in today’s society. I don’t know what algorithms generated this work, but I am astounded by the creativity of Grubbs to create an actual map drawing of the USA with 3D bar graphs. The bar heights increase with the number of Hate Flyerings. In addition, the bay is specifically located (on the map) on the location (in the US) where the data was gathered. This seems like such a simple idea, yet the creativity manifests in this form of presentation.


![[OLD FALL 2019] 15-104 • Introduction to Computing for Creative Practice](https://courses.ideate.cmu.edu/15-104/f2019/wp-content/uploads/2020/08/stop-banner.png)