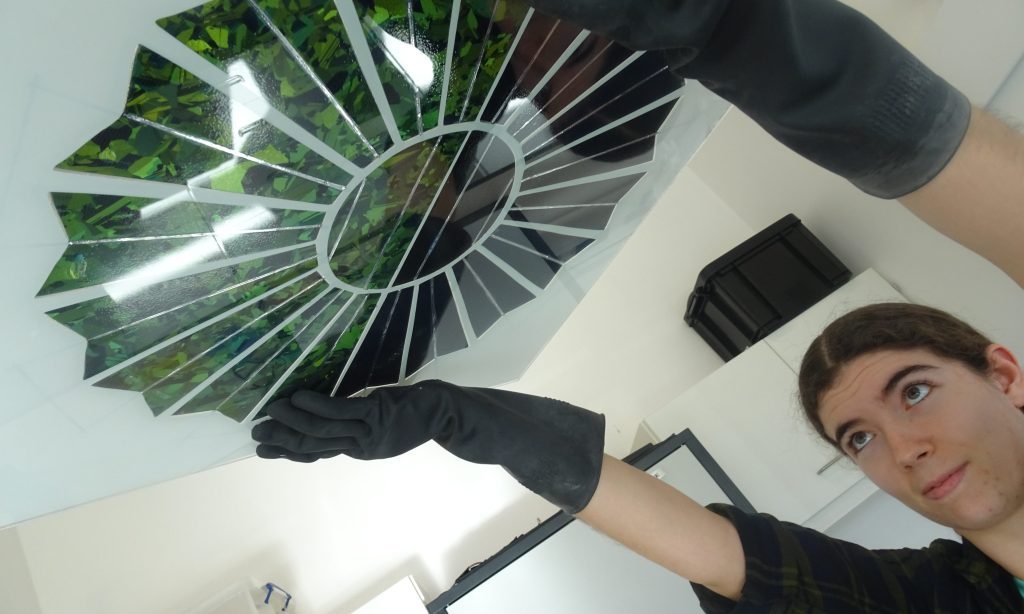
For my final project I am creating a climate change related game. One project I found that was relevant to this is Solar Tapestry by Chloe Uden. Solar tapestry is an artful way of arranging solar panels in order to create an aesthetic and ecological form of energy. Chloe Uden describes this as “the Art and Energy collective re-imagines solar technology as an art material for the future.”
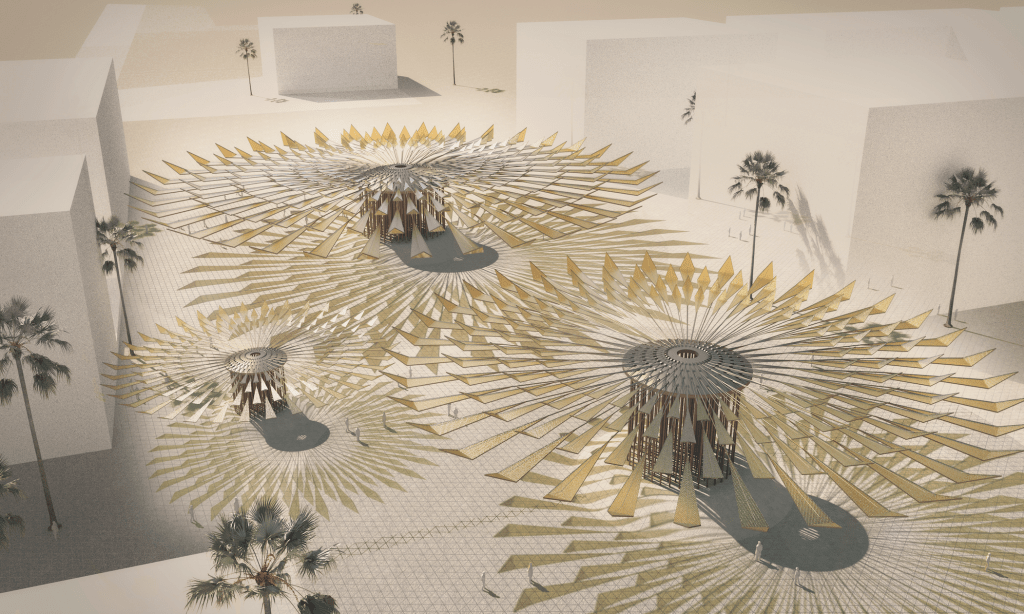
Another project that related to my final project is Starlit Stratus. Starlit Stratus, by Sunggi Park, is the first place winner of LAGI 2019 Abu Dhabi competition. It is a large-scale public art capable of producing clean energy. The canopy is made with inspired by origami. Sections of the triangular geometry are made from conventional rigid photovoltaic material to produce clean electricity during the day, while other sections are made from fabric that can easily fold and unfold. At night the light passes through these fabric geometries to create star-like patterns.
Both of these artworks use solar panels in creative and artistic ways to produce clean energy that is good for the environment. This aesthetic arrangement of clean energy use encourages more people to become more ecological.
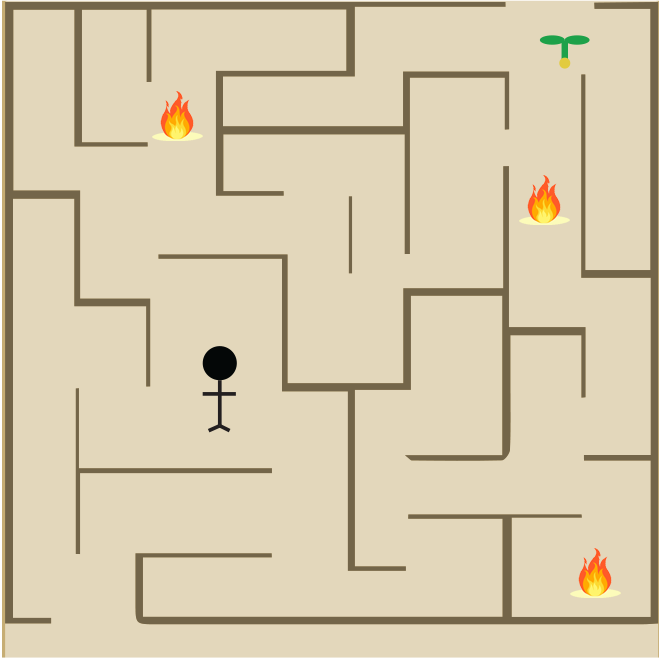
We will be creating an interactive game related to climate change. The purpose of the game is to navigate through the maze in order to reach the tree sapling. Once the character reaches the tree sapling, it will mature into a tree. And then a new sapling appears somewhere else in the maze which the character must reach. Eventually, after playing the game long enough, the maze will be populated by trees. The fires will be moving in specific locations, so the character must avoid them in order to prevent game over.
We will use some sound effects to indicate success or failure and when a tree pops up. We’ll be using objects and turtle graphics in order to create this game.
/*  Mari Kubota
    49-104 Section 1
    mkubota@andrew.cmu.edu
    Project 11
*/

var lamps = [];
var stars = [];
var buildings = [];


function setup() {
    createCanvas(480, 280);

    // create an initial collection of objects
    for (var i = 0; i < 10; i++){
        var rx = random(width);
        lamps[i] = makeLamp(rx);
        stars[i] = makeStar(rx);
        buildings[i] = makeBuilding(rx);
    }
    frameRate(10);
}


function draw() {
//creates gradient sky
	c1 = color(0, 28, 84);
    c2 = color(222, 241, 255);
    setGradient(c1, c2);

//creates roads
    noStroke();
    fill(100);
    rect(0, height*.75, width, height/4);
    fill(200);
    stroke(50);
    rect(0,height*.9, width, height/9);
//calls functions with objects
    updateAndDisplayStars();
    removeStarsThatHaveSlippedOutOfView();
    addNewStarsWithSomeRandomProbability();

    updateAndDisplayBuildings();
    removeBuildingsThatHaveSlippedOutOfView();
    addNewBuildingsWithSomeRandomProbability();

    updateAndDisplayLamps();
    removeLampsThatHaveSlippedOutOfView();
    addNewLampsWithSomeRandomProbability();

}


function updateAndDisplayLamps(){
    // Update the building's positions, and display them.
    for (var i = 0; i < lamps.length; i++){
        lamps[i].move();
        lamps[i].display();
    }
}

function updateAndDisplayStars(){
    // Update the building's positions, and display them.
    for (var i = 0; i < stars.length; i++){
        stars[i].move();
        stars[i].display();
    }
}

function updateAndDisplayBuildings(){
    // Update the building's positions, and display them.
    for (var i = 0; i < buildings.length; i++){
        buildings[i].move();
        buildings[i].display();
    }
}
//////////////////////////////////////////////////////


function removeLampsThatHaveSlippedOutOfView(){
    // takes away lamps once they leave the frame
    var lampsToKeep = [];
    for (var i = 0; i < lamps.length; i++){
        if (lamps[i].x + lamps[i].breadth > 0) {
            lampsToKeep.push(lamps[i]);
        }
    }
    lamps = lampsToKeep; // remember the surviving buildings
}


////////////////////////////////////////////////////////
function removeStarsThatHaveSlippedOutOfView(){
//removes stars from array stars and puts them in new array
//once they've moved off the edge of frame
    var starsToKeep = [];
    for (var i = 0; i < stars.length; i++){
        if (stars[i].x + stars[i].breadth > 0) {
            starsToKeep.push(stars[i]);
        }
    }
    stars = starsToKeep; // remember the surviving stars
}

function removeBuildingsThatHaveSlippedOutOfView(){
    var buildingsToKeep = [];
    for (var i = 0; i < buildings.length; i++){
        if (buildings[i].x + buildings[i].breadth > 0) {
            buildingsToKeep.push(buildings[i]);
        }
    }
    buildings = buildingsToKeep; // remember the surviving buildings
}
////////////////////////////////////////////////////////////////////////


function addNewLampsWithSomeRandomProbability() {
    // With a very tiny probability, add a new building to the end.
    var newLampLikelihood = 0.03;
    if (random(0,1) < newLampLikelihood) {
        lamps.push(makeLamp(width));
    }
}

function addNewStarsWithSomeRandomProbability() {
    // With a very tiny probability, add a new building to the end.
    var newStarLikelihood = 0.02;
    if (random(0,1) < newStarLikelihood) {
        stars.push(makeStar(width));
    }
}

function addNewBuildingsWithSomeRandomProbability() {
    // With a very tiny probability, add a new building to the end.
    var newBuildingLikelihood = 0.007;
    if (random(0,1) < newBuildingLikelihood) {
        buildings.push(makeBuilding(width));
    }
}
///////////////////////////////////////////////////////////////////////////


// method to update position of building every frame
function lampMove() {
    this.x += this.speed;
}

function starMove() {
    this.x += this.speed;
}

function buildingMove() {
    this.x += this.speed;
}
//////////////////////////////////////////////////////////////////////////////


// draws lamps
function lampDisplay() {
    fill(255,255,0,45);
    noStroke();
    ellipse(this.x, height -25 - this.h,this.r,this.r); //halo of light from lamp
    fill(102,166,218);
    rect(this.x-1.5, height - 25-this.h, this.breadth, this.h); //lamp post
    fill(255);
    ellipse(this.x, height -25 - this.h, this.r2, this.r2); //lightbulb
    stroke(255);
    strokeWeight(0.5);
    noFill();
    quad(this.x - 1.5, height - 20 - this.h,
        this.x - 5, height - 35 - this.h,
        this.x + 5, height - 35 - this.h,
        this.x + this.breadth - 1.5, height - 20 - this.h); //draws the lamp box
}

function starDisplay(){
  //halo of light around star
  noStroke();
  fill(255, 255, 0, 30);
  ellipse(this.x + this.breadth/2, this.h, this.breadth * 5, this.breadth * 5);
  stroke(255,255,0);
  strokeWeight(0.5);
  noFill();
  //draws diamonds that make up star
  quad(this.x, this.h,
       this.x + this.breadth / 2,this.h - this.tall / 2,
       this.x + this.breadth, this.h,
       this.x + this.breadth / 2,this.h + this.tall / 2);
}

function buildingDisplay() {
    var floorHeight = 20;
    var bHeight = height;
    noStroke();
    fill(0);
    push();
    translate(this.x, height - 40);
    rect(0, -bHeight, this.breadth, bHeight);
    for (var i = 0; i < this.nFloors; i+=2) {
    	fill("yellow");
        rect(5, -15 - (i * floorHeight), this.breadth - 10, 15);
    }
    pop();
}
//////////////////////////////////////////////////////////////////////////


function makeLamp(posX) {
    var lamp = {x: posX,
                breadth: 3,
                speed: -2.5,
                h: random(40,60),
                r: random(20,35),
                r2: 4,
                move: lampMove,
                display: lampDisplay}
    return lamp;
}

function makeStar(posX) {
    var star = {x: posX,
                breadth: 3,
                speed: -0.5,
                tall: random(5,10),
                h: random(20, 100),
                move: starMove,
                display: starDisplay}
    return star;
}

function makeBuilding(birthLocationX) {
    var bldg = {x: birthLocationX,
                breadth: 60,
                speed: -1.0,
                nFloors: round(random(10,20)),
                move: buildingMove,
                display: buildingDisplay}
    return bldg;
}
//////////////////////////////////////////////////////////////////////////////

//gradient sky function
function setGradient(c1, c2) {
  noFill();
  for (var y = 0; y < height; y++) {
    var inter = map(y, 0, height, 0, 1);
    var c = lerpColor(c1, c2, inter);
    stroke(c);
    line(0, y, width, y);
  }
}
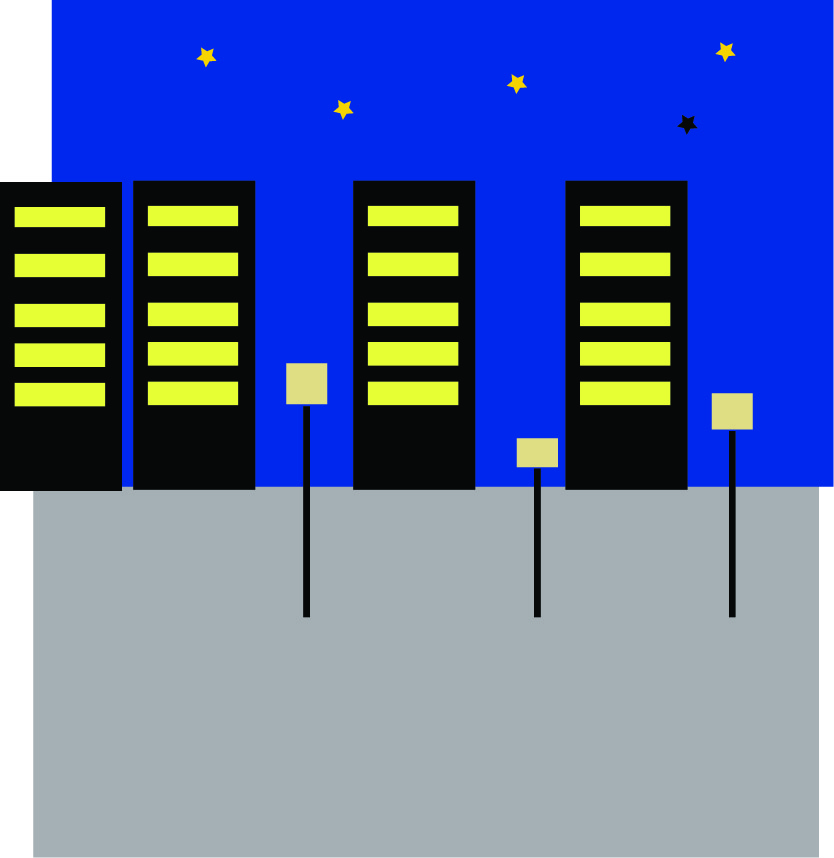
For this project, I created a landscape of a city during the night time. The three objects in the landscape are the buildings, lamps, and stars. All of the objects appear randomly in random quantities. The only consistency is the height at which the buildings and lamps appear. The lamps’s colors are randomized and made transparent in order to create a halo effect. The objects all move across the canvas at different speeds in order to create a sense of depth. The stars move slowest, followed by the buildings, and the lamp posts move the fastest.
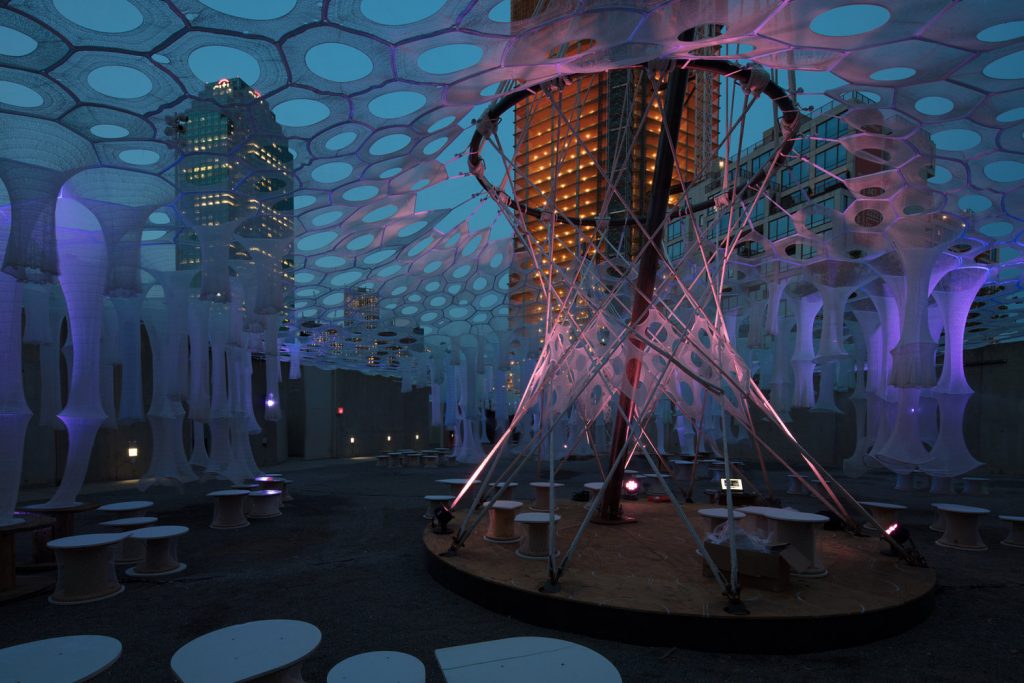
Jenny E. Sabin is an architectural designer whose work is at the forefront of a new direction for 21st century architectural practice. She is principal of Jenny Sabin Studio, an experimental architectural design studio based in Ithaca and Director of the Sabin Design Lab at Cornell AAP, a design research lab with specialization in computational design, data visualization and digital fabrication.
Lumen (2017) night time
Lumen (2017) by Jenny Sabin is a digitally fabricated architectural work that won the 2017 Museum of Modern Art’s PS1 Young Architect’s Program. The structure is a socially and environmentally responsive lightweight knitted fabric that adapts to the densities of bodies, heat, and sunlight. Lumen is composed out of tubular structures and a canopy of cellular components employs recycled textiles, photo-luminescent and solar active yarns that absorb, collect, and deliver light. The structure also incorporates an automatic misting system that activates depending on the proximity of a visitor.
For this project I used my project 3 code as a starting point. The movement in the x coordinate changes the frequency. The movement of the y coordinate changes the amplitude. Mouse press resets the frequency to a certain point. Pressing any key randomizes the frequency. If the firefly is off canvas, the sound automatically stops to prevent from any unsavory sounds.
/*  Mari Kubota
    49-104 Section D
    mkubota@andrew.cmu.edu
    Assignment 10
*/

var x = 300;
var y = 300;
var diameter = 8;
var diffx = 0;
var diffy = 0;
var targetX = 300;
var targetY = 300;
var angle = 0;
var value=0;

var frequency=400.0;
var amplitude= 5;


function setup() {
    createCanvas(640, 480);
    useSound();

}

function preload() {
}


function soundSetup() { // setup for audio generation
    // you can replace any of this with your own audio code:
    osc = new p5.TriOsc();
    osc.freq(frequency);
    osc.amp(amplitude);
    osc.start();
}


function draw(){
    background (200-mouseY,220-mouseY,250);
//trees
    translate(100 - mouseX/2, 0);
    fill(0);
    rect (-1000, 400,3050,80);

    rect (30,200,20,200);
    triangle (40,150,80,350,0,350);

    rect (180,200,20,200);
    triangle (190,150,100,350,280,350);

    rect (330,200,20,200);
    triangle (340,150,380,350,300,350);

    rect (530,200,20,200);
    triangle (530,100,640,350,440,350);

    rect (750,200,20,200);
    triangle (750,100,860,350,660,350);

//sun
    fill("red");
    ellipse(30,50,50,50);


//firefly
    fill(value-100, value, value-200);
    diffx = mouseX - x;
    diffy = mouseY - y;
    x = x + 0.1*diffx;
    y = y + 0.1*diffy;
    noStroke();
    ellipse(x, y, diameter, diameter);

//sound
    if(diffx > 0){
        osc.freq(frequency++); // difference in x changes frequency
    } else if(diffx<0){
        osc.freq(frequency--);
    }

    if(diffy > 0){
        osc.amp(amplitude++); //difference in y changes amplitude
    } else if(diffy<0){
        osc.amp(amplitude--);
    }

    if (mouseIsPressed) { // resets frequency to 400
        frequency= 400;
    }

//sound cuts off if firefly is off canvas
    if(x>width+450 || x<-400){
        amplitude=0;
    }

    if(y>height || y<0){
        amplitude=0;
    }

}

//press any key to randomize frequency
function keyPressed(){
    frequency= random(200,2000);
}
The Classyfier, created by Benedict Hubener, Stephanie Lee and Kelvyn Marte at the CIID, is a table that detects the beverages people consume around it and chooses music that fits the situation accordingly.
A built in microphone catches characteristic sounds and then compares these sounds to a catalogue of pre-trained examples. The Classyfier identifies it as belonging to one of three classes; hot beverages, wine or beer. Each class has its own playlist that one can navigate through by knocking on the table.
The idea behind this project was to build a smart object that uses machine learning and naturally occurring sounds as input to enhance the ambiance of different situations. The main tools used were Wekinator, Processing and the OFX collection.
/*
Mari Kubota
Section D
mkubota@andrew.cmu.edu
Assignment-09
*/

var lines = []; // Empty array to store ellipses

// Load image
function preload() {
    underlyingImage = loadImage("https://i.imgur.com/23aauRel.jpg");
}

function setup() {
    createCanvas(550, 420);
    underlyingImage.loadPixels();
}

// Determines the properties
function makelines() {
    var ix = constrain(floor(this.x), 0, width-1);
    var iy = constrain(floor(this.y), 0, height-1);
    var theColorAtLocationXY = underlyingImage.get(this.x, this.y); //gets the color value of the image at (x,y)
    var linethickness= 5;//thickness of lines

    fill(theColorAtLocationXY) // Fills the ellipse with the color of the image at (x,y)
    noStroke();
    ellipse(this.x, this.y, linethickness); // Draws the ellipse at (x,y) with the width and the height dimension of 'ballsize' which is a random number between 2 and 8
}

// Makes the lines move
function linespeed() {
    this.x += this.dx; // MouseY will be later assigned as 'y'
}

// function to create properties of ellipse to be called on later
function drawPortrait(originalx, originaly, originaldx) {
    p = {x: originalx,
         y: originaly,
         dx: originaldx,
         speed: linespeed,
         lines: makelines,
        }
    return p;
}

//draws the lines
function draw() {
    newLines = []; // Creates an empty array for new lines
    for (var i = 0; i < lines.length; i++) {
        var p = lines[i];
        p.speed(); //returns the function speed from drawPortrait
        p.lines(); //returns the function balls from drawPortrait
        newLines.push(p);
    }
    lines = newLines;
}


// When the mouse is moved it replaces the originalx, originaly, and originaldx values with mouseX, mouseY and random(-20,20) and make the drawPortrait function actually happen and to be stored in the newball array
function mouseMoved() {
        var newLines = drawPortrait(mouseX, mouseY, random(-20, 20));
        lines.push(newLines);
        this.x += random(this.x-3, this.x+3);
}
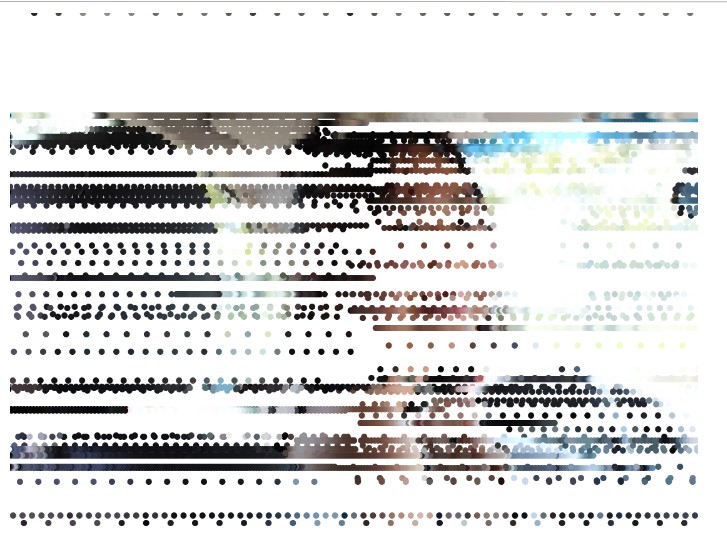
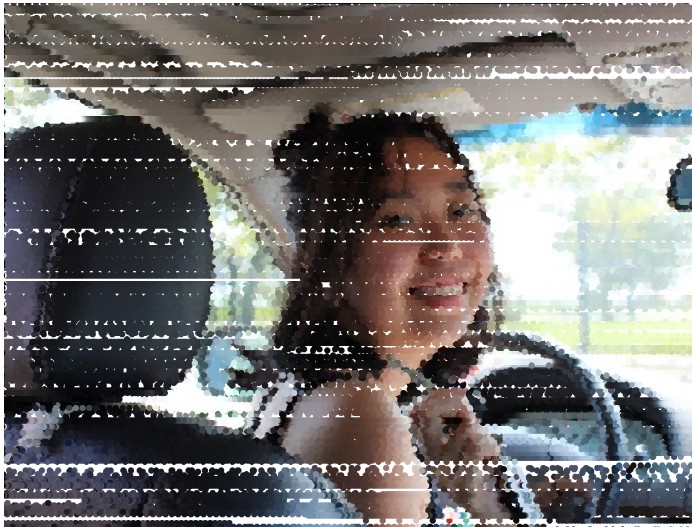
For this project I used a picture of me from over the summer when I was learning how to drive. The image appears when you mouse over the picture and the picture appears with horizontal strips which were made using ellipse().
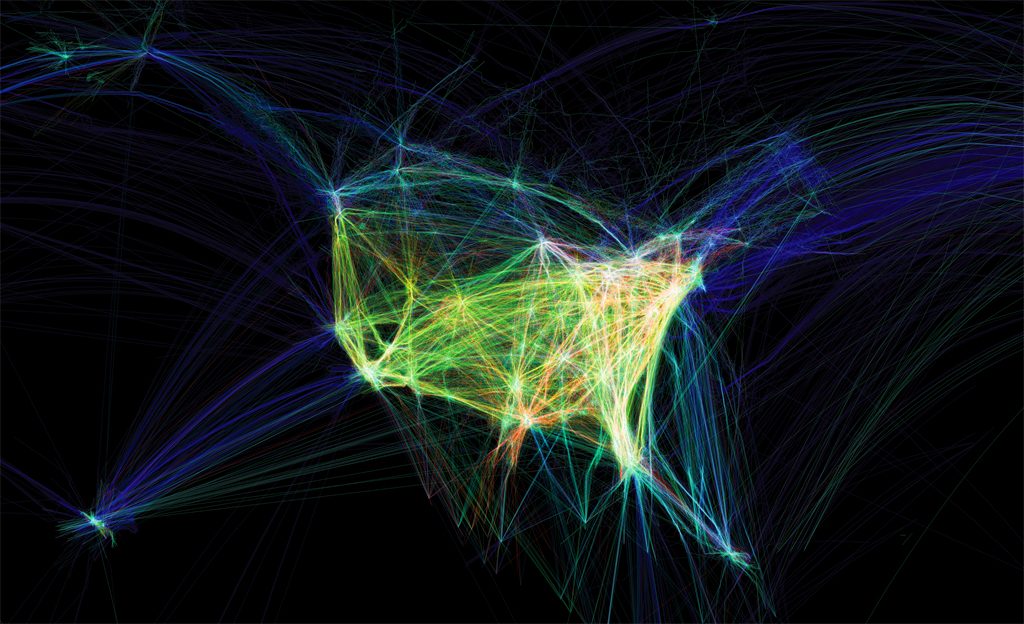
The blog post I looked at was Ankitha Vasudev’s post on a time lapse animation called Flight Pattern (2011) by Aaron Koblin. Flight Pattern displays a 24 hour time period of American air traffic patterns and densities, by following the routes of around 140,000 American planes crossing the United States. I found this project interesting because the time lapse animation visually shows how widespread and frequent travel inside of America is. Aaron Koblin’s use of color and patterns to illustrate a wide range of data including aircraft type, no-fly zones, weather patterns and alteration to routes helps to visualize large amounts of data into one concise animation. I also agree with Ankitha’s opinion that uses the time lapse animation and the data gathered for it in order to show the intertwining of humans and technology. The animation shows that human movement is synonymous to the movement of technology.
Robert Hodgins is an artist and coder. He graduated in 1998 from RISD with a degree in sculpture but went on to found the Barbarian Group and worked with them until late 2009. He also is a co-creator of the Cinder C++ framework along with Andrew Bell, Hai Nguyen, and dozens of developers around the world. In his website bio, he says that he primarily does 2D and 3D simulations using code and that his primary interests include theoretical physics, astronomy, particle engines, and audio visualizations.
The lecture I watched is from Eyeo 2014 but he has also talked in the festival two times before. He describes his job as creative coding but also acknowledges that his job is hard to define. In the lecture he describes the difficulties he runs into while in his creative endeavours. One project he explained in the lecture is “Planet Earth.” The project is a visualization of the earth using material texture data from NASA. The program can visualize using lighting, geography, and the atmospheric effects.
Robert Hodgins method of presenting his work involves a lot of humor in order to engage his audience, which is a quality I admire. His work itself is also demonstrated in order to grab the audience’s attention.
<!DOCTYPE html>
<html>
  <head>
    <meta charset="UTF-8">
    <title>p5.js vers 0.7.1, Edit index.html to Change This Title</title>
    <script src="https://cdnjs.cloudflare.com/ajax/libs/p5.js/0.7.1/p5.js"></script>
    <script src="https://cdnjs.cloudflare.com/ajax/libs/p5.js/0.7.1/addons/p5.dom.js"></script>
    <script src="https://cdnjs.cloudflare.com/ajax/libs/p5.js/0.7.1/addons/p5.sound.js"></script>
    <script src="sketch.js" type="text/javascript"></script>
  </head>
  <body>
  </body>
</html>
In this project I created used the Conchoid of de Sluze curve to create continuously changing circle which is controlled by the mouse. The equation of the curve was x=(sec t +acos t) cos t, y=(sec t +acos t) sint in parametric form. The tricky part of the project was that p5js did not understand “sec t” so I had to rewrite it in cosine form.
![[OLD FALL 2019] 15-104 • Introduction to Computing for Creative Practice](https://courses.ideate.cmu.edu/15-104/f2019/wp-content/uploads/2020/08/stop-banner.png)