Nawon Choi— Looking Outward 07

History Words Flow

History Words Flow by Santiago Ortiz

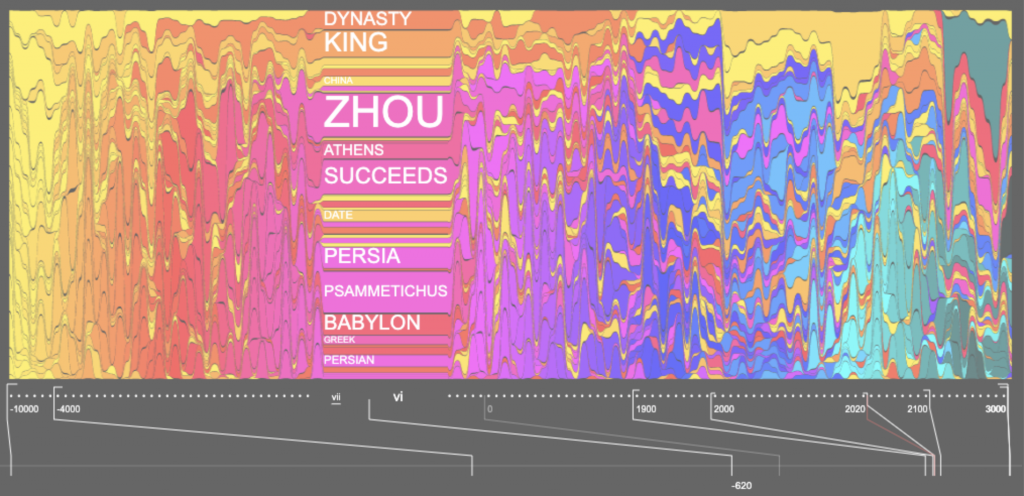
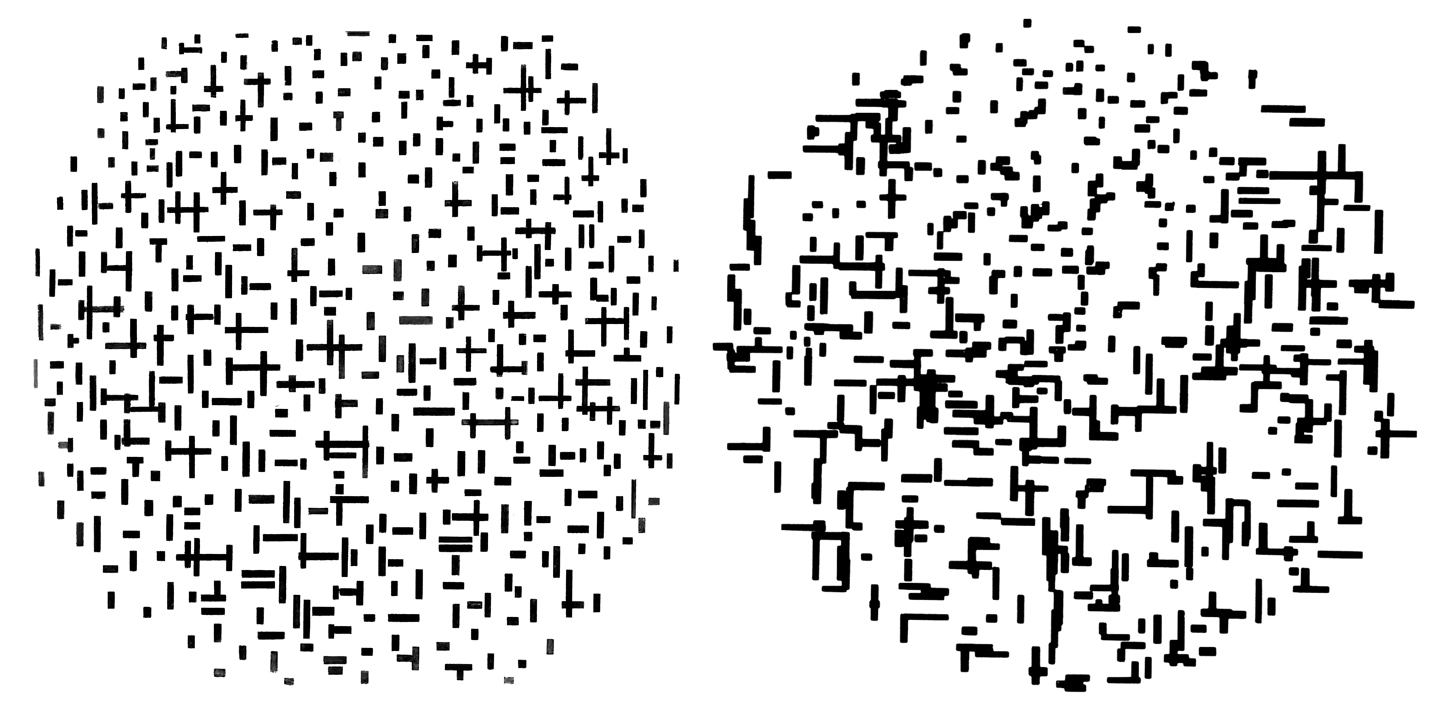
I chose Santiago Ortiz’s “History Words Flow” because I found the way he represented the data really intriguing and visually captivating. He represents the words found in Wikipedia articles about different time periods. In a video, he talks about the way he chose to represent the words. He uses scale and color to indicate the frequency and type of word, and arranges these words on a timeline that looks like melting or flowing paint. Moreover, the information is not absorbable at once glance. The viewer must scroll through the timeline in order to parse through and view each of the most common words at a single point in history. I liked this project because it was an interested concept executed in a creative and unique way.

Nawon Choi— Project 07 Curves

sketch

// Nawon Choi
// nawonc@andrew.cmu.edu
// Section C
// Project 07 Composition with Curves

// number of points
var np = 100;

function setup() {
    createCanvas(400, 400);
}

function draw() {
    background("black");

    stroke("#f7fad2");
    noFill();
    strokeWeight(2);

    // center the curves
    push();
    translate(200, 200);
    drawHypocycloid(100);

    // color of second curve depends on mouseX
    fill(255, 200, mouseX);
    drawHypocycloid(-200);
    pop();
}


// http://mathworld.wolfram.com/HypocycloidEvolute.html
function drawHypocycloid(xy) {
    var x;
    var y;
    var a = xy;
    var b = mouseY;

    beginShape();
    for (var i = 0; i < np; i++) {
        var t = map(i, 50, np, 50, TWO_PI);

        var one = a / (a - 2 * b);

        x = one * ((a - b) * cos(t) - b * cos(((a - b) / b) * t));
        y = one * ((a - b) * sin(t) + b * sin(((a - b) / b) * t));

        vertex(x, y);
    }
    endShape();
}

For this project, I chose to draw a curve called Hypocycloid Evolute. It was fun playing around by plugging in different variables at different points and seeing how it affects the shape. I eventually decided on having one of the variables, b, be dependent on the y-position of the mouse. I originally drew one curve, but decided to add another one to create depth. I drew another, larger curve and filled in the shape to create different flower-esque shapes as a result. I really enjoyed seeing how the changing colors and varying number of edges and angles created significantly different images with a single curve.

Nawon Choi— Project 06 Abstract Clock

sketch

// Nawon Choi
// nawonc@andrew.cmu.edu
// Section C
// Project 06 Abstract Clock

var prevSec;
var millisRolloverTime;

var ons = ['zero', 'one', 'two', 'three', 'four', 'five', 'six', 'seven', 'eight', 'nine']; 
var tns = ['ten', 'eleven', 'twelve', 'thirteen', 'fourteen', 'fifteen', 'sixteen', 'seventeen', 'eighteen', 'nineteen']; 
var tnspls = ['twenty', 'thirty', 'forty', 'fifty', 'sixty', 'seventy', 'eighty', 'ninety']; 

var milli;
var sec;
var mins;
var hr;

function setup() {
    createCanvas(400, 400);
    millisRolloverTime = 0;
}

function draw() {
    background("black");
    
    // Fetch the current time
    var H = hour();
    var M = minute();
    var S = second();
    if (prevSec != S) {
        millisRolloverTime = millis();
    }
    prevSec = S;
    var mils = floor(millis() - millisRolloverTime);
    
    textFont("Helvetica");
    textAlign(CENTER, CENTER);
    
    // increase in size based on time
    fill(50);
    textSize(mils);
    textStyle(NORMAL);
    var mm = int(mils / 10);
    milli = toWords(mm);
    text(milli, width / 2, height / 2);

    fill(75);
    textSize(S * 5);
    textStyle(NORMAL);
    sec = toWords(S);
    text(sec, width / 2, height / 2);

    fill(150);
    textSize(M * 2);
    textStyle(NORMAL);
    mins = toWords(M);
    text(mins, width / 2, height / 2);

    fill(230);
    textSize(H);
    textStyle(NORMAL);
    hr = toWords(H);
    text(hr, width / 2, height / 2);
}

function toWords(x) {
    if (x < 10) {
        return ons[x];
    } else if (x >= 10 & x < 20) {
        var i = x - 10;
        return tns[i];
    } else {
        if (x % 10 == 0) {
            var i = (x / 10) - 2;
            return tnspls[i];
        } else {
            var i = x % 10;
            var o = ons[i];
            var ii = int(x / 10) - 2;
            var t = tnspls[ii];
            var arr = [t, o];
            return join(arr, "");
        }
    }
}

When thinking of ideas for this assignment, I initially brainstormed a variety of different pictorial representations of the passage of time. I eventually decided to go with a text-based clock after seeing this image online. I thought it was interesting to see time represented textually rather than in an analog or digital form. 

The most challenging part of this assignment was converting the number of the time into text. I could only convert numbers up to 99, so for milliseconds, the number converted is divided by 10. I figured it didn’t matter as much because the milliseconds are illegible. I also had the size of the text increase based on the time.

Image result for text time clock

Nawon Choi— Looking Outward 06

Composition in Line

Left - Piet Mondrian, Composition in line, second state, 1916-1917. © Collection Kröller-Müller Museum, Otterlo. Courtesy: Collection Kröller-Müller Museum, Otterlo. Right - A. Michael Knoll, Computer Composition With Lines, 1964. Created with an IBM 7094 digital computer and a General Dynamics SC-4020 micro-film plotter. Photo: © A. Michael Knoll
Composition in Line by Piet Mondrian and Computer Composition With Lines by IBM 7094

I found this piece through a really interesting article about how an IBM 7094 computer generated a drawing that was very similar to a painting done by Piet Mondrian. The two images were prompted with this questionnaire—”One of the pictures is of a photograph of a painting by Piet Mondrian while the other is a photograph of a drawing made by an IBM 7094 digital computer. Which of the two do you think was done by a computer?” According to the article, few people, including those who claim to like abstract art, were unable to identify the painting.

I admire the thought and intentions behind this project and how it questions the nature of art, how one was made traditionally, with hours of an artists’ time spent in front of a canvas with oil and paint, while the other was generated by an algorithm, specifically and deliberately designed to emulate Mondrian’s original work. It challenges people’s ideas on what traditional art is, and introduces randomness and computational practices to abstract art.

Nawon Choi— Project 05 Wallpaper

nawon-05

// Nawon Choi
// nawonc@andrew.cmu.edu
// Section C

function setup() {
    createCanvas(440, 540);
    background("white");
    stroke("white");
    for (var y = 0; y < height + 20; y += 110) {
        for (var x = 0; x < width + 20; x += 110) {
            // background triangles
            fill(y/2, x/2, 200);
            triangle(x, y, x, y + 100, x + 50, y + 50);
            fill(y/2, x/2, 180);
            triangle(x, y, x + 100, y, x + 100, y + 100);
            // center circle
            fill(y/2, x/2, 250);
            ellipse(x + 50, y + 50, 25, 25);
            fill(y/2, x/2, 220);
            triangle(x, y + 100, x + 50, y + 50, x + 100, y + 100);
            fill("white");
            ellipse(x + 50, y + 25, 5, 5);
            // bottom triangles
            fill(y/2, x/2, 250);
            triangle(x + 50, y + 50, x, y + 100, x + 33, y + 100);
            fill(y / 3, x / 3, 150);
            triangle(x + 50, y + 50, x + 33, y + 100, x + 66, y + 100);
        }
    }
    noLoop();
}

function draw() {
    // draw is not called due to noLoop() in setup()
}

For this project, I was inspired by geometric shapes, as well as the color gradient that we learned how to code during lab. I tried to create a small landscape image through the composition of my geometric elements. I like the way the that the gradient adds to the wallpaper by the way it alludes to a sunset or sunrise, and the way the colors of the sky change.

I sketched out a couple different ideas that I tested in p5.js, and ultimately decided on one that looked the best compositionally. I found that a lot of the other iterations had too many elements which was overwhelming to the eye.

Idea sketches

Nawon Choi— Looking Outward 05

Cover of “Time Out London”, weekly magazine
“Time Out” by Design Lad https://www.designlad.co.uk/time-out

I really like the way computer graphics were used here in this magazine. The vibrant and playful colors are not just limited to the image, but also extend beyond to the area where text is placed. This enhances the “3-dimensional” concept by the way the graphic elements are placed beyond the edge of the main image.

The artist probably used 3D graphics software to create the models of the image before adding the details and vibrant colors. Typically, there is also a rendering algorithm that makes the image look 3-dimensional.

The artist(s) have a unique style throughout their work, which is also reflected in this work. Their style is playful, colorful, and bold with a consistent smooth 3d texture throughout the images.

Nawon Choi— Project 04 String Art

nawon-project-04

// Nawon Choi
// nawonc@andrew.cmu.edu
// Section C
// Project 04 String Art


var a = 0;
var b = 300;
var c = 400;
var amt = 50;

var r = 500;
var x;
var y;
var x1;
var y1;

function setup() {
    createCanvas(300, 400);
    background("black");
}

function draw() {
    // got help getting the points along a circle: 
    // (lines 27, 32, 33)
    // https://stackoverflow.com/questions/5300938/calculating-the-position-of-points-in-a-circle
    var slice = 2 * PI / amt;
    for (let i = 0; i < amt; i++) {
        // draw lines from points along the circle,
        // to points along the edge of the canvas
        var angle = slice * i;
        x = r * cos(angle) + a;
        y = r * sin(angle) + c;
        stroke("#37393b");
        line(x, y, i * 20, a);
    }

    // green and yellow lines
    for (let i = 0; i < (amt / 2); i++) {
        stroke("green");
        line(a, a, i * 20, c);
        var angle2 = slice * i * 2;
        x1 = r * cos(angle2) + a;
        y1 = r * sin(angle2) + c;
        stroke("yellow");
        line(x1, y1, i * 25, c);
    }

    // make lines that follow the mouse
    stroke("#a3afb5");
    line(b, a, mouseX, mouseY);
}

For this project, I mainly tried to experiment with different ways lines could be drawn. I initially played around with the way lines splay outward from a circle. I amplified this by playing around with the variables, magnifying the size of the circle and having it go off the canvas, creating the gray lines in the background. I added some green and yellow lines to add some visual interest, then added the lighter gray lines to add an interactive element.

Nawon Choi— Looking Outward 04

Cycling Wheel: The Orchestra

“Cycling Wheel” by Keith Lam, Seth Hon and Alex Lai

This performance/installation caught my attention because of the way the artists transformed a non-traditional medium (bicycle wheels and lights) into a work of visual and sonic art.

The artists noted that they took inspiration from Marcel Duchamp’s Bicycle Wheel, an installation piece that originally was made in 1913. I appreciate the way the artists reimagined this piece to be one that is interactive and dynamic. They transformed the mechanics of the wheel to control the light and sound, turning the bicycle wheel into a performative instrument.

Image result for marcel duchamp bicycle wheel
Marcel Duchamp’s “Bicycle Wheel” (1951)

I love the way that the artists incorporated both audio and visual elements into this piece and carefully crafted their performance/installation to highlight both elements. The performance was held at night, with the addition of a smoke machine to enhance the visual experience and also creating stunning photographs and documentation.

According to this article, some of the technical aspects of this installation include, a tailor-made control panel software that was created with an open-source programming language called “Processing” that is used to create animations and interactions. It also has three different units that control the music, light beams, and LED strips.

Below is a video of the performance—

Nawon Choi— Looking Outward-03

3D-Printed Kinematics Dress


3D-printed Kinematics Dress by Shapeways

The 3D-printed kinematics dress stood out to me because the designers took a material and form that is solid and rigid and developed techniques to make it flexible. In doing so, they created a new function for 3d printing. They used algorithms that they’ve previously developed based on biomorphic generativity to create shapes based on the natural principles of the nervous system. The creator’s artistic sensibilities are manifested in the final form in the way that they adapted this initial algorithm, which they used to create rings, and adapted it to create a wearable and flowing dress. The design and shape of the dress, as well as the decision to create a dress, rather than another piece of garment, were all creative decisions that the artist made.

Nawon Choi— Project-03 Dynamic Drawing

nawon-project-3

// Nawon Choi
// Section C
// nawonc@andrew.cmu.edu
// Project-03 Dynamic Drawing

var angle = 0;

function setup() {
    createCanvas(480, 640, WEBGL);
}

function draw() {
    background("#001c2e");

    // revolving objects
    push();
    rotate(radians(angle));
    noStroke();
    fill(250);
    ellipse(150, 150, 20, 20);
    pop();
    angle += 5 * (mouseX * 0.005);

    if (mouseY > 160 & mouseY < 320) {
        push();
        rotateX(radians(angle));
        noStroke();
        fill("purple");
        ellipse(0, 300, 10, 10);
        pop();
        angle += 0.5 * (mouseX * 0.00001);
    } else if (mouseY > 320 & mouseY < 480) {
        push();
        rotateY(radians(angle));
        noStroke();
        fill("green");
        ellipse(200, 0, 15, 15);
        pop();
        angle += 0.5 * (mouseX * 0.00001);
    } else if (mouseY < 160) {
        push();
        rotateY(radians(angle));
        noStroke();
        fill("blue");
        ellipse(200, 0, 20, 20);
        pop();
        angle += 0.5 * (mouseX * 0.00001);
    } else {
        push();
        rotateX(radians(angle));
        noStroke();
        fill("yellow");
        ellipse(0, 300, 10, 10);
        pop();
        angle += 0.5 * (mouseX * 0.00001);
    }

    // from p5.js reference "directionalLight()"
    // https://p5js.org/reference/#/p5/directionalLight
    let dirX = (mouseX / width - 0.5) * 2;
    let dirY = (mouseY / height - 0.5) * 2;

    var colorR = mouseX / 2;
    var colorG = mouseY / 3;

    directionalLight(250, 250, 250, -dirX, -dirY, -1);

    // draw sphere
    noStroke();
    sphere(150, 150);

    rotateX(mouseY * -0.01);
    rotateY(mouseX * -0.01);
    rotateZ(mouseY * 0.01);
    cylinder(200, 10);

    // fill("white");
    // ellipse(5, 5, 10, 10);


}

For this project, I tried to keep it simple and also experiment with elements that I haven’t used before, which are 3D shapes. I originally played around with boxes and light. The directionalLight() function had a really interesting effect, which I thought it would look better on a circular object. I decided to use spheres and cylinders instead, and have the light be controlled by the mouse position. I also added some circles to revolve around the object (speed controlled by mouse) to add to the “planet” look.