![[OLD SEMESTER] 15-104 • Introduction to Computing for Creative Practice](https://courses.ideate.cmu.edu/15-104/f2021/wp-content/uploads/2023/09/stop-banner.png)
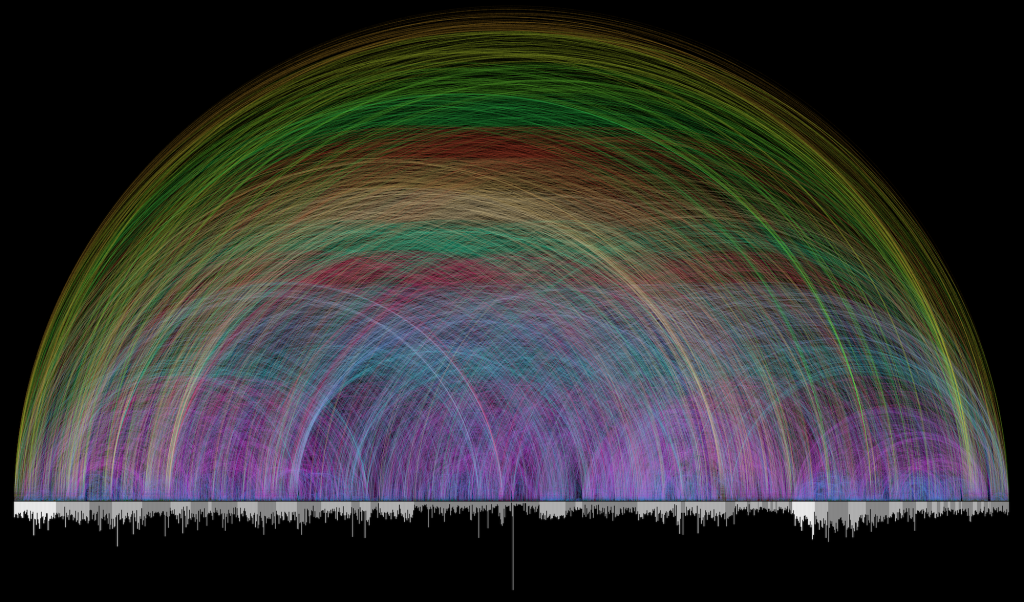
For this week’s LO, I will be talking about a Visualization of the Cross References found in the Bible by Chris Harrison.
Chris Harrison is an Associate Professor of Human-Computer Interaction.
And as the writeup for this week’s LO states, he is here at CMU as well. Some of his work deals with Data Visualization.
This one specifically caught my eye because I am a Christian and with some Bible study under my belt, I am astounded by the references within the Bible. I have also seen this work before, but to now realize that a CMU Professor made this has made me amazed as well. So beyond my own personal beliefs, I just find it beautiful and simplistic in a good way.
As for its creation, a Pastor (Christoph Romhild) and Dr. Harrison began work in 2007. They used the arcs as the connections between chapters (individual bars on the x-axis) that are grouped in alternating light and dark gray sections (they represent books of the Bible). The colors show the length of the connection – with the shortest being dark blue and the longest being what seems to be dark orange. They used the already available 63,000 Cross References and probably separated it by chapter. And using an algorithm(s) of some kind involving the Chapters, created this work.
Overall, I think it is very neat.
Here are links to this specific work, his bio, and other works.