![[OLD SEMESTER] 15-104 • Introduction to Computing for Creative Practice](../../../../wp-content/uploads/2023/09/stop-banner.png)
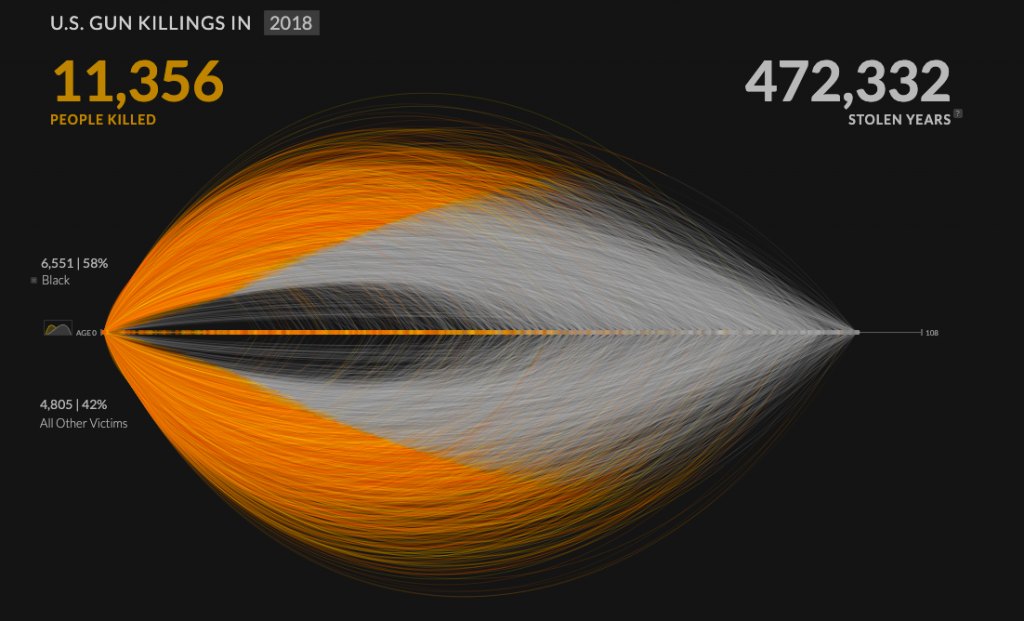
The project I have chosen for this blog post is Kim Rees’s data visualization, “Revealing the overwhelming magnitude of loss from U.S. gun deaths.” This project used data from the FBI’s Uniform Crime Report to map every individual gun murder victim from a given year at once. I find this type of data visualization to be extremely important because it gives a more realistic perspective to viewers who would not otherwise be able to grasp the magnitude of impact by simply looking at the raw numbers. In this project, Rees includes a visualization of what she labels as “Stolen Years”, or the number of years that each murder victim is estimated to have likely lived had they not been shot. The website allows viewers to use filters with can show the proportion of gun murder victims who fall into a specific category or demographic. For example, using the race and age group filters, I am able to see that 433 black children were killed at the hands of gun violence in 2018. As put by Rees, this project reveals “a massive collection of human emotion hidden within rows and rows of numbers.”
Revealing the overwhelming magnitude of loss from U.S. gun deaths, Kim Rees