Project 7: Composition with Curves

sketch

//Elise Chapman
//ejchapma
//ejchapma@andrew.cmu.edu
//Section D

var nPoints = 100; //number of points along the curve
var noiseParam=5;
var noiseStep=0.1;
var petalNum=1; //number of petals on curve
var x; //for points along curve
var y; //for points along curve

function setup() {
    createCanvas(480,480);
    frameRate(10);
}

function draw() {
    background(0);
    //draws the epitrochoid curve
    //Cartesian Parametric Form  [x=f(t), y=g(t)]
    push();
    translate(width/2, height/2);
    var a = 90;
    var b = a/petalNum;
    var h = constrain(mouseY / 8.0, 0, b);
    var ph = mouseX / 50.0;
    fill(mouseY,0,mouseX);
    noStroke();
    beginShape();
    for (var i = 0; i<nPoints+1; i++) {
        var t = map(i, 0, nPoints, 0, TWO_PI); //theta mapped through radians
        //Cartesian Parametric Form  [x=f(t), y=g(t)]
        x = (a + b) * cos(t) - h * cos(ph + t * (a + b) / b);
        y = (a + b) * sin(t) - h * sin(ph + t * (a + b) / b);
        var nX = noise(noiseParam); //noise for x values
        var nY = noise(noiseParam); //noise for y values
        nX=map(mouseX,0,width,0,30);
        nY=map(mouseY,0,height,0,30);
        vertex(x+random(-nX,nX),y+random(-nY,nY));
    }
    endShape(CLOSE)
    pop();
}

//click to increase number of petals on the curve
function mousePressed() {
    petalNum+=1;
    if (petalNum==6) {
        petalNum=1;
    }
}

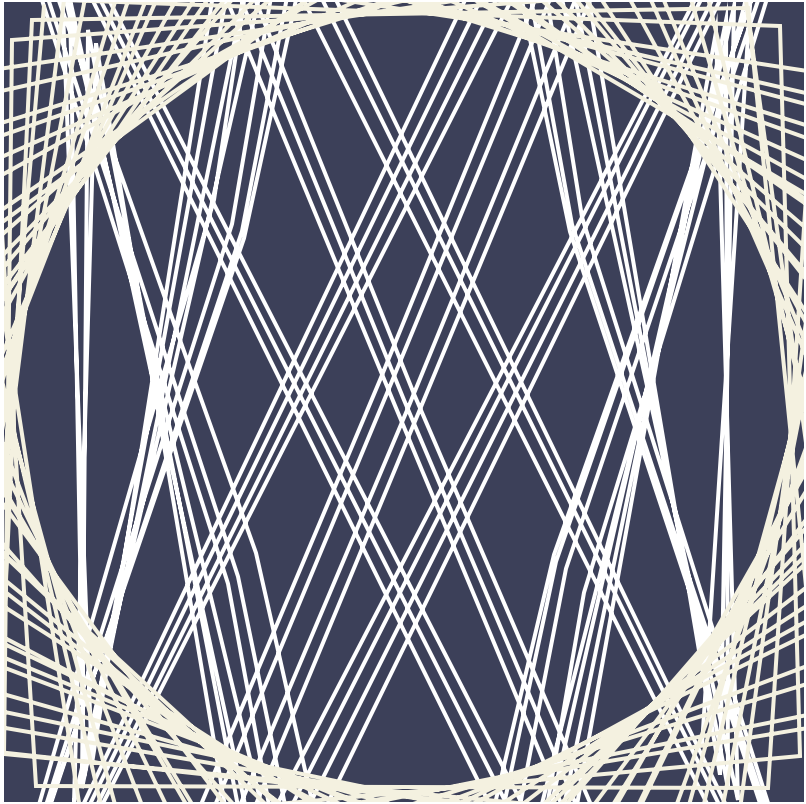
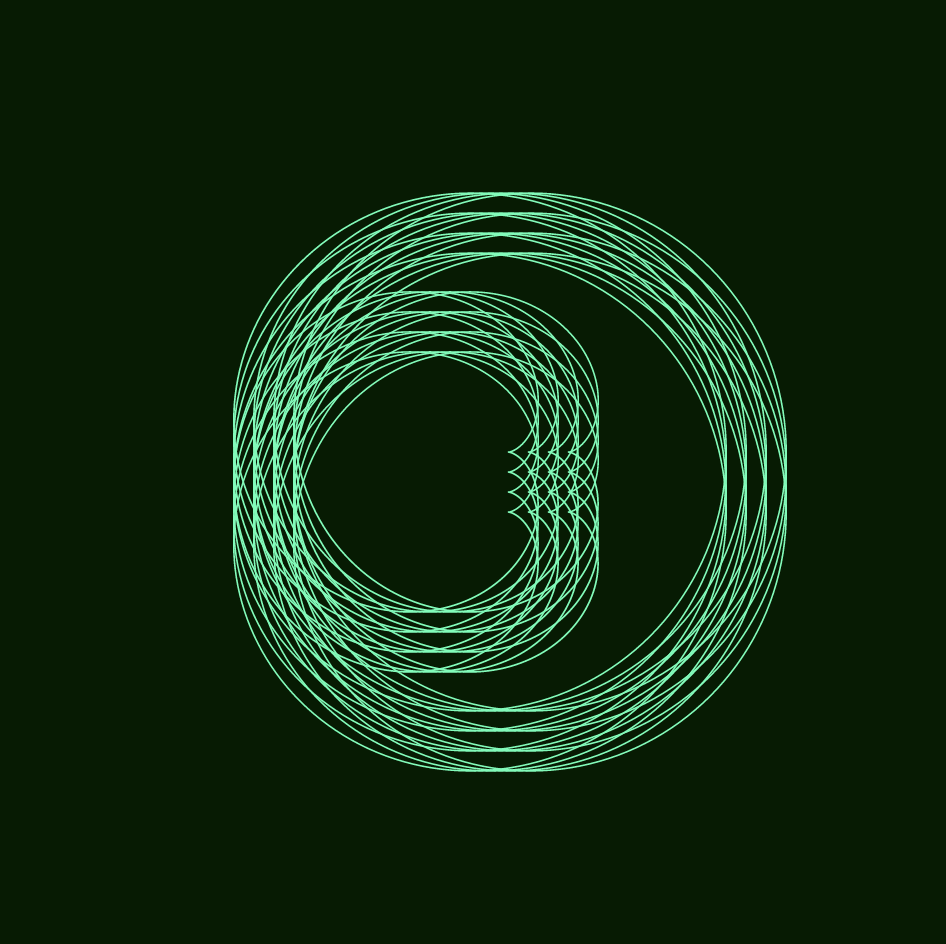
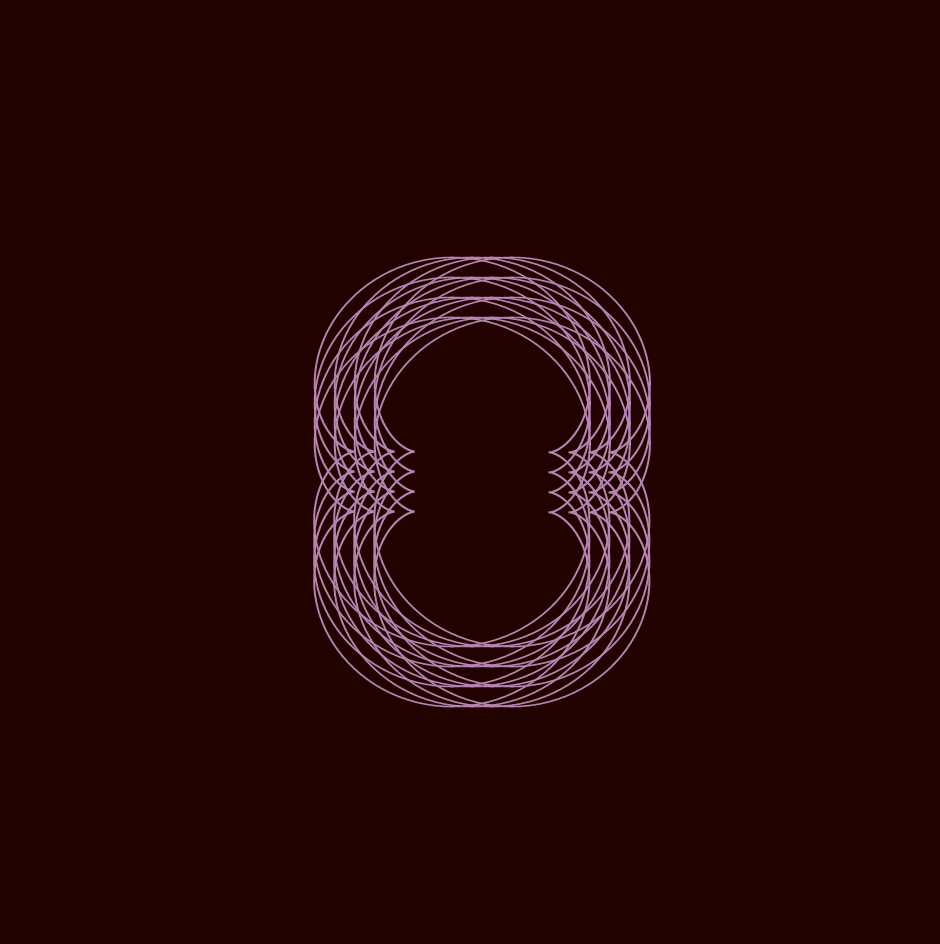
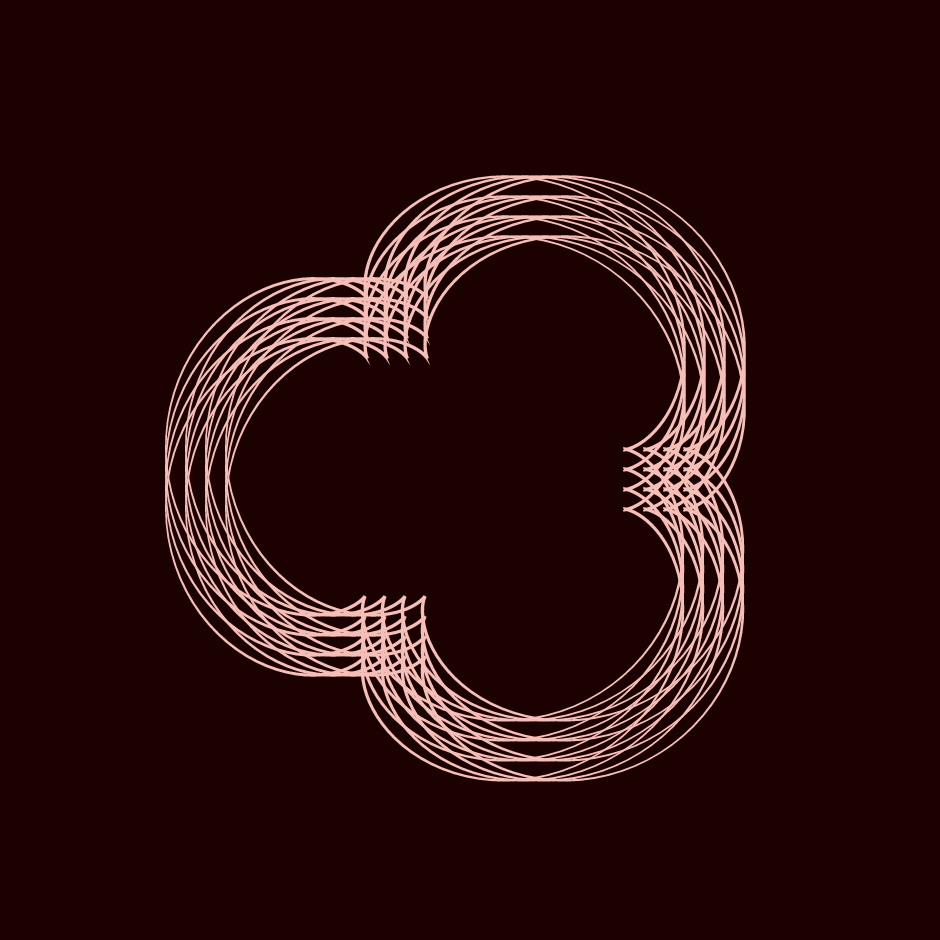
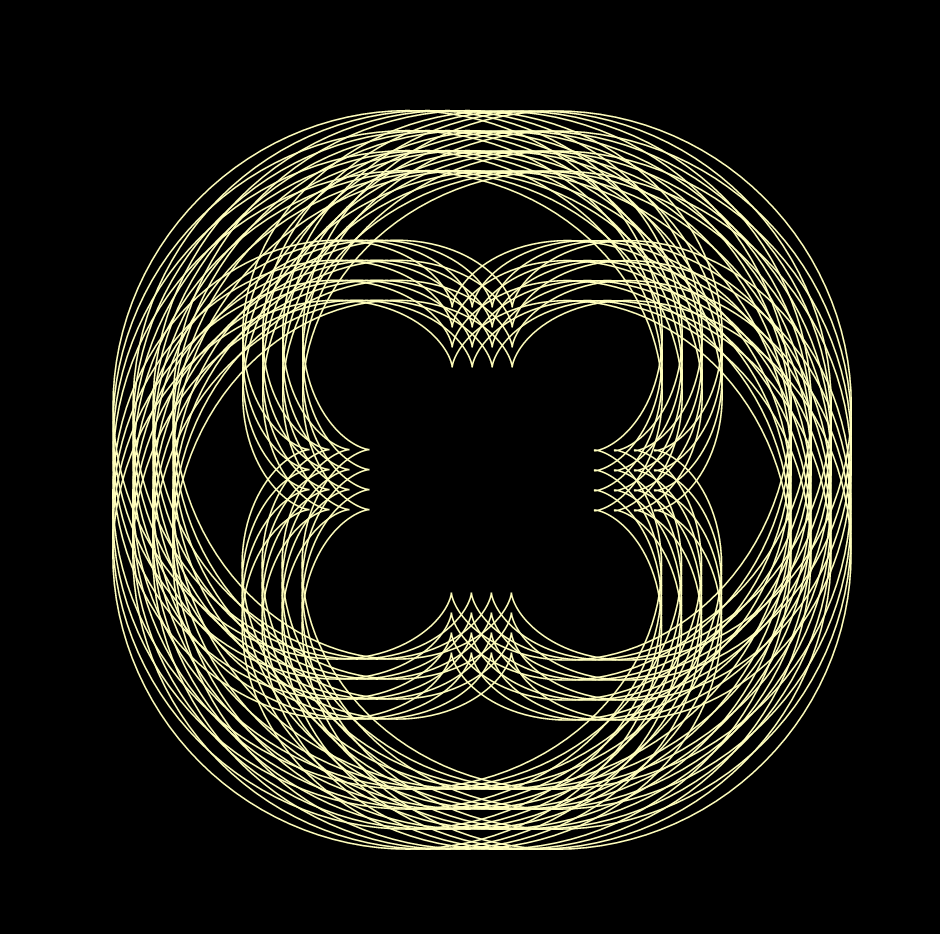
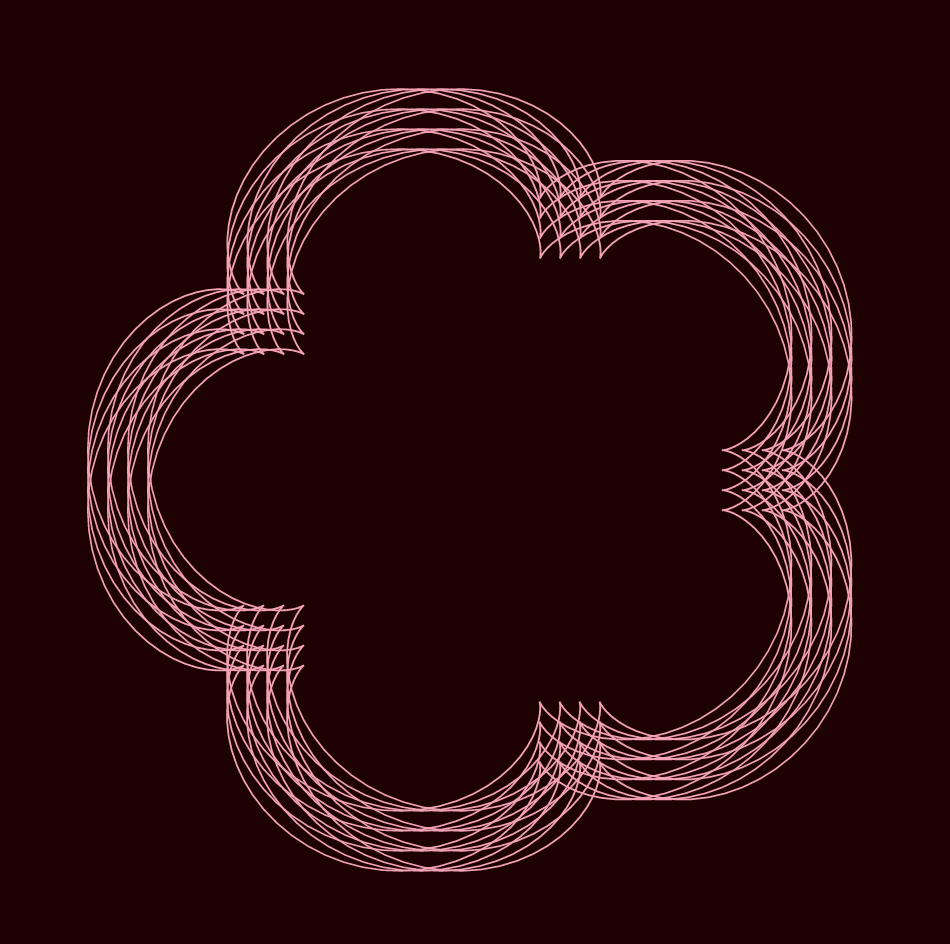
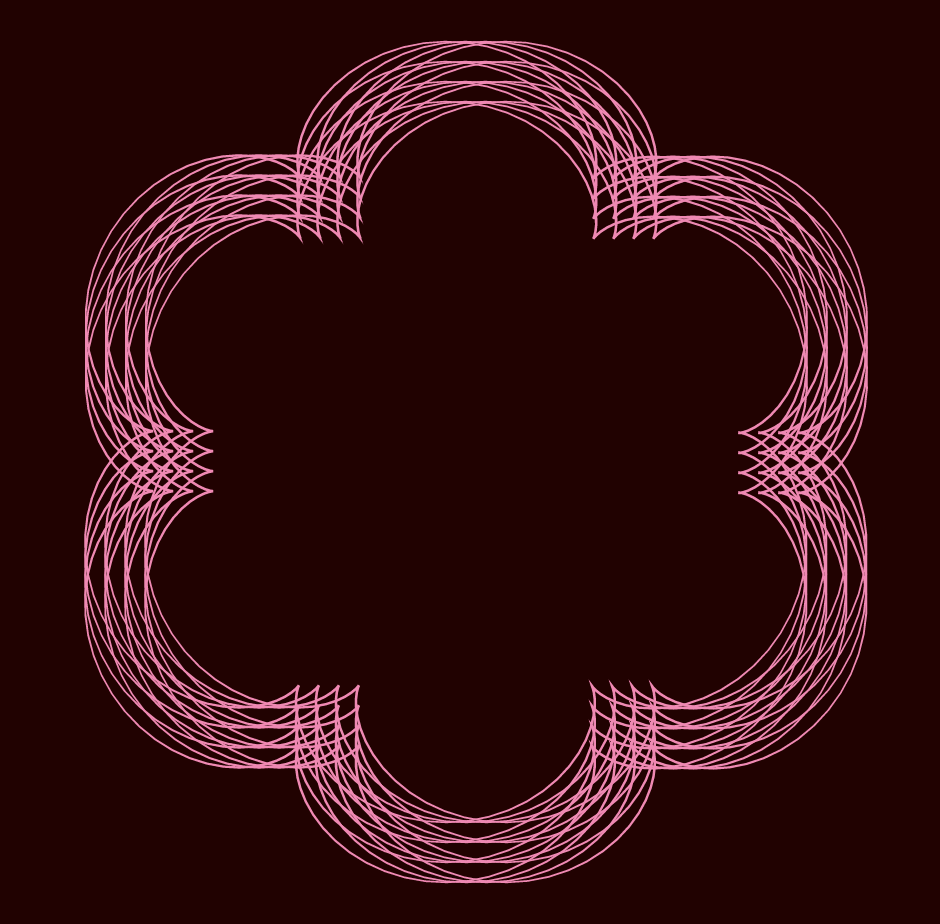
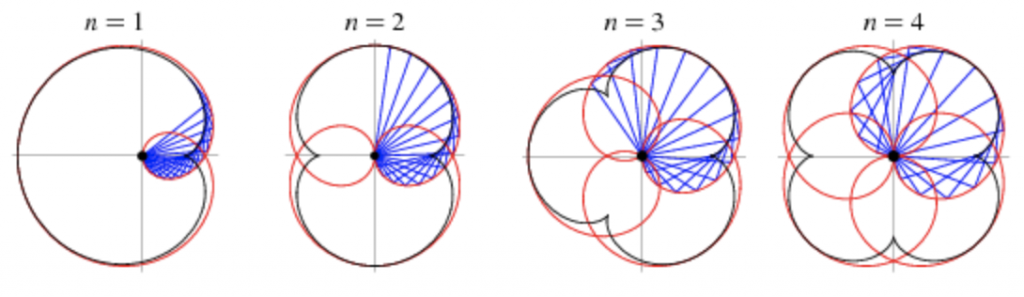
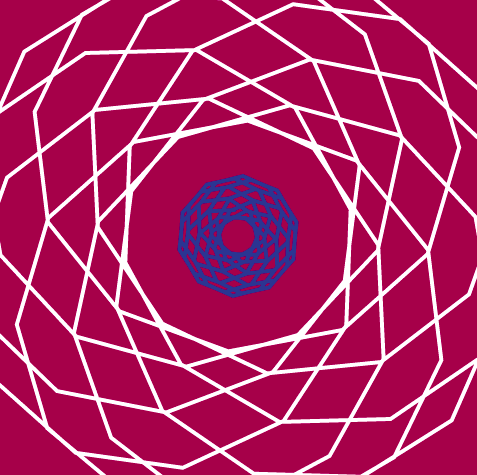
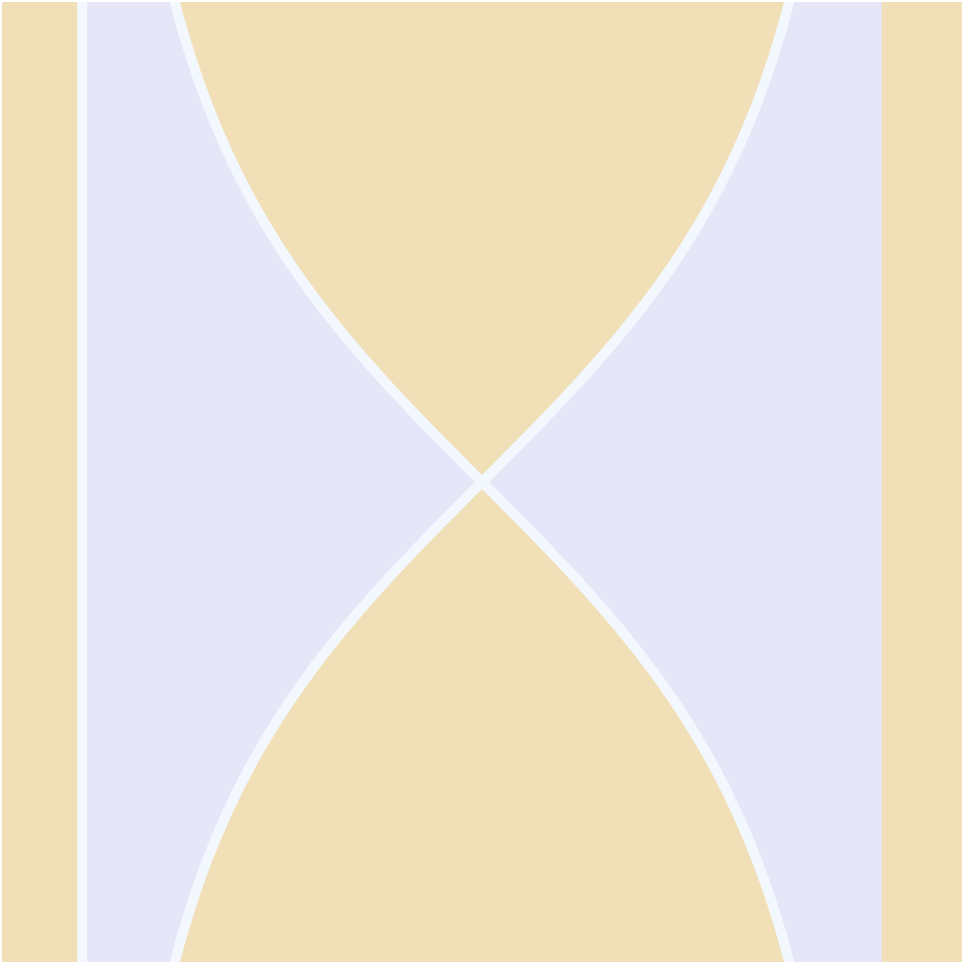
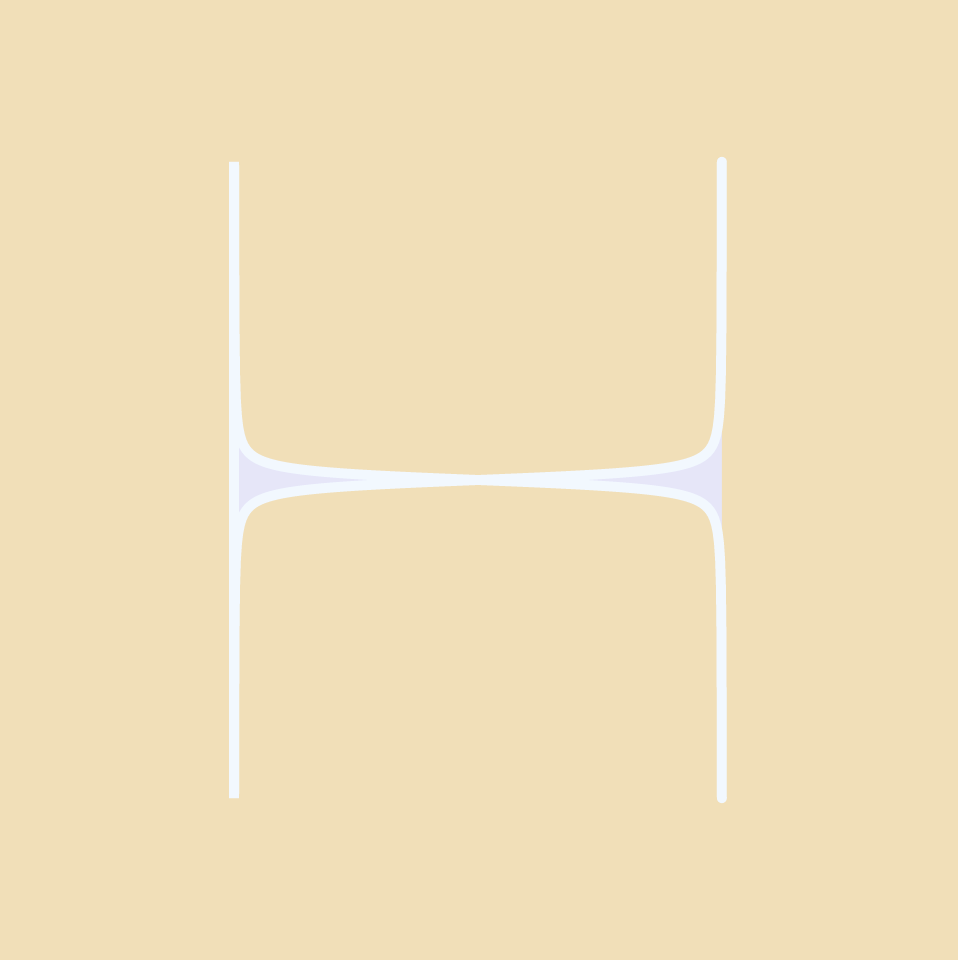
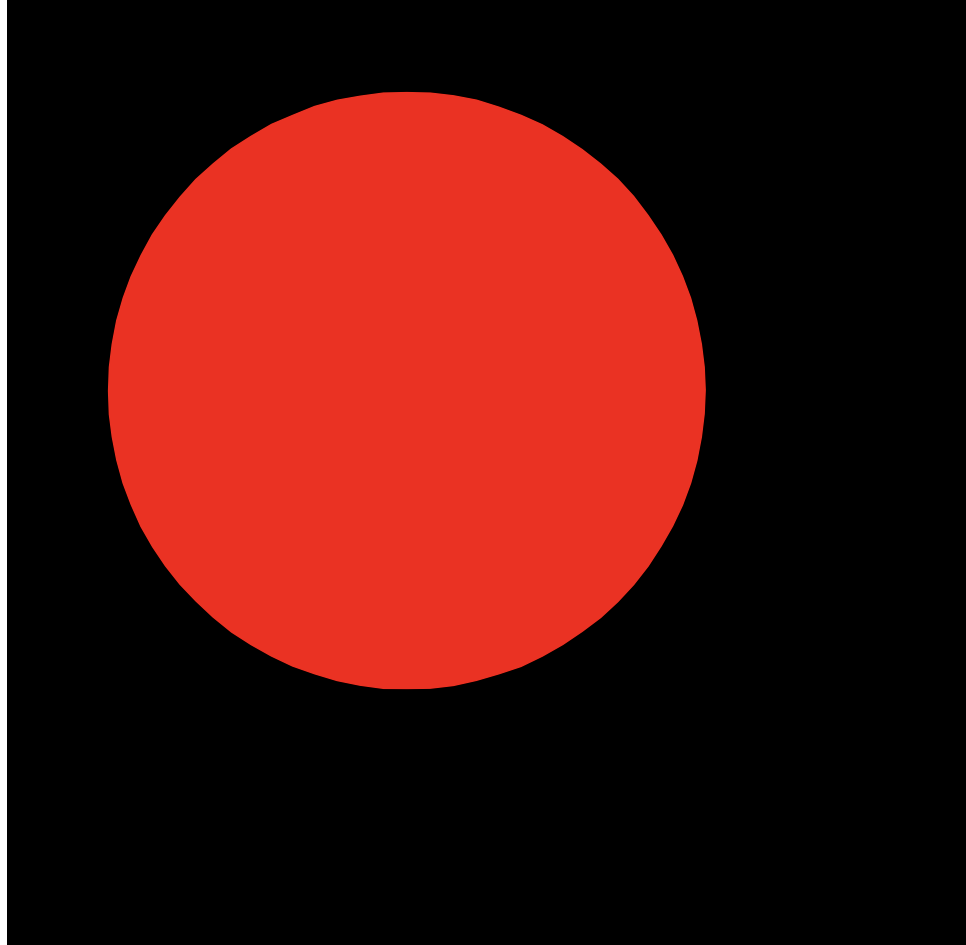
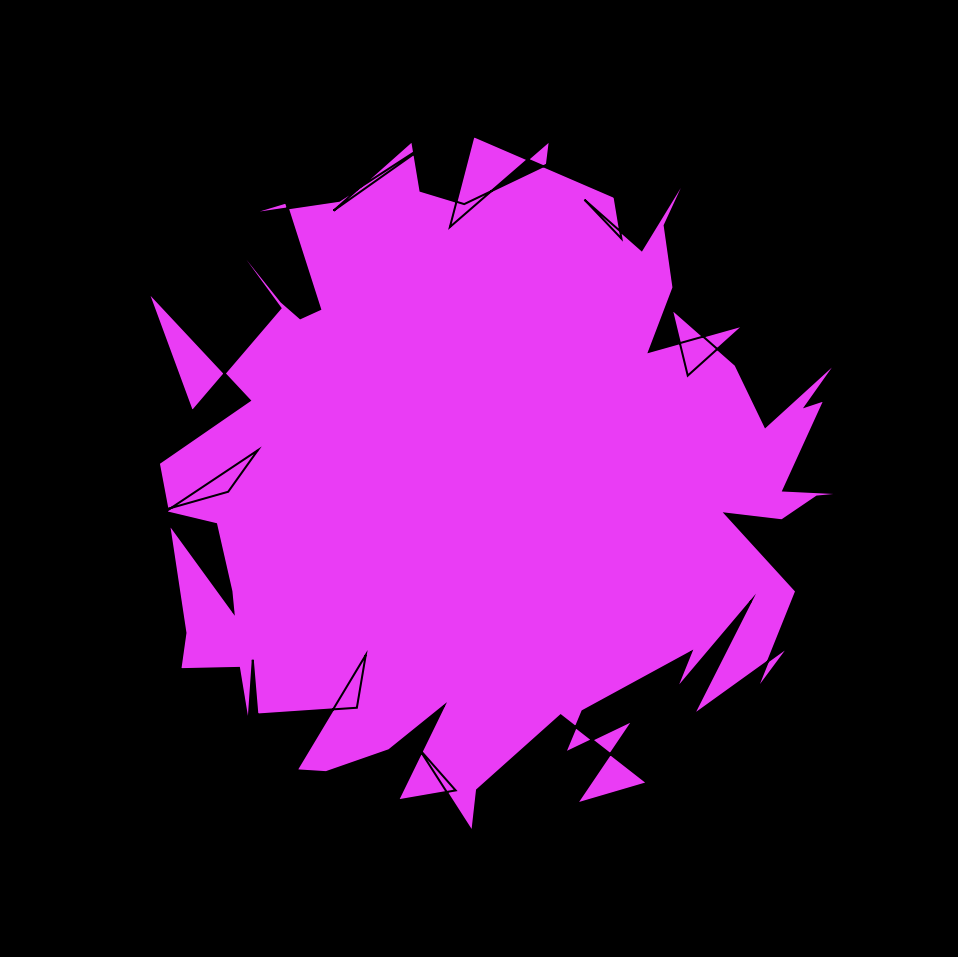
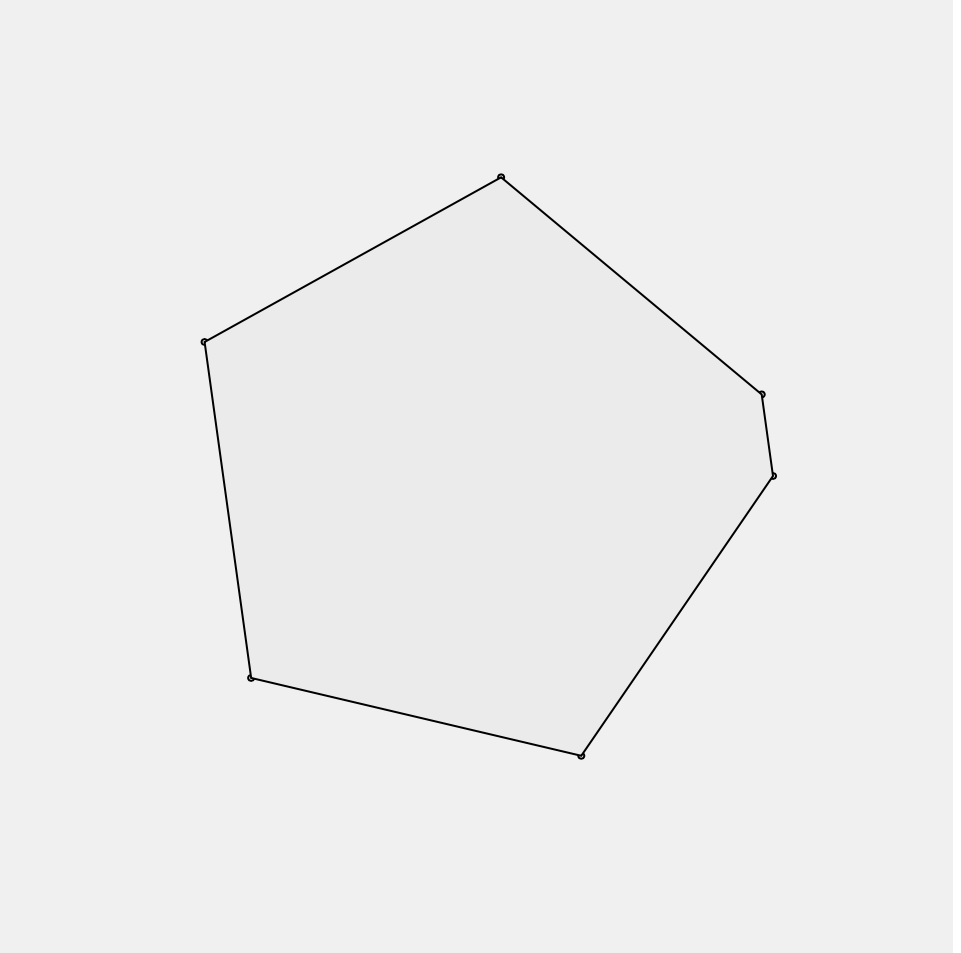
To begin, I liked the movement that was created by Tom’s example epitrochoid curve, so I went to the link he provided on Mathworld and read about the curve. I understood that I could make the petals interactive by adding a click into the program and changing the value of b in the curve equation. So at this point, my program allowed from 1 to 5 petals depending where in the click cycle the user is.

An example of a 3 petal curve

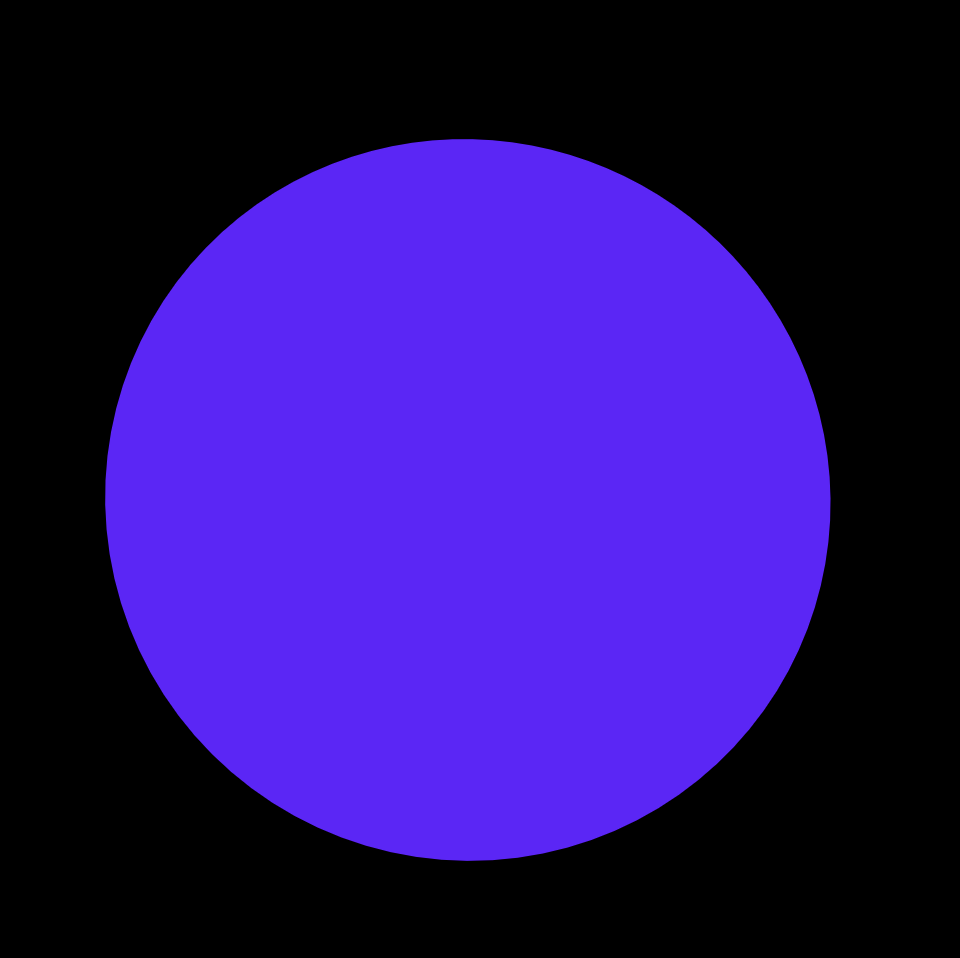
Then, I thought back to one of the previous labs, where we would draw circles with variable red and blue fill values, which I really enjoyed aesthetically. So, I made the blue value variable dependent upon the mouseX value and the red value variable upon the mouse Y value.

High mouseX, low mouse Y
High mouseY, low mouseX

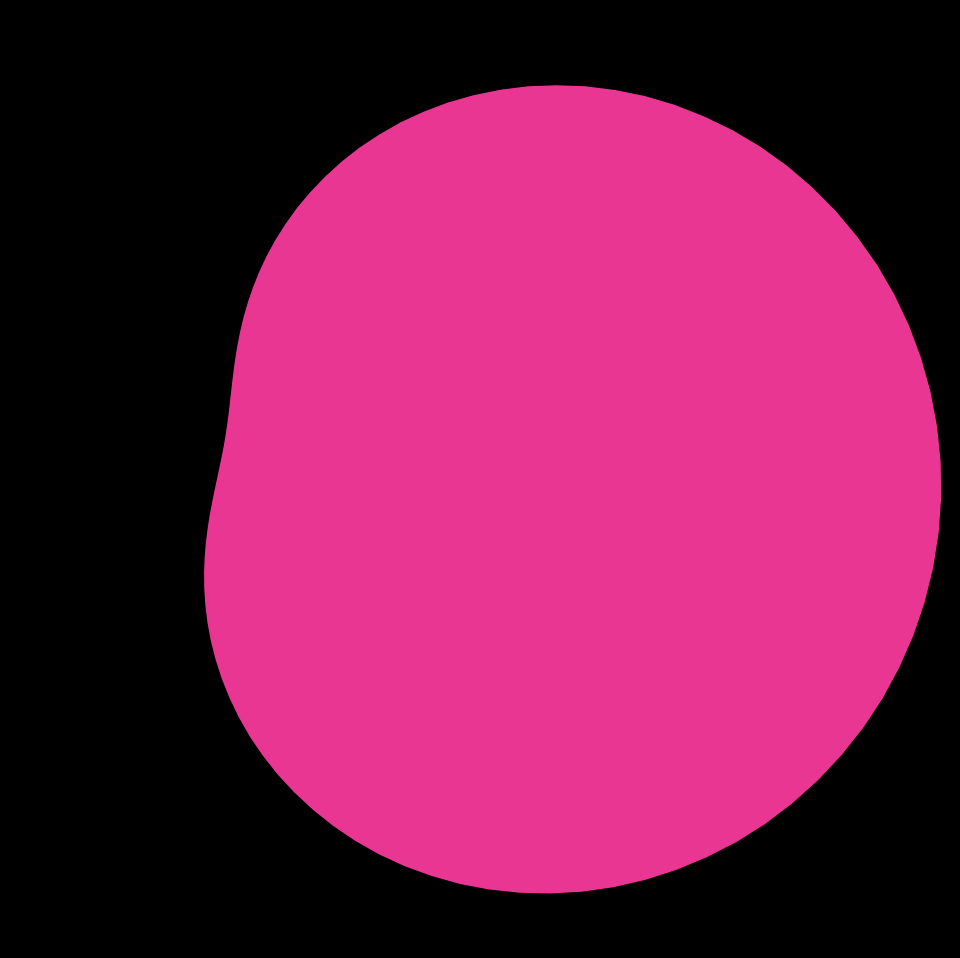
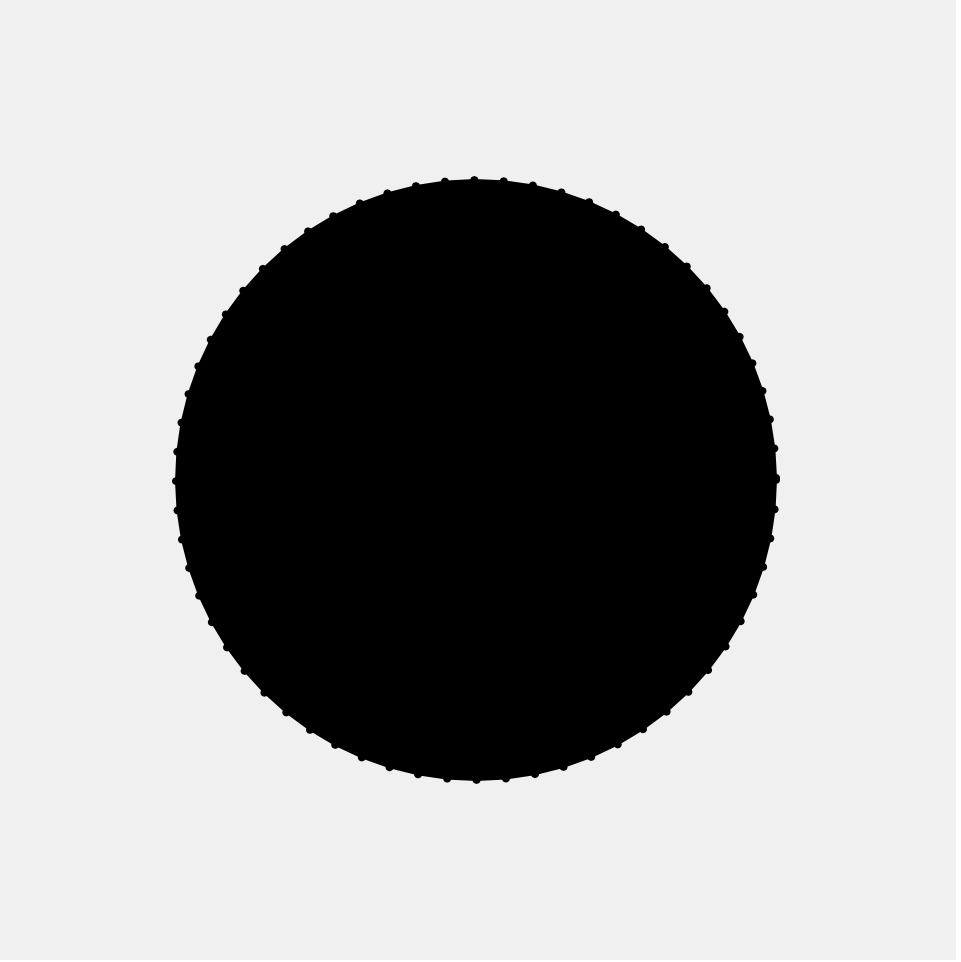
Finally, I really enjoyed the jittery star from the class example from our lecture on Randomness and Noise, so I decided I wanted to add noise. Because the curve is drawn with a series of points, I added noise randomness to each of the points, affecting both the x scale and the Y scale. Overall, I enjoy how the final project came out. I think it would be a cool addition to the header of a website, especially if I’m able to make the background transparent.

An example with all three elements (petal variation, color, and noise) added in

Project 7

sketch

//Michelle Dang
//mtdang@andrew.cmu.edu
//Section D
//07 Project
var a3 = 150;
function setup() {
    createCanvas(400, 400);
    background(220);
}

function draw() {
    background(60, 64, 91);
    cissoid(); //background curve
    astroidpedal1(); //yellow curve
    astroidpedal2(); //green curve

}

function astroidpedal1() {
    beginShape()
    noFill();
    strokeWeight(2);
    stroke(244, 241, 222)
    var a = mouseY;
    for (var i=0; i< 100; i++) {
    var theta = map(i, 0, 100, 0, 150);
    var x = width/2+a * (cos(theta))^3; //parametric equation: x=a*cos^3t
    var y = height/2+a * (sin(theta))^3; //parametric equation: y=a*sin^3t
    vertex(x, y)
    }
    endShape();
}

function astroidpedal2() {
    beginShape()
    noFill();
    stroke(129, 179, 154)
    var a2=mouseX
    for (var i=0; i< 400; i++) {
    var theta = map(i, 0, 400, 0, TWO_PI);
    var x = width/2+a2 * cos(theta)^3; 
    var y = height/2+a2 * sin(theta)^3; 
    vertex(x, y)
    }
     endShape();

}

function cissoid() {
    push();
    beginShape()
    noFill();
    stroke(mouseX, mouseY)
    translate(200,200)
    for (var i=0; i< 80; i++) {
    var theta = map(i, 50, 100, 0, 100);
    var x = 2*a3*sin(theta)^2; //parametric equation: x=a*sin^2t
    var y = (2*a3*sin(theta)^3) / cos(theta) //parametric equation: y=a*cost(t)
    vertex(x, y)
    }
     endShape();
     pop();


}

Project 07: Composition with Curves

sketchDownload


var bgR;
var bgG;
var bgB;
var x;
var y;

function setup() {
    createCanvas(480, 480);
    frameRate(10);
}

function draw() {
    bgR = map(-mouseY, 0, height, 50, 100); //select random background colors
    bgG = map(-mouseX, 0, width, 50, 200);
    bgB = map(-mouseY, 0, height, 0, 100);
    background(bgR, bgG, bgB);
    translate(220, 220);
    for (var c = 1; c < 5; c ++){ //draw the curve
        for (var d = 1; d < 5; d ++){
            push();
            translate(c * 10, d * 10);
            drawEpicycloidPedalCurve(); //reference to link -- https://mathworld.wolfram.com/EpicycloidPedalCurve.html
            pop();
        }
    }
}

function drawEpicycloidPedalCurve() {
    var a = map(mouseX, 0, width, 15, 100); //parameter of the curve moves with the mouse
    var b = map(mouseY, 0, height, 15, 50);
    noFill();
    stroke(mouseX, mouseY, 180);
    strokeWeight(0.8);

    push();
    beginShape(); //draw the curve
    for (var i = 0; i <= 600; i ++) {
        var theta = map(i, 0, 100, 0, PI); 
        x = (a+b)*cos(theta) - b*cos(((a+b)*theta)/b); //epicycloids are given by the parametric equations
        y = (a+b)*sin(theta) - b*sin(((a+b)*theta)/b);
        vertex(x, y);
    }
    endShape();
    pop();
}
The pedal curve of an epicycloid with pedal point at its origin

For this project, I wanted to iterate a flower-like shape using parameter equations so I decided to draw Epicycloid Pedal Curve as the composition. I played with mouseX and mouseY as well as random RGB colors across the canvas so the user has the freedom to explore with unique variations of epicycloid pedal curve patterns.

Project 07 – Composition with Curves

sketch
/* Nami Numoto
 * Section A
 * mnumoto@andrew.cmu.edu
 * Project 07 - Composition with Curves
 */

var nPoints = 100;
var CYCLOID = 0;

function setup() {
    createCanvas(480, 480);
    frameRate(10);
}

function draw() {
    background(0);
    // draw the curve in the middle and iterate 3x
    translate(width / 2, height / 2);
    for (i = 0; i < 3; i ++) {
        drawCycloid();
        rotate(90);
    }
    rotate(mouseX / 50);
}

function drawCycloid() {
    // Cycloid:
    // https://mathworld.wolfram.com/Cycloid.html
    
    var x;
    var y;
    
    var a = constrain(mouseX / 2, 0, 200);
    var b = constrain(mouseY / 2, 0, 200);

    stroke(240, 3, 252);
    noFill();
    beginShape();
    for (var i = 0; i < nPoints; i++) {
        var t = map(i, 0, nPoints, 0, TWO_PI);
        x = a * (t - sin(t));
        y = a * (1 - cos(t));
        vertex(x, y);
    }
    endShape();
}

I had a hard time figuring out the math behind the functions, but well, I guess I ended up getting it in the end. It’s not very fancy, but I iterated a Cycloid function three times to make a sort of 3-way yin&yang, minus the outer circle.

Cycloid function without any transformations
Started constraining x and y to mouseX and mouseY and rotating the canvas with mouseX
3 iterations with aforementioned constraints and transformations

Project 07

sketch

//Tim Nelson-Pyne
//tnelsonp@andrew.cmu.edu
//Section C
//Project-07-Composition With Curves

//size of hypocycloid
var a;
//number of cusps in the hypocycloid
var n;
//x coordinate of points on graph
var x;
//y coordinate of points on graph
var y;
//total number of points to generate
var nPoints;

function setup() {
  createCanvas(480, 480);
  background(0);
  nPoints = 1000;

  
}

function drawHypocycloid (a, n) {
  push();
  translate(240, 240);
  stroke(255, 0, 0);
  strokeWeight(0.2);
  //changes the fill color based on mouseX
  fill(map(mouseX, 0, 480, 0, 255), 0, map(mouseX, 0, 480, 0, 255));
  

  for (var i = 0; i <= nPoints; i++) {
    t = map(i, 0, 1000, radians(0), radians(13 * 360))
    //equation for x value of hypocycloid
    x = (a/n) * ((n-1) * cos(t) - cos((n-1)*t));
    //equation for y value of hypocycloid
    y = (a/n) * ((n-1) * sin(t) - sin((n-1)*t));
    //draws hypocycloid using elipses centered at points along the graph
    ellipse(x, y, map(abs(x), 0, 240, 0, 25), map(abs(y), 0, 240, 0, 25));
    
  }
  pop();
}

function draw() {
  background(0);
  //sets a based on mouseY
  a = map(mouseY, 0, 480, 20, 100);
  //sets n based on mouseX for first shape
  n = map(mouseX, 0, 480, HALF_PI, 5);
  //draw first shape
  drawHypocycloid(a, n);
  //sets n based on mouseX for second shape
  n = map(mouseX, 0, 480, -10, -HALF_PI);
  //draw second shape
  drawHypocycloid(a, n);

  
}

I created an interactive visualization of multiple hypocycloids.

Curves

I really like the dichotomy in this project between calm and chaos. I wanted a pretty simple curve(s) on a plain background that change from very simple and still to complex and chaotic. I set the colors to make it seem like a star or spreading entropy or something. I hope you enjoy!!

sketch
var nPoints = 100;

function setup() {
    createCanvas(400, 400);
    frameRate(10);
}


function draw() {
    background(255);

    // draw the frame
    fill(0);
    noStroke();
    stroke(0);
    noFill();

    // draw the curve
    push();
    translate(width / 2, height / 2);
    drawCurve();
    pop();
}

//--------------------------------------------------
function drawCurve() {
    // Hypotrochoid
    // https://mathworld.wolfram.com/Hypotrochoid.html

    var x;
    var y;

    var a = constrain(map(mouseX, 0, width, 50, 150), 50, 150);
    var b = a / constrain(map(mouseX, 10, width-10, 1, 8), 1, 8);
    var h = b;
    var ph = mouseX / 50.0;

    var n = 12;

    for (var j = 0; j < n; j++) {
        var c = map(j, 0, n, 0, 256);
        stroke(256-c,114,c);
        beginShape();
        for (var i = 0; i < nPoints; i++) {
            var t = map(i, 0, nPoints, 0, TWO_PI);
            var r = map(mouseY, 0, height, 0, 5)

            x = (j/n)*(a - b) * cos(t) + (j/n)*h * cos(ph + t * (a - b) / b);
            y = (j/n)*(a - b) * sin(t) - (j/n)*h * sin(ph + t * (a + b) / b);
            vertex(x + random(-r,r), y + random(-r,r));
        }
        endShape(CLOSE);
    }

}

Project 07: Composition with Curves

project 07 sketch copy

var nPoints = 100;

function setup() {
	createCanvas(480, 480);
}

function draw() {
	background(153,0,76);
	
	//centered in the middle of the canvas 
	translate(240, 240);
	rotate(mouseX/50);
	
	//drawing the functions created 
	strokeWeight(4);
	noFill();
	stroke(255);
	drawHypotrochoidCurve();
	stroke(40,63,141);
	drawEpitrochoidCurve();
}

//Hypotrochoid Curve
function drawHypotrochoidCurve() {

	var x;
	var y;
	var a = map(mouseX, 0, width, 0, 100);
	var b = a / 10;
	var h = constrain(mouseY, 0, height, 0, 250);

	//curve formula
	beginShape();
	for (var j = 0; j < nPoints; j ++) {
		  var t = map(j, 0, nPoints, 0, TWO_PI);
		  x = (a - b) * cos(t) + h * cos(((a - b) / b) * t);
		  y = (a - b) * sin(t) - h * sin(((a - b) / b) * t);
		  vertex(x, y);
	}
	endShape();
} 

//Epitrochoid Curve
function drawEpitrochoidCurve() {

	var x;
	var y;
	var a = map(mouseX/5, 0, width, 0, 100);
	var b = a / 10;
	var h = constrain(mouseY/5, 0, height, 0, 250);

	//curve formula 
	beginShape();
	for (var j = 0; j < nPoints; j ++) {
		  var t = map(j, 0, nPoints, 0, TWO_PI);
		  x = (a + b) * cos(t) - h * cos(((a + b) / b) * t);
		  y = (a + b) * sin(t) - h * sin(((a + b) / b) * t);
		  vertex(x, y);
	}
	endShape();
}

I enjoyed the straightforward nature of this assignment. For the two curves I chose, the Mathworld website provided clear formulas to use. It was interesting to play around with the constrain and map functions and see how the alterations of my curves changed as I, for instance, divided the width by 10 or multiplied the mouseX by 5. I also added in some rotation. In the project, as you move the mouse from left to right, the curves become more compressed. As you change the mouseY value, the curves become smaller and change in shape. I wanted to have the curves look smooth at some points (such that they look like two squiggly lines) and then more angular at other positions.

This is what the curves look like when the mouse is in the upper right hand corner.
This is what the curves look like when the mouse is in the middle right side.

Project 7: Composition with curves

sketch

// Yash Mittal
// Section D

nPoints = 100;

function setup() {
    createCanvas(480, 480);
    frameRate (7);
}


function drawLemniscateCurve () { // coding the curve

    var x;
    var y;

    var a = 180;
    var h = mouseX; // X axis interaction
    var w = map (mouseY, 0, 480, 0, 240) // Y axis interaction

    stroke (205, 0, 11);
    strokeWeight (5);
    fill (255);

    beginShape ();

    for (var i = 0; i < nPoints; i = i + 1) {

        var t = map (i, 0, nPoints, 0, TWO_PI);

        x = (a * cos (t + w)) / (1 + pow(sin (t), 2)); // iterating x
        y = (a * sin (t + h)) * (cos (t)) / (1 + pow(sin (t), 2)); // iterating y

        vertex (x + w / 3, y + h / 3);
    }

    endShape (CLOSE);
}

function draw() { 

    background (0);

    push ();
    translate (width / 2, height / 2);
    drawLemniscateCurve ();


    }

After I chose my curve, I realized that it somewhat looks like Spiderman’s eyes from into the spider-verse and I wanted to experiment more with that so I tried to iterate different eyes based on the X and Y location of the mouse. I struggled with drawing the curve at first but once I understood the concept, iterating became pretty easy.

Project-07: Composition with Curves

Composition CurvesDownload
/*Name:Camellia(Siyun) Wang; 
Section: C; 
Email Address: siyunw@andrew.cmu.edu;*/


function setup() {
    createCanvas(480, 480);

    nPoints = 100;
}


function draw() {
    background(245,222,179);
    push();
    translate(width / 2, height / 2);
    drawBulletnose();
    pop();
}

function drawBulletnose(){
    var x;
    var y;
    var a = constrain(mouseX / 2,0,200);
    var b = constrain(mouseY / 2,0,200);

    stroke(240,248,255);
    strokeWeight(5);
    fill(230,230,250);
    beginShape();
    for(var i = 1; i < nPoints; i++){
        var t  = map(i,0,nPoints,0,PI);
        //Bullet Nose
        x = a * cos(t);
        y = b * (1/tan(t));
        vertex(x,y);
    }
    for(var i = 1; i < nPoints; i++){
        var t  = map(i,0,nPoints,0,PI);
        //Bullet Nose
        x = -a * cos(t);
        y = b * (1/tan(t));
        vertex(x,y);
    }
    endShape();


}
   

When doing this assignment, I first browse through the given curve website to see which curve I am most interested in and can possibly create variation in it. When I chose to do the Bullet Nose, I looked at its x and y equation, then realized that to create variation of this form, I need to change t, a, and b. That’s why in my code, I defined a and b first in the draw function, and then defined t in the for loop to draw the shape. Then I set the a and b to be manipulated by mouseX and mouseY.

Bullet Nose 1: Largest MouseX and mouseY
Bullet Nose 2: mouseX smaller, mouseY smaller

Project 7: Curves

wpf-curves.js
//Patrick Fisher, Section B, wpf@andrew.cmu.edu Assignment -07-project
var functionState = 1;
function setup() {
    createCanvas(480, 480);
    frameRate(10);
}

function draw() {
    var nPoints = 80;
    var radius = 150;
    var separation = 120;

    if(functionState == 1){ //glitchy circle
        background(0);
        fill(255, 255, 255, 64);
        var mouseXincrease = map(mouseX,0,width,-40,40);
        var mouseYincrease = map(mouseY,0,height,-40,40);
        var colorXY = map(mouseX + mouseY,0,960,0,255);
    
        push();
    
        translate(2*separation, height / 2);
        fill(255,0,colorXY);
        beginShape();
        for (var i = 0; i < nPoints; i++) {
            var theta = map(i, 0, nPoints, 0, TWO_PI);
            var px = radius * cos(theta);
            var py = radius * sin(theta);
            vertex(px + random(-40, mouseXincrease), py + random(-40, mouseYincrease));
        }
        endShape(CLOSE);
        pop();
    } 

    else if(functionState == 2) {
        var mouseXpoints = map(mouseX,0,width/2,1,30);
        var oppoY = map(mouseY,0,width,255,0);

        background(240);
        push();
        fill(oppoY)
        translate(2*separation, height / 2);
        beginShape();
        for (var i = 0; i < mouseXpoints; i++) {
            var theta = map(i, 0, mouseXpoints, 0, TWO_PI);
            var px = radius * cos(theta);
            var py = radius * sin(theta);
            vertex(px,py); 
            ellipse(px, py, 3,3);
        }
        endShape(CLOSE);
        pop();
    }    
}

function mousePressed(){
    if(functionState ==1){
        functionState = 2;
    } else if(functionState ==2){
        functionState = 1;
    }
}

I am very conflicted on the result of this project. I had a major lack of inspiration when it came to ideas, so I ended up taking some of the shapes shown in the sample and playing around a bit with them. I had difficulty with some of my map functions as they were not working as I had intended for some reason. However, I do like in the end what I came up with. The circle getting more and more glitchy is really fun and I really love how the vertices of the second circle spring out of the original one like a clown car.