![[OLD SEMESTER] 15-104 • Introduction to Computing for Creative Practice](../../wp-content/uploads/2023/09/stop-banner.png)
var x= 30;
var xPos = 0;
var y = 60
var r = [55, 98, 145, 195] //radius of visualization 1
var angle =10
var cycle = 1; //cycle through the different visualizations
var transparent =100 //used for key
var value = 0
var yr = 1980

//precipitation data
var precip1 = [39.46, 37.5, 32.01, 41.41, 35.32, 38.51, 37.4, 39.2,
            27.09, 42.51]

var precip2 = [52.24, 32.02, 36.65, 38.26, 41.34, 28.89, 45.47, 34.21,
            36.21, 40.12]

var precip3 = [35.73, 32.33, 41.04, 57.41, 41.23, 34.90,40.70, 39.69, 32.84,
            37.85]

var precip4 = [44.24, 41.74, 36.65, 36.84, 40.56, 35.01, 42.15, 57.83, 52.46, 39.33]
//used for text in vizualization 1
precipData = [39.46, 37.5, 32.01, 41.41, 35.32, 38.51, 37.4, 39.2,
            27.09, 42.51, 52.24, 32.02, 36.65, 38.26, 41.34, 28.89, 45.47, 34.21,
            36.21, 40.12,35.73, 32.33, 41.04, 57.41, 41.23, 34.90,40.70, 39.69, 32.84,
            37.85, 44.24, 41.74, 36.65, 36.84, 40.56, 35.01, 42.15, 57.83, 52.46, 39.33]

var precipitation = []
var precipitation2 = []
var precipitation3 = []
var precipitation4 = []

//temperature data
var temp = [49.5, 49.1, 50.4, 50.5, 50.4, 50.6, 51.7, 52.3, 51.0, 50.2, 53.3, 54.2, 50.9,
            51.8, 51.6, 51.8, 50.3, 50, 54, 52, 50.8, 52.2, 52.6, 50.3, 51.6, 51.6, 52.3,
            52, 50.9, 51, 51.9, 52.8, 54.2, 51.5, 50, 52.5, 54.2, 53.6, 52.3, 52.4, 53.3 ]

//images
var skyline;
var backdrop;
var buildings;

var snow = []

function preload() {
    skyline = loadImage("https://i.imgur.com/U7UJvXu.png")
    backdrop = loadImage("https://i.imgur.com/vShIEDi.png")
    buildings = loadImage("https://i.imgur.com/dfPYkth.png")
}

function setup() {
    createCanvas(480, 480);
    background(220);

     for (var i = 0; i < 10; i++) {
        precipitation[i] = new Object();
        precipitation[i].x = r[0] * sin(angle);
        precipitation[i].y = r[0] * cos(angle);
    }

    for (var i = 0; i < 10; i++) {
        precipitation2[i] = new Object();
        precipitation2[i].x = r[1] * sin(angle);
        precipitation2[i].y = r[1] * cos(angle);
    }

     for (var i = 0; i < 10; i++) {
        precipitation3[i] = new Object();
        precipitation3[i].x = r[2] * sin(angle);
        precipitation3[i].y = r[2] * cos(angle);
    }

     for (var i = 0; i < 10; i++) {
        precipitation4[i] = new Object();
        precipitation4[i].x = r[3] * sin(angle);
        precipitation4[i].y = r[3] * cos(angle);
    }

       for (var i = 0; i < 500; i++) {
        snow[i] = new Object();
        snow[i].x = random(30, width-30)
        snow[i].y = random(60, 300)
        snow[i].dy = 1;
    }

}

function draw() { //cycles through the different climate patterns
    if (cycle == 1) {
        introduction()
    } else if (cycle == 2) {
        drawPrecipitation()
    } else if (cycle ==3) {
        drawTemp()
    } else if (cycle == 4) {
        drawSnowRecord()
    } else {
         cycle = 1
    }
}
function introduction() { //first slide
    background(0)
    fill(255)
    textSize(15)
    text("Data Visualizations on Climate Patterns in Pittsburgh", 10, height/2)
    textSize(12)
    text("Click mouse to change data", 10, height/2+20)
}
function drawPrecipitation() {
    background(255, 229, 227)
    fill(0)
    textSize(15)
    text("Average Precipitation in Pittsburgh (1980-2020)", 10, 25)
    frameRate(int(1.5))
    noStroke()

//bottom left key
    fill(214, 132, 84, 100)
    rect(10, 420, 30, 10)

    fill(214, 132, 84, 100-15)
    rect(10, 431, 30, 10)

    fill(214, 132, 84, 100-30)
    rect(10, 442, 30, 10)

    fill(214, 132, 84, 100-45)
    rect(10, 453, 30, 10)

    textSize(8)
    fill(0)
    text("1980-1990", 45, 427)
    text("1990-2000", 45, 427+11)
    text("2000-2010", 45, 427+22)
    text("2010-2020", 45, 427+33)

    translate(width/2, height/2+15)

    fill(214, 132, 84, 60)
    noStroke()
    circle(0, 0, 150)
    circle(0, 0, 240)
    circle(0, 0, 337)
    circle(0, 0, 440)
    fill(214, 132, 84, 50)
    circle(0, 0, 70)


//ring of ellipses
    for (var i=0; i<precip1.length; i++) {
        noStroke()
        fill(0, 255-precip1[i]*3, precip1[i]*4)
        rotate(radians(360/10))
        circle(precipitation[i].x, precipitation[i].y, precip1[i]/1.4)
    }

      for (var i=0; i<precip2.length; i++) {
        var x = r[1] * sin(angle);
        var y = r[1] * cos(angle);
        noStroke()
        fill(0, 255-precip2[i]*3, precip2[i]*4)
        rotate(radians(360/10))
        circle(precipitation2[i].x, precipitation2[i].y, precip2[i]/1.4) //change to object
    }

      for (var i=0; i<precip3.length; i++) {
        var x = r[2] * sin(angle);
        var y = r[2] * cos(angle);
        noStroke()
        fill(0, 255-precip3[i]*3, precip3[i]*4)
        rotate(radians(360/10))
        circle(precipitation3[i].x, precipitation3[i].y, precip3[i]/1.4)
    }

      for (var i=0; i<precip4.length; i++) {
        var x = r[3] * sin(angle);
        var y = r[3] * cos(angle);
        noStroke()
        fill(0, 255-precip4[i]*3, precip4[i]*4)
        rotate(radians(360/10))
        circle(precipitation4[i].x, precipitation4[i].y, precip4[i]/1.4)
    }


    textSize(10)
    text(precipData[value], -10, 10)
    value+=1

    if (value>40) {
        value=0
    }
    textSize(15)
    text(yr, -15, 0)
    yr+=1

    if (yr >2020) {
        yr=1980
    }
}


function drawTemp() {
    background(235, 88, 52)
    textSize(15)
    fill(0)
    text("Average Temperature in Pittsburgh (1980-2020)", 10, 25)
    frameRate(25)

    translate(width/2,height/2)
    //background circles
    fill(255, 255, 255, 70)
    circle(0, 0, 400, 400)
    fill(235, 88, 52)
    circle(0, 0, 150, 150)
    //rotating circle data
    for (var i =0; i<temp.length; i++) {
        rotate(radians(angle))
        // xPos=(300/2 * cos(temp[i]))
        fill(temp[i]*3,0,0, 80)
        circle(xPos, 100, temp[i]/2)
        angle+=.01
    }
}


function drawSnowRecord() {
    background(10,31,50)
    fill(255)
    text("Greatest Snowfall in One Day in Pittsburgh", 10, 25)
    push()
    textSize(10)
    text("Hover over the snowballs", 10, 40)
    pop()

    image(backdrop, 20, 92)
    circle(420, 290, 60)
    image(skyline, 30, 150)
    fill(250, 250, 250)
    circle(260, 300, 40)
    circle(150, 305, 30)
    image(buildings, 30, 272)
    circle(80, 300, 50)
    circle(330, 290, 80)
    pop()
    //data appears when hovering over snowballs

      if ((dist(330, 290, mouseX, mouseY) < 80/2)) {
        text("March 13, 1993: 23.6 inches of snow", 130, 400)
    }

      if ((dist(420, 290, mouseX, mouseY) < 60/2)) {
        text("December 17, 1890: 22 inches of snow", 130, 400)
    }

      if ((dist(80, 300, mouseX, mouseY) < 50/2)) {
        text("January 8, 1884: 16.5 inches of snow", 130, 400)
    }

      if ((dist(260, 300, mouseX, mouseY) < 40/2)) {
        text("March 3, 1942: 16.3 inches of snow", 130, 400)
    }

      if ((dist(150, 305, mouseX, mouseY) < 30/2)) {
        text("March 5, 1902: 15 inches of snow", 130, 400)
    }
    //snow
      for (var i=0; i<500; i++) {
        noStroke()
        fill(255)
        circle(snow[i].x, snow[i].y, 2)
    }


}


function mousePressed() { //changes visualzation when mouse clicked
    cycle += 1;
}
Author: Po
Project11
//Michelle Dang
//mtdang
//Section D
var cloud = [];

var water = [];
var offset = 0;

mountain = [];
var inc = 0.01;
var xoff = 0;

function newWater(px, py, pw) {
    var p = {x: px, y: py, w: pw,
             right: watRight};
    return p;
}

// compute the location of the right end of a platform
function watRight() {
    return this.x + this.w;
}


function setup() {
    createCanvas(480, 300);

    // create an initial collection of cloud
    for (var i = 0; i < 10; i++){
        var rx = random(width);
        cloud[i] = makeCloud(rx);
    }

    for (var i=0; i<10; i++) {
        var rx = random(width);
    }

    var pl = newWater(0, 210, 60);  // first platform
    water.push(pl);

     for (var i=0; i<width/5+1; i++) {
        var n = noise(xoff)
        var value = map(n, 0, 1, 0, height);
        xoff+=inc;
        mountain.push(value);
    }

    frameRate(10);

}


function draw() {
    background(220)
    //background
    noStroke()

    displayHorizon();
    updateAndDisplaycloud();
    removecloudThatHaveSlippedOutOfView();
    addNewcloudWithSomeRandomProbability();

//mountainss
    beginShape()
    fill("blue")
    vertex(0, height); //bottom left corner of mountain
    for (var i=0; i<width/5; i++) {
        vertex(i*6, mountain[i])  //mountain surface
    }
    vertex(width, height) //bottom right corner of mountain
    endShape();

    mountain.shift();
    mountain.push(map(noise(xoff), 0, 1, 0, 300));
    xoff+= inc;


//water and sand
    fill(235, 226, 160)
    rect(0, 250, width, 200);
    fill(98, 147, 204)
    rect(0, 200, width, 50);


    fill("blue");
    noStroke(0);
    for (var i = 0; i < water.length; i++) {
        var p = water[i];
        rect(p.x - offset, p.y, p.w, 10, 10);
    }

    // if first platform is offscreen to left, remove it
    if (water.length > 0 & water[0].right() < offset) {
        water.shift();
    }

    // if last platform is totally within canvas, make a new one
    var lastPlat = water[water.length-1];
    if (lastPlat.right() - offset < width) {
        var p = newWater(10+lastPlat.right(), // start location
              random(210, 235), // height of new platform
              60); // all water have width 200 for now
        water.push(p); // add to our array of water
    }

      offset += 1;


 }

function updateAndDisplaycloud(){
    // Update the building's positions, and display them.
    for (var i = 0; i < cloud.length; i++){
        cloud[i].move();
        cloud[i].display();
    }
}


function removecloudThatHaveSlippedOutOfView(){
    // If a building has dropped off the left edge,
    // remove it from the array.  This is quite tricky, but
    // we've seen something like this before with particles.
    // The easy part is scanning the array to find cloud
    // to remove. The tricky part is if we remove them
    // immediately, we'll alter the array, and our plan to
    // step through each item in the array might not work.
    //     Our solution is to just copy all the cloud
    // we want to keep into a new array.
    var cloudToKeep = [];
    for (var i = 0; i < cloud.length; i++){
        if (cloud[i].x + cloud[i].breadth > 0) {
            cloudToKeep.push(cloud[i]);
        }
    }
    cloud = cloudToKeep; // remember the surviving cloud
}


function addNewcloudWithSomeRandomProbability() {
    // With a very tiny probability, add a new building to the end.
    var newCloudLikelihood = 0.007;
    if (random(0,1) < newCloudLikelihood) {
        cloud.push(makeCloud(width));
    }
}


// method to update position of building every frame
function cloudMove() {
    this.x += this.speed;
}


// draw the building and some windows
function cloudDisplay() {
    var floorHeight = 5;
    var bHeight = 30;
    var cHeight = 40;
    fill(255);
    noStroke()
    push();
    translate(this.x, height - 40);
    rect(0, -bHeight-100, this.breadth, bHeight, 20);
    rect(20, -bHeight-100, this.breadth, bHeight+10, 20);
    rect(20, -bHeight-200, this.breadth, cHeight, 20);
    stroke(200);
    pop();
}


function makeCloud(birthLocationX) {
    var bldg = {x: birthLocationX,
                breadth: 60,
                speed: -1.0,
                nFloors: round(random(2, 7)),
                move: cloudMove,
                display: cloudDisplay}
    return bldg;
}


function displayHorizon(){
    stroke(0);
    line (0,height-50, width, height-50);
}
LO 11
https://www.plagiarismtoday.com/2021/03/16/nfts-and-copyright/
NFTs, non-fungible tokens, are digital art pieces bought with crypto. Although these digital tokens can be copied, the ownership of the token is marked in the Ethereum blockchain,so the owner has a record that they own that token. The issue with copyright is that those who don’t own the NFT can still view it and the owner can provide and sell it: “Other than purchasing the token, buying an NFT doesn’t confer copyright ownership. Owning an NFT, by itself, doesn’t grant the right to print or distribute the work without the copyright holder’s permission.” Although artists can used NFTs as proof of copyright ownership, the concern is that that’s not how its being currently handled. NFTs are currently being used to create and sell copies of work, and the original artists aren’t benefiting.
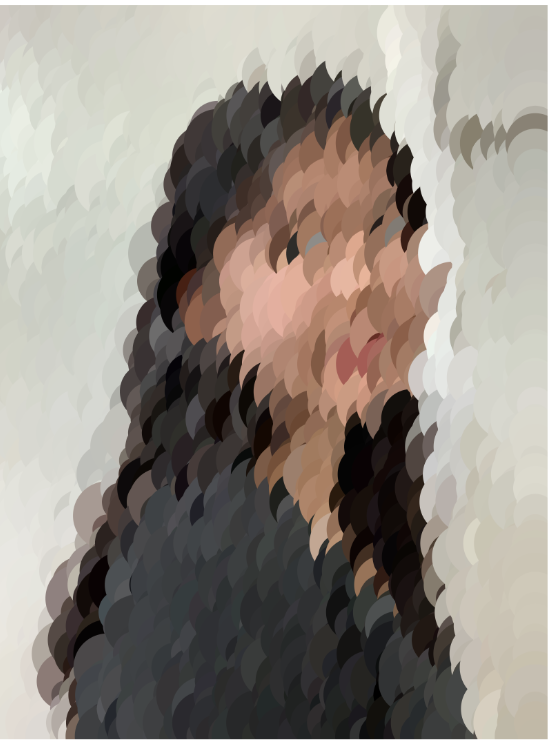
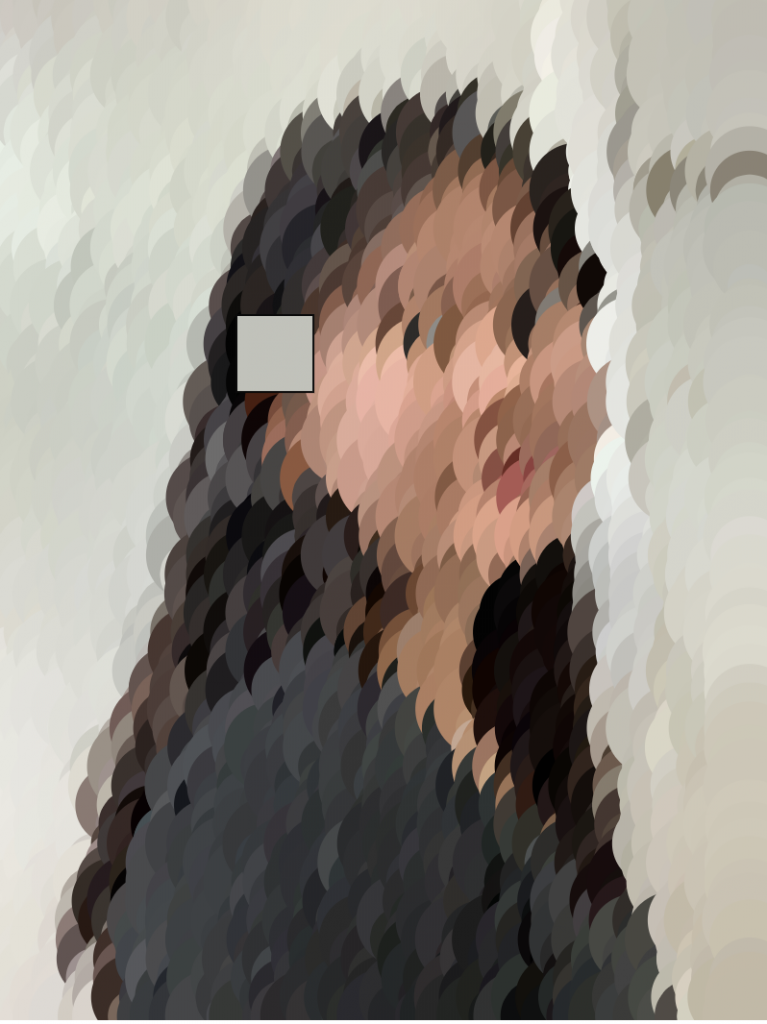
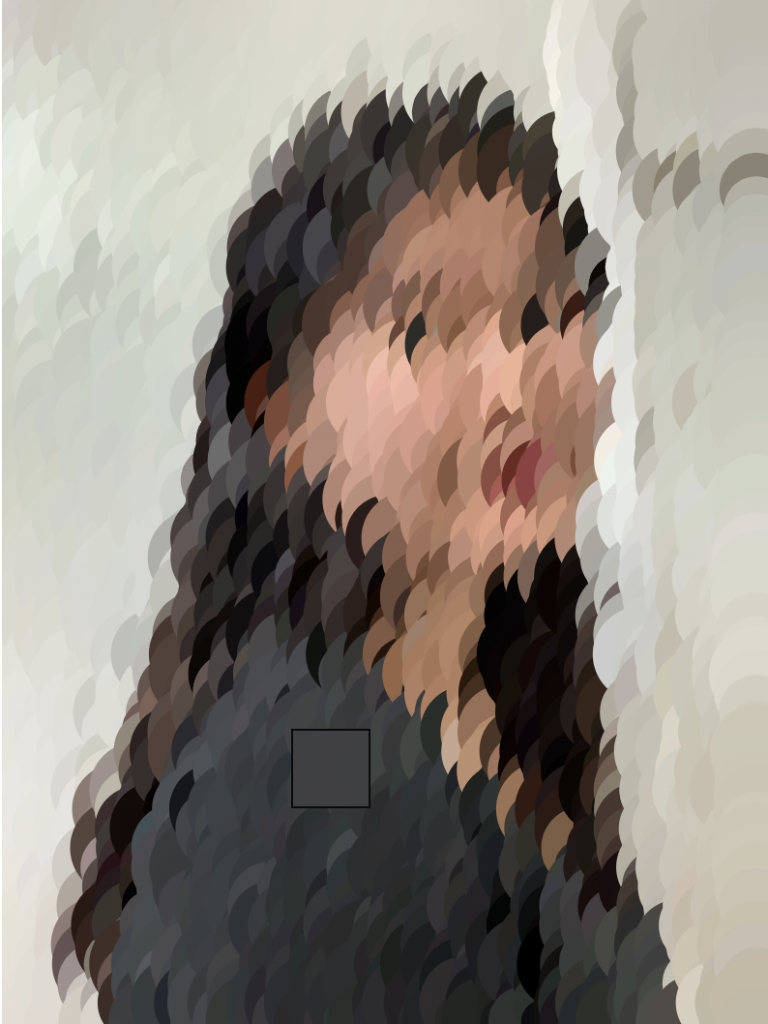
Project 9
I had a lot of fun with this project, but I definitely think i could’ve gone a little farther with it. If I had more time, I would add some more interactive elements with mouseX/mouseY
//Michelle Dang
//mtdang@andrew.cmu.edu
//Project 9
//Section D

var portrait;
var smallPoint, largePoint;

var barY=0;

function preload() {
  portrait = loadImage("https://i.imgur.com/8eYjWUj.jpg");
}

function setup() {
  portrait.resize(portrait.width/2.5, portrait.height/2.5)
  createCanvas(portrait.width, portrait.height);
  print(portrait.width)

  smallPoint = 20;
  largePoint = 40;
  imageMode(CENTER);
  noStroke();
  background(255);
  portrait.loadPixels();
}

function draw() {

  for (var x=0; x<portrait.width; x+=10) {
    for (var y=0; y<portrait.height; y+=10) {
      var c = portrait.get(x, y);
      push();
      fill(color(c))
      noStroke();
      circle(x, y, random(20,50),random(20,50));
      circle(x, y, random(20,50),random(10,15));

    }
  }

  var pointillize = map(400, 0, width, smallPoint, largePoint);
  var x = floor(random(portrait.width));
  var y = floor(random(portrait.height));
  var pix = portrait.get(x, y);
  fill(pix, 128, 128);
  stroke(10)
  rect(x, y, pointillize, pointillize);


  rect(0, barY, width, 40); //horizontal bar
  barY+=12;

  if (barY > portrait.height) {
  barY = 0;
  }


}
LO 9
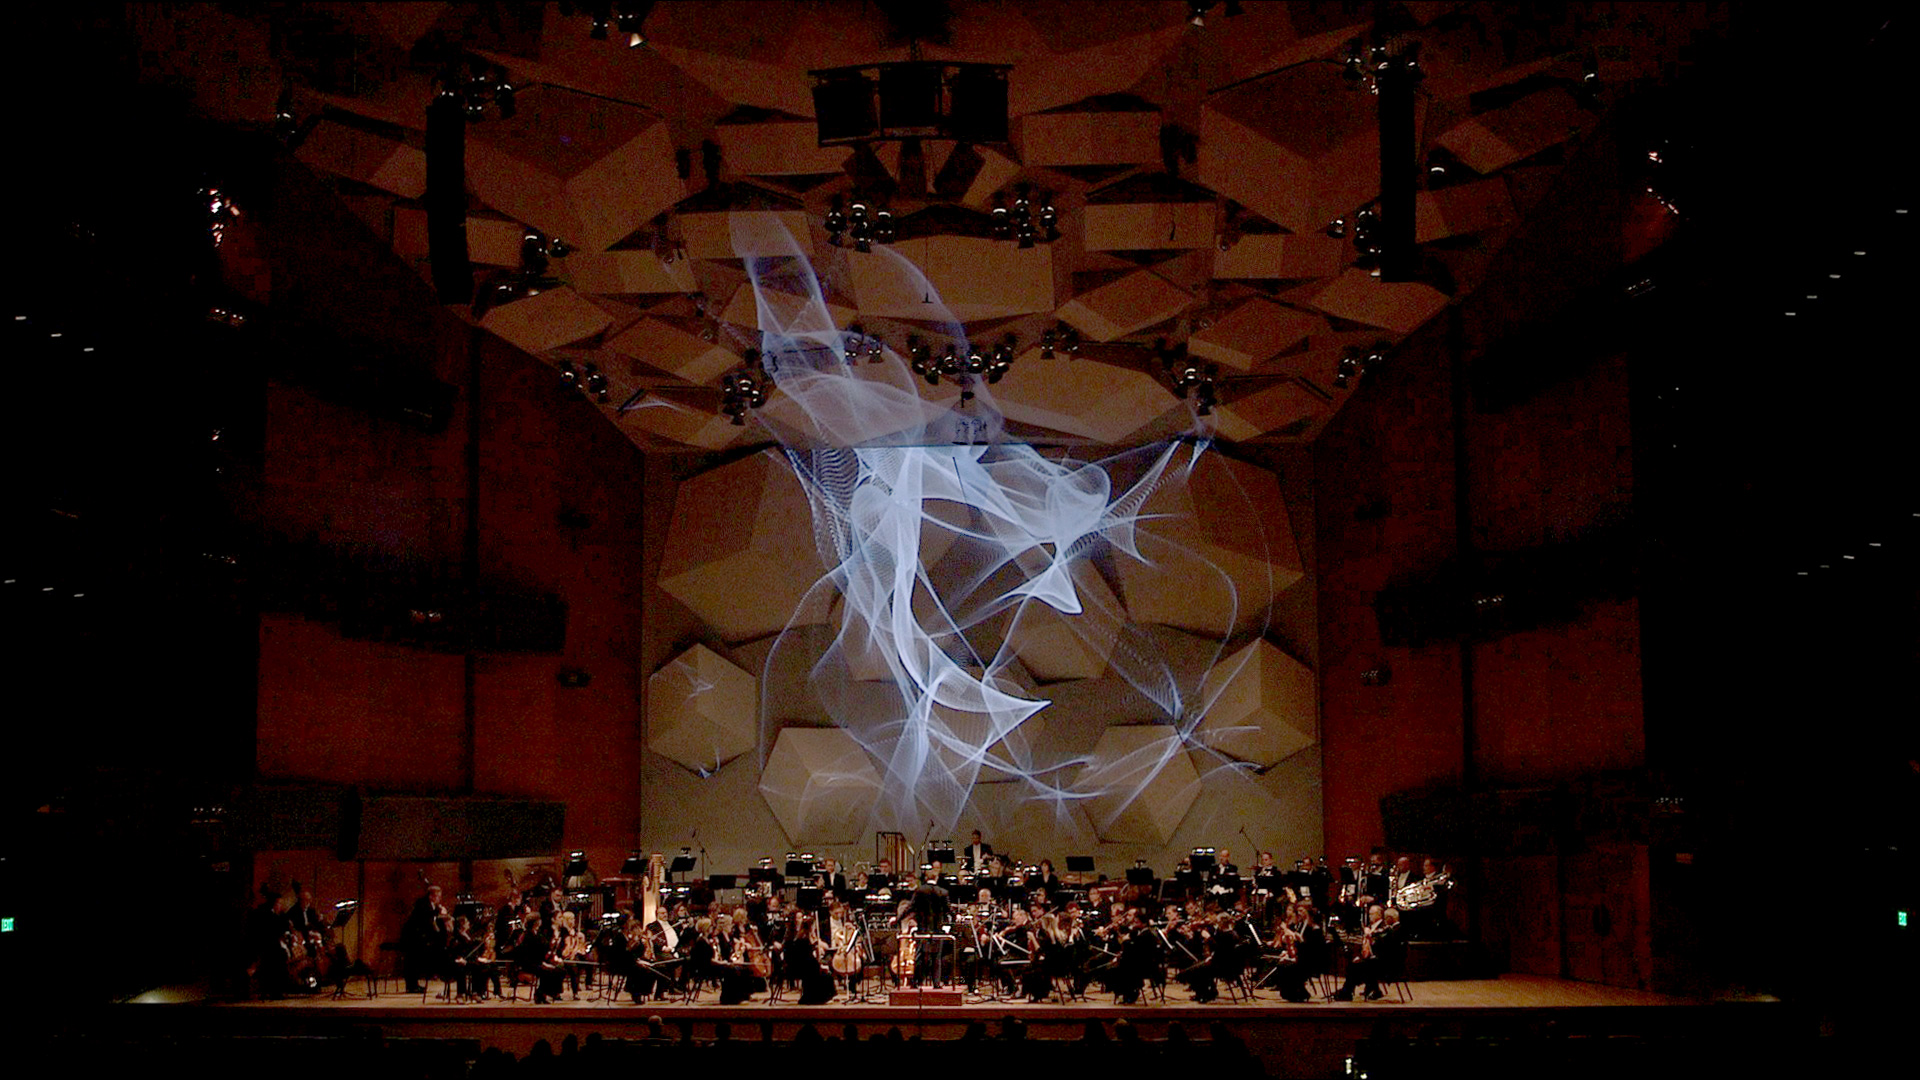
For this looking outwards, I decided to study Yael Braha, a large-scale dynamic display designer that combines traditional and non-traditional art practices, including ceramics, metal fabrication, metal casting, electronics, and mold making. She is originally from Italy where she studied Graphic Design at the European Institute of Design in Rome and then moved to the United States for her Master of Fine Arts in Cinema at San Francisco State University.
One of her works that I found interesting was Artifacts, audio-reactive live show for the Minnesota Orchestra. The visuals are generated based on the timbre, amplitude, frequencies, patterns and narrative of the orchestra’s score in real time. It was captivating to see how she was able to merge a traditional experience of watching a symphony into something surreal, fantastical, and progressive.
LO 8
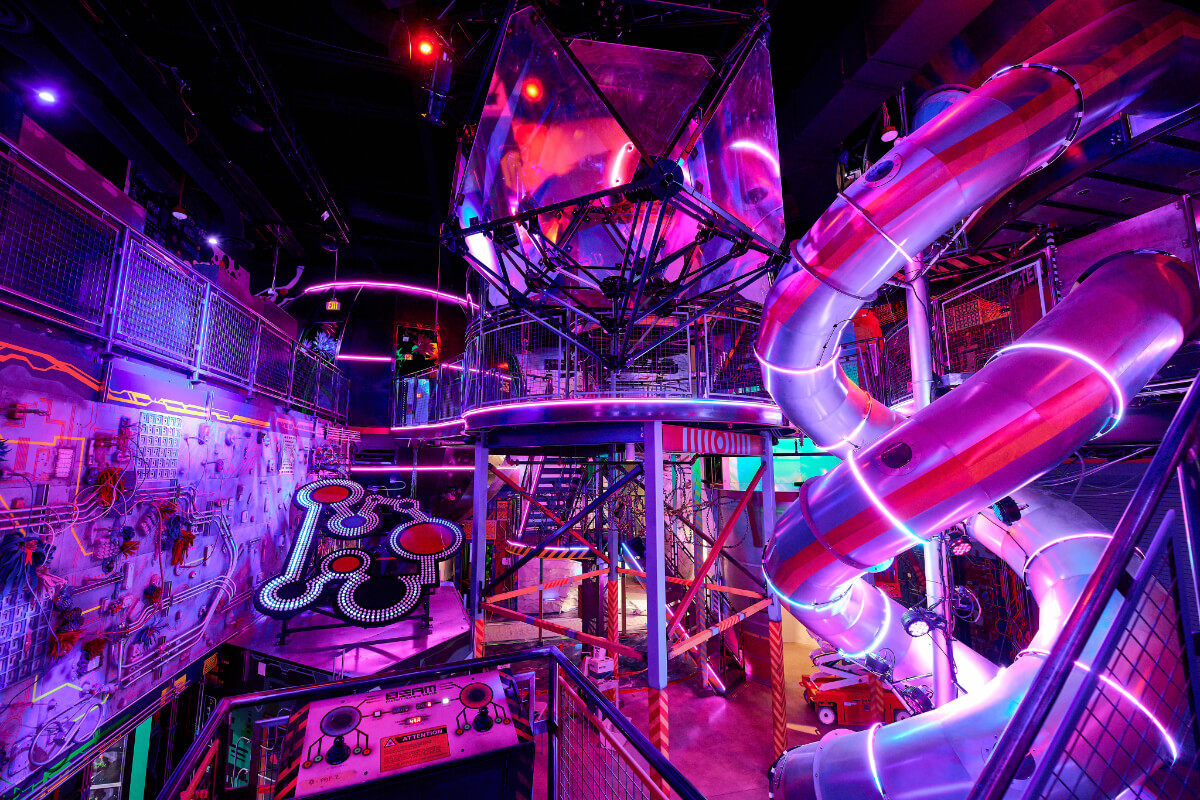
Meow Wolf is a group of artists in Santa Fe, Las Vegas, and Denver that emphasize on experiences that are magical, surreal, playful, and transformative. Their mediums include installation, video, music production, and extended reality content. Something that I’ve noticed about their work is the vibrancy and color. They use UV lights, neon colors, and colored LEDs to create a dream-like atmosphere. People have described it as multidimensional, “a Salvador dali painting”, and a real-life video game. In the Santa Fe exhibit, you enter through normal rooms in a grand way: from a fridge in a kitchen setting, fireplace in a living room, and washer in a laundry room. After entering, each room in the exhibit has a different atmosphere, from space-like rooms to a magical treehouse.
Project 7
//Michelle Dang
//mtdang@andrew.cmu.edu
//Section D
//07 Project
var a3 = 150;
function setup() {
createCanvas(400, 400);
background(220);
}
function draw() {
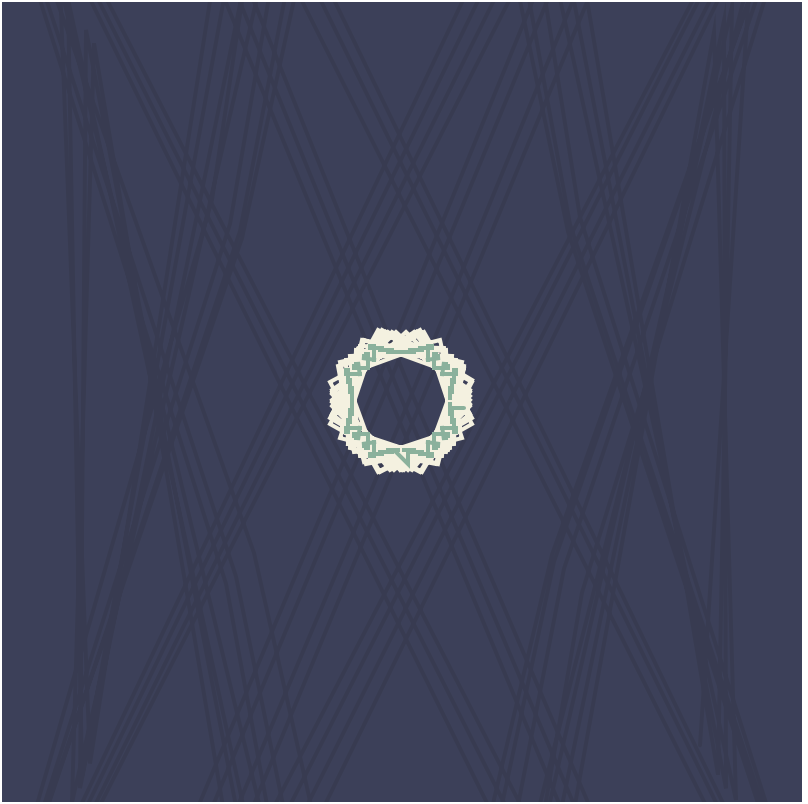
background(60, 64, 91);
cissoid(); //background curve
astroidpedal1(); //yellow curve
astroidpedal2(); //green curve
}
function astroidpedal1() {
beginShape()
noFill();
strokeWeight(2);
stroke(244, 241, 222)
var a = mouseY;
for (var i=0; i< 100; i++) {
var theta = map(i, 0, 100, 0, 150);
var x = width/2+a * (cos(theta))^3; //parametric equation: x=a*cos^3t
var y = height/2+a * (sin(theta))^3; //parametric equation: y=a*sin^3t
vertex(x, y)
}
endShape();
}
function astroidpedal2() {
beginShape()
noFill();
stroke(129, 179, 154)
var a2=mouseX
for (var i=0; i< 400; i++) {
var theta = map(i, 0, 400, 0, TWO_PI);
var x = width/2+a2 * cos(theta)^3;
var y = height/2+a2 * sin(theta)^3;
vertex(x, y)
}
endShape();
}
function cissoid() {
push();
beginShape()
noFill();
stroke(mouseX, mouseY)
translate(200,200)
for (var i=0; i< 80; i++) {
var theta = map(i, 50, 100, 0, 100);
var x = 2*a3*sin(theta)^2; //parametric equation: x=a*sin^2t
var y = (2*a3*sin(theta)^3) / cos(theta) //parametric equation: y=a*cost(t)
vertex(x, y)
}
endShape();
pop();
}

LO 7
In 2018, Aaron Koblin and Janet Echelman created Unnumbered Sparks, an interactive net sculpture in the sky as a canvas for users to interact with. Aaron Koblin worked on the Google Data Arts Team and Janet Echelman is an artist who specializes in large-scale textiles.
The installation is made of braided fibers stronger than steel. Users act as co-creators as they connect through their phones and can draw with light. Their drawings are projected onto the sculpture. Additionally, every interaction creates a sound.
Unnumbered Sparks

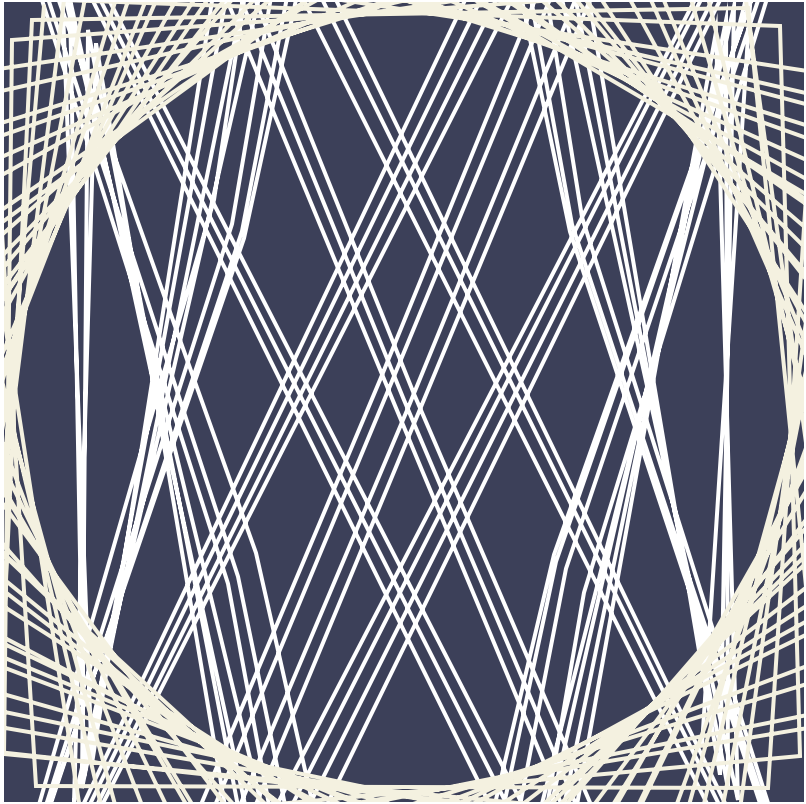
Abstract Clock
angle = 20;

var x= 0;
var y = 300;

function setup() {
    createCanvas(480, 480);
}

function draw() {

    s = second();
    m = minute();
    h = hour();

    dx1 = 600/s; // used for line seconds
    dy1 = 600/s;
    dx2 = 200/s;
    dy2 = -200/s;
    x1 = 100; // used for line seconds
    y1 = 40;
    x2 = 300;
    y2 = 400;

    angles = 30

    push();
    background(244, 241, 222);
    for (var i = 0; i < s; i += 1) { //second lines
        strokeWeight(2)
        stroke(129, 179, 154)
        line(i, y1, x2, y2);
        x1 += dx1;
        y1 += dy1;
        x2 += dx2;
        y2 += dy2;
    }
    pop();

    for (var i = 0; i< m; i+=1) { //minute circles
        noFill();
        stroke(223, 122, 94)
        strokeWeight(2);
        ellipse(300, 100, i*7, i*7) //increase circle size
    }

    for (var i = 0; i< h; i+=1) { //hour circles
        push();
        translate(240, 240)
        noFill();
        stroke( 60, 64, 91)
        strokeWeight(3);
        rotate(radians(50));
        ellipse(i*25-300, 40, 15, 15) //change circle position
        pop();
    }

    timer(x, y); //bottom right timer


    if (h < 7 || h>=19) {
        noStroke() // moon depending on hour
        fill(60, 64, 91)
        ellipse(430, 380, 80, 80);
        fill(244, 241, 222)
        ellipse(450, 370, 80, 80);
    } else {
        sun(); //sun depending on hour

     }
 }


function timer(x, y) { //for bottom right corner
    textSize(20);
    push();
    noStroke()
    fill(250)
    rect(380, 450, 100, 50);

    fill( 60, 64, 91)
    text(h, 390, 470)

    fill(0)
    text(":", 412, 470)

    fill(223, 122, 94)
    text(m, 420, 470)

    fill(0)
    text(":", 442, 470)

    fill(129, 179, 154)
    text(s, 450, 470)
    pop();

}

function sun() {
        translate(410, 380);
        noStroke();
        fill(222, 222, 74)
        ellipse(0,0, 50, 50);
        for (var i = 0; i< 50; i++) {
            rotate(radians(angle))
             rect(-5,-10, 5, 60);
        }
}
Looking Outwards 6
http://www.random-art.org/online/
The Random Art Program by Andrej Bauer is a website that generates an image based on the text the user inputs as the title. The test is used as the seed for a pseudo-random number generator for a mathematical formula. The formula dictates color and sequence of random choices. Although the same title always produces the same image, it is difficult to predict the outcome of the image from the name alone. If the title has two words, the first word determines color and layout, and the second word determines composition and selection of graphics.
I had a lot of fun trying out different titles. The program is case sensitive, drastically affecting the outcome of the image.